
Abstract
Students with and at risk for emotional and behavioral disorders (EBD) struggle to acquire and develop writing skills. To support their students’ unique needs, it is important for teachers to monitor student writing progress to make instructional decisions based on data. In this article we describe methods for progress monitoring focused on writing skills. We describe a feasible system for continuous progress monitoring. We also address setting and monitoring goals for students with and at risk for EBD.
Writing is a valuable tool that allows individuals to communicate effectively with a variety of audiences, learn proficiently, and express themselves. The ability to write is required for full engagement and success in almost all professional, social, community, and civic activities (Graham et al., 2016). In school, writing helps students make sense of and communicate their understanding of texts they read. Professionally, it is challenging to think of a job that does not require at least some writing, with over 90% of midcareer professionals indicating that effective writing is extremely important in their day-to-day work (Light, 2001). Socially, we communicate with others through letters, emails, text messages, and social media posts. Writing has even revolutionalized our world, with some of our most notable historical leaders, such as Martin Luther King, using writing to effectively lead movements of social change and justice. In summary, in our rapidly changing world, the ability to write, and write well, is expected.
According to the Simple View of Writing (SVW; Berninger & Amtmann, 2003), successful writing consists of (a) text transcription, or the ability to write words (e.g., phoneme-grapheme correspondence, orthographic knowledge, phonics); (b) text generation, or the ability to connect words together into a cohesive thought (e.g., vocabulary, syntax, semantics); and (c) self-regulation, or the ability to navigate the steps of the writing process (e.g., planning, organizing, editing). Each of these factors are, in turn, constrained by attention and working memory. That is, a writer must attend to the task long enough to get their thoughts written. Given the complex and interconnected skills and subskills required for successful writing, it is no wonder that over 70% of students nationally perform below proficient levels in writing (National Center for Education Statistics [NCES], 2012).
For students with disabilities, these tasks may present an even more significant challenge, with over 95% of students with disabilities performing below proficient levels (NCES, 2012). For example, students with disabilities (a) write less fluently, affecting their overall output (Datchuk et al., 2020); (b) spend less time on and are unsure how to engage in the steps of the writing process (e.g., planning, organizing editing); and (c) produce writing that, as a result, is shorter with more errors than their typically developing peers (Taft & Mason, 2011).
Writing is often particularly challenging for students with and at risk for emotional and behavioral disorders (EBD; Gage et al., 2014). This may be the case because students with EBD require increased support with self-regulation strategies (Mastropieri & Scruggs, 2014), a central component to successful writing (Berninger & Amtmann, 2003). In addition, students with EBD may experience writing as an aversive task and, therefore, demonstrate task-avoidant behaviors that lead to missed instruction and fewer opportunities to practice and develop writing skills.
Potential behavioral challenges also mean that goals and methods for data gathering may vary for students with EBD. More emphasis may need to be placed on the student’s observed experience with the writing process to determine the areas in which the student struggles with writing compared to areas where the student may avoid the task. Table 1 provides considerations for progress monitoring in writing as well as differences in progress monitoring for struggling students versus students with EBD.
Comparisons of Progress Monitoring for Struggling Students and Students With EBD.
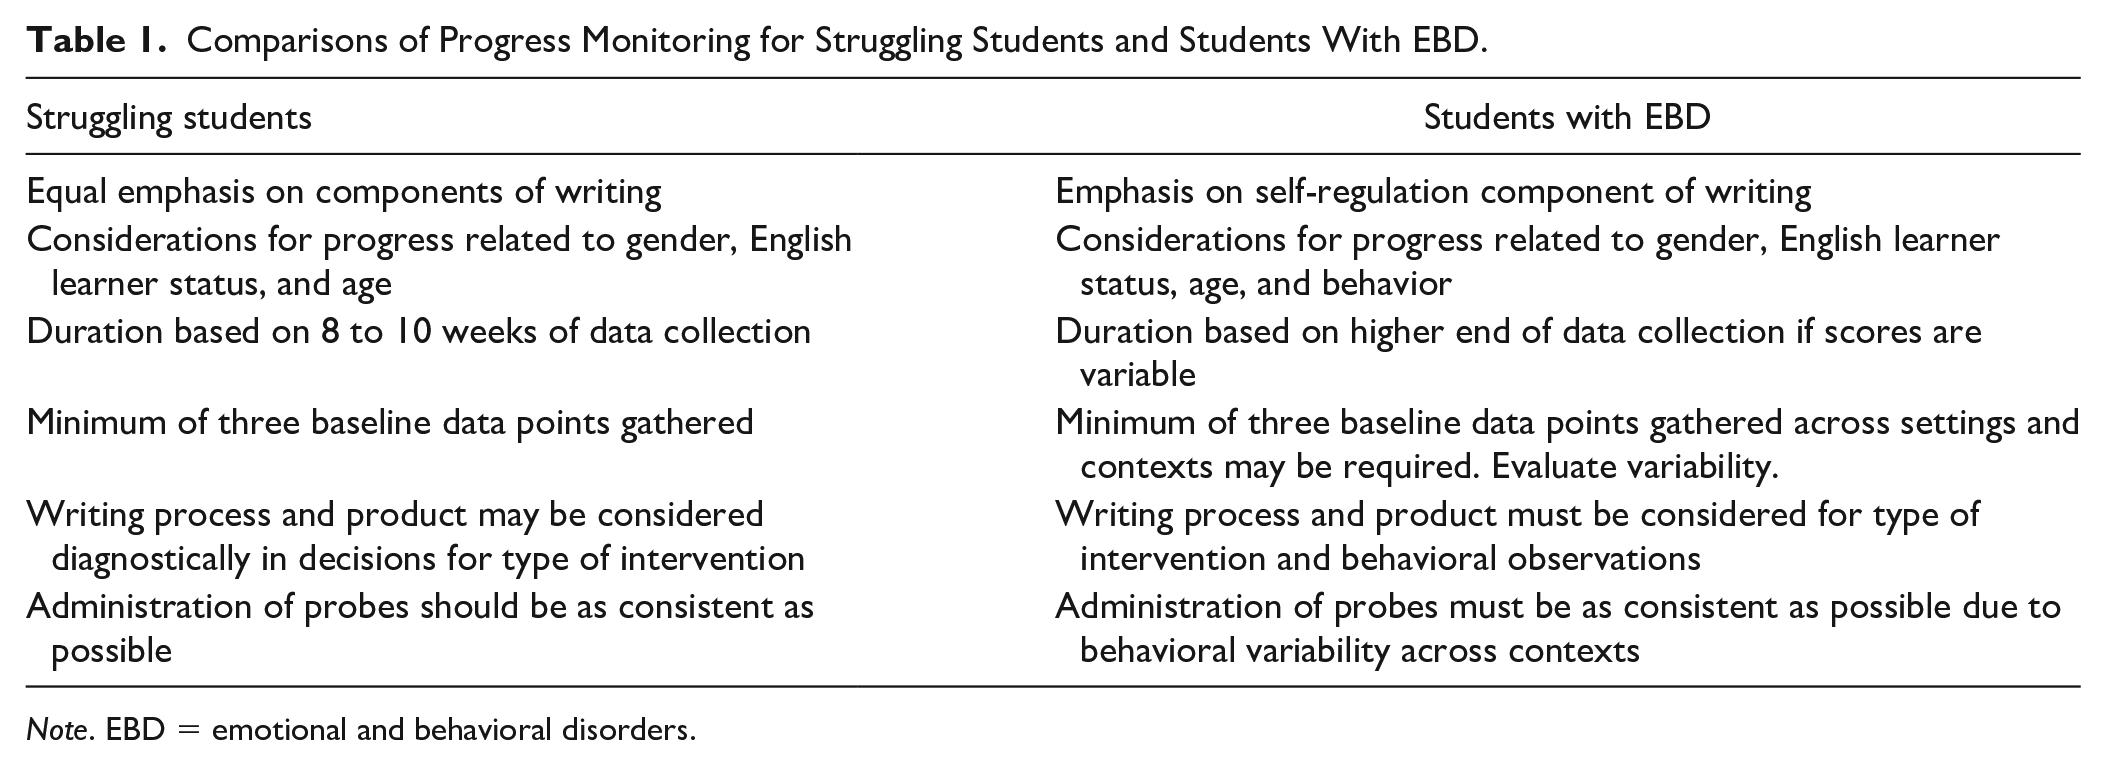
Note. EBD = emotional and behavioral disorders.
Students with writing difficulties typically benefit from intervention that focuses on each of the components of writing (text transcription, text generation, and self-regulation), as all are necessary components for effective writing. In contrast, students with EBD may demonstrate some difficulties with text transcription and text generation because of missed instruction and opportunities to practice writing but mostly benefit from a heavy emphasis on the self-regulation component of writing, as this is an area of need for many students with EBD. Relatedly, behavior must be considered when making considerations for progress, as there is consensus that behavior and academic learning are closely related.
Another important factor to consider is that students with EBD commonly exhibit variable performance on assessments because of related behaviors. Making decisions with variable data requires additional considerations, such as collecting data for a longer period, ensuring that administration of probes is as consistent as possible, and gathering baseline data across multiple settings if variability is noted. Lastly, in addition to using the writing process and product to make decisions about which writing intervention to use instructionally, teachers of students with EBD also need to consider behavior when selecting an intervention, as it is important that the intervention include behavioral supports that will benefit the target students.
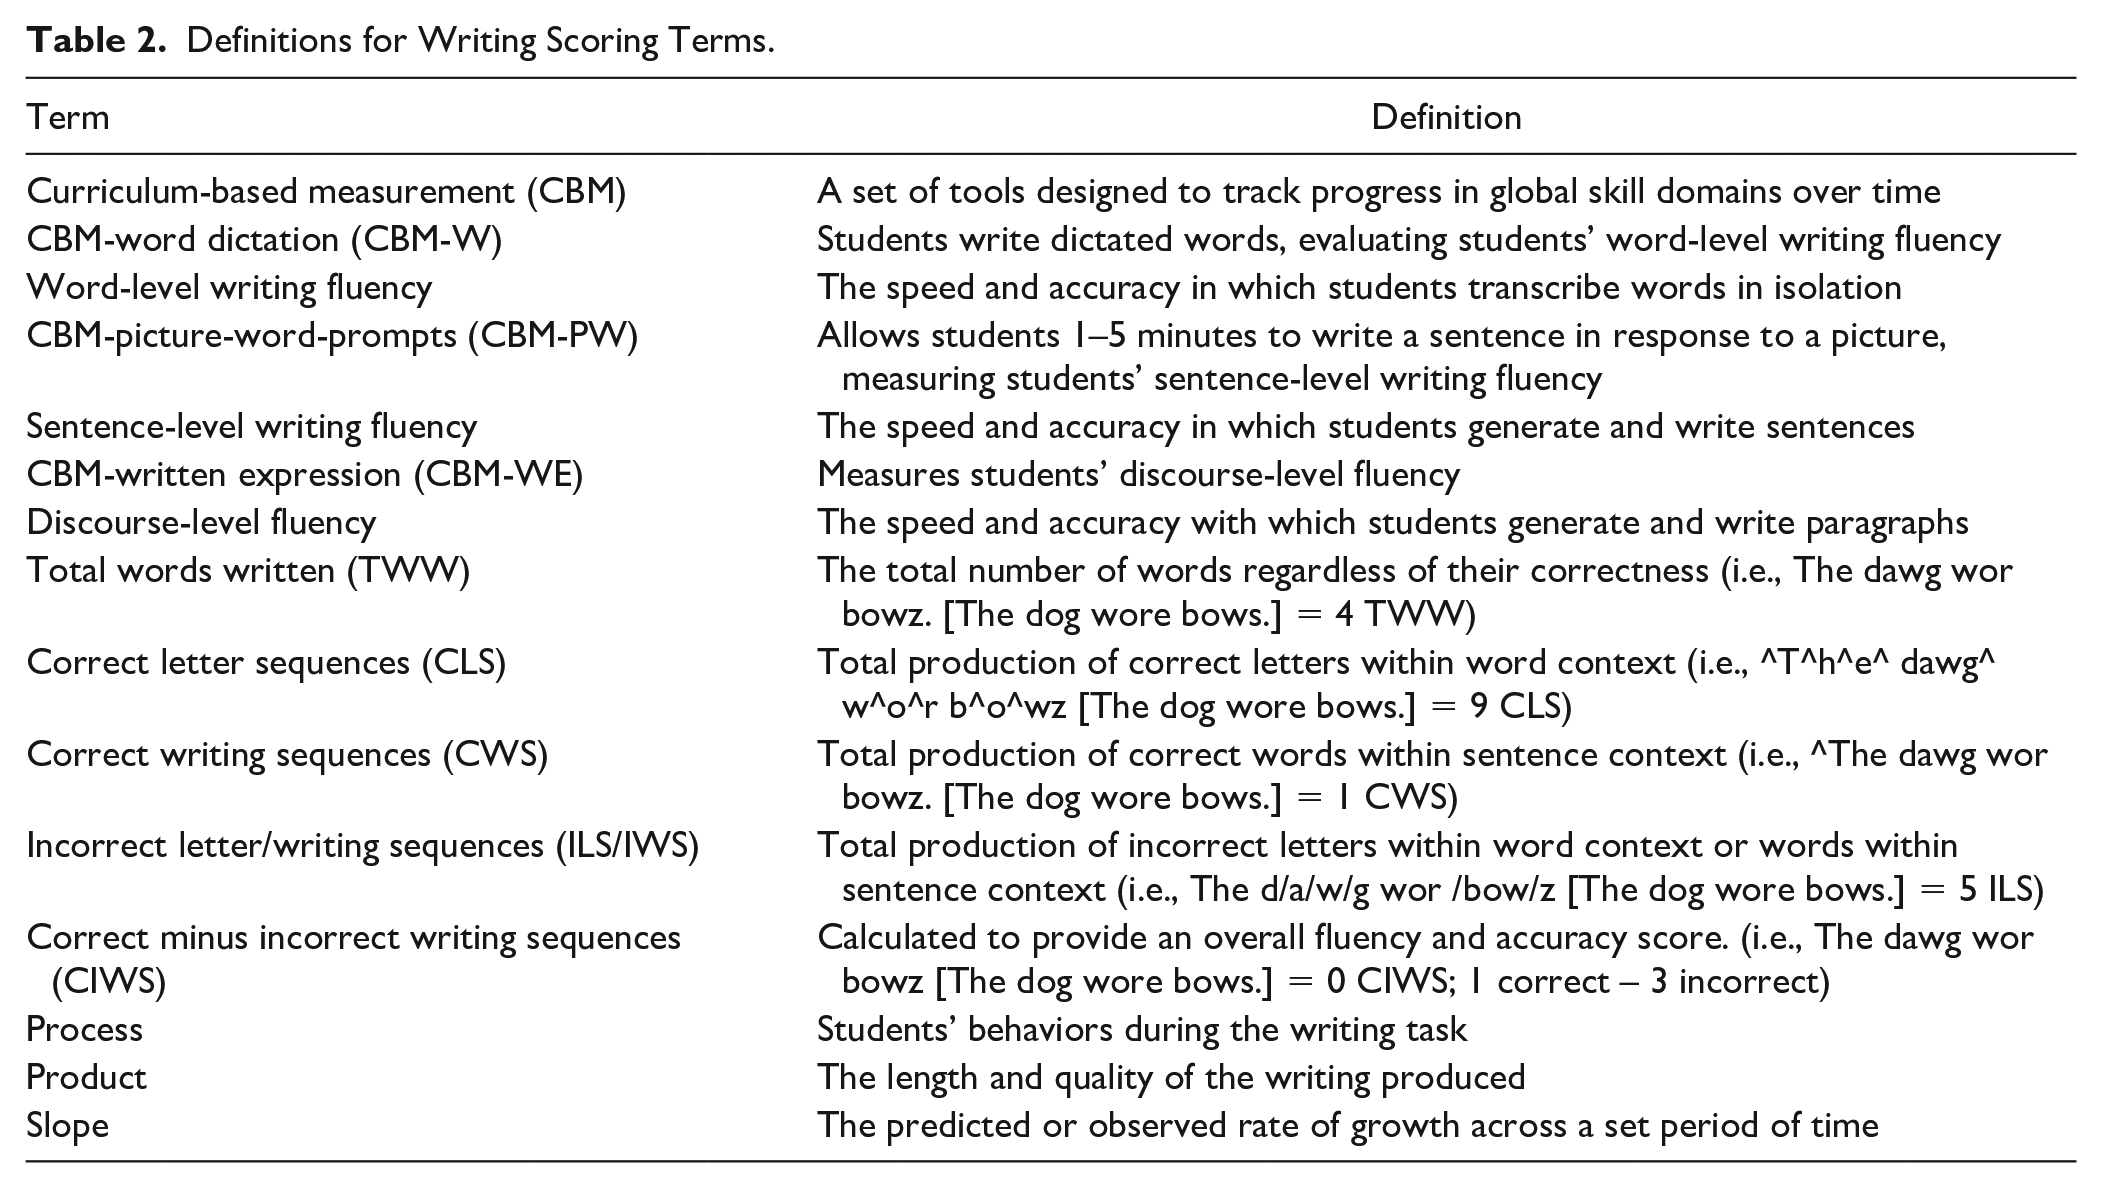
Data-based decision making (DBDM), or data-based individualization (DBI), is a widely recommended, research-based method in which teachers use student progress-monitoring data to intensify an intervention. DBDM/DBI is an iterative process that consists of (a) implementing an intensive intervention, (b) monitoring student progress to determine response to the intervention, (c) administering diagnostic assessment to determine areas of need if the student demonstrates inadequate response, and (d) intensifying intervention to meet the identified needs (National Center on Intensive Intervention [NCII], 2013). It has been successfully used to intensify writing interventions (Jung et al., 2017). However, evidence suggests that teachers continue to require support to engage in the DBDM/DBI process (Gesel et al., 2021), including DBDM/DBI in writing (Lembke et al., 2018). To support teachers, several practitioner-oriented articles discuss DBDM/DBI in reading (Filderman & Toste, 2018), math (Powell & Stecker, 2014), social and emotional learning (Filderman et al., 2023), and writing (Lam et al., 2022; Poch et al., 2022). The present article is intended to further support the needs of teachers of students with EBD, who require a unique approach to writing instruction and a corresponding approach for monitoring progress. We discuss each of the steps for DBDM/DBI with a specific focus on the needs of students with EBD using a hypothetical case scenario to illustrate each of the steps. A glossary of terms is provided in Table 2.
Definitions for Writing Scoring Terms.
Ms. Medved, a special education teacher in her third year of teaching, and Mr. Marin, the English language arts (ELA) teacher, met for their weekly co-teaching meeting to discuss ways to support the students with disabilities in Mr. Marin’s classroom. Mr. Marin expressed his concerns regarding Vasya, a fifth-grade student with EBD. He shared that when working with Vasya in a small group, she participated, and it was evident that she understood the content because of her accuracy in responding to questions. However, during writing tasks, Vasya would shut down, often refusing to complete the work. He inquired about additional ways to support Vasya above and beyond the small group support.
Together, Mr. Marin and Ms. Medved examined Vasya’s writing samples. They noticed that although Vasya spelled accurately, she was unable to clearly express her thoughts. For example, when asked to write a paragraph summarizing an article she read, Vasya copied details without providing the main ideas presented in the article or providing structure to the paragraph. They reviewed available interventions on the NCII website (intensiveintervention.org) to support her paragraph writing and decided to implement self-regulated strategy development (SRSD) since the intervention focuses on organization of thoughts (see Sanders et al., 2019). With an intervention in place, Ms. Medved developed a plan for Mr. Marin to monitor Vasya’s progress to determine whether the intervention was working for her and, if not, to adjust the intervention to better support her needs.
Progress-Monitoring Steps
Monitoring student progress for decision making requires (a) preparing for progress monitoring by gathering baseline data, (b) setting and analyzing progress toward goals, and (c) gathering additional information to intensify intervention for students who demonstrate inadequate response. In the next sections, we describe the steps for progress monitoring of writing skills within each of these areas.
Preparing for Progress Monitoring
Step 1: Select a tool
Curriculum-based measurement (CBM) is a set of tools designed to track progress in global skill domains over time (NCII, 2013). Aligned with CBM in other academic areas (Ardoin et al., 2013), CBM in writing has demonstrated technical adequacy (McMaster et al., 2017) and is sensitive to growth over time (Datchuk et al., 2020). Thus, CBM in writing presents a viable method for evaluating student progress in writing over the course of the intervention.
CBM in writing includes word dictation (CBM-W), picture-word-prompts (CBM-PW), and written expression (CBM-WE). For CBM-W, students write dictated words, evaluating students’ word-level writing fluency (Lam et al., 2022), defined as the speed and accuracy in which students transcribe words in isolation. The CBM-PW tool allows students 1–5 minutes to write a sentence in response to a picture, measuring students’ sentence-level writing fluency (Lam et al., 2022), defined as the speed and accuracy in which students generate and write sentences. The CBM-WE scoring mechanism measures students’ discourse-level fluency, defined as the speed and accuracy with which students generate and write paragraphs. In this case, following a story prompt, students write a response to a story starter (e.g., One day, I was out sailing when . . .). For expository prompts, students write a descriptive response based on a factual prompt (e.g., Someone I consider to be a hero is . . .).
The CBM-WE tool allows 1 minute for planning and 3–10 minutes for writing (Furey et al., 2016). Although each CBM is progressively more advanced (i.e., word to sentence to paragraph writing), students may struggle with a prerequisite skill while still demonstrating mastery of later skills. To select a CBM, consider student writing samples and observations during writing times. If the student struggles with spelling by making many spelling mistakes or getting frustrated writing words, CBM-W may be the most appropriate probe even if the student is able to produce structured paragraphs. For students who struggle with organizing their thoughts (e.g., student samples are disorganized, student appears agitated during longer writing tasks), the CBM-WE may be more appropriate. A list of validated writing CBM may be found on the tools chart on the NCII website.
Once a writing sample is obtained, data may be scored and calculated in a variety of ways. Total words written (TWW) evaluates the total number of words regardless of their correctness (e.g., spelling, syntax). Correct letter sequences (CLS) for CBM-W and correct writing sequences (CWS) for CBM-PW and CBM-WE may be calculated to determine the total production of correct statements. Incorrect letter/writing sequences (ILS/IWS) account for correctness of writing and are more frequently used for the purposes of progress monitoring (Datchuk et al., 2020). In this case, correct minus incorrect writing sequences (CIWS) are calculated to provide an overall fluency and accuracy score. Table 2 provides examples of each of these within a student writing sample.
There is some variability in recommendations for what is counted as correct. For example, some researchers recommend that sequences must be correct within the context of the sentence while others count the sequences in isolation. Some require correct spelling, while others allow for incorrect spelling as long as the spelling is phonetically accurate (e.g., spelling is incorrect but plausible; Datchuk et al., 2020). Although the scoring procedure itself is open to interpretation, it is essential that teachers decide upon scoring procedures in advance and then use these scoring procedures consistently across all probes. To decide on a scoring procedure, consider the student and the intervention. For example, phonetically accurate spellings may be useful indicators of progress for students in earlier stages of writing development. Phonetically accurate spellings might also be useful when the intervention is targeting written expression, as in this case, spelling is not as important as syntactically accurate and meaningful sentences.
In addition to providing helpful information on accuracy, CBM-WE also may be used to evaluate the writing process and product for the purposes of intervention selection. In this case, data that would be the focus of interpretation include the students’ behaviors during the writing task (i.e., process) and the length and quality of the writing produced (i.e., product; Lam et al., 2022). These observational data may be particularly important for teachers of students with or at risk for EBD, as understanding the function of behavior is vital in ensuring that an appropriate approach is enacted.
We therefore recommend teachers use this important information in conjunction with the accuracy data gathered as previously described. Again, consistency is the most important consideration when determining how to score written process and written product. Define behaviors to look for when the student is engaging in the writing process based on general observations of the student, the behaviors being addressed, and the behaviors being taught. Figure 1 includes an example of a measurement tool that a teacher may use for these purposes with students with EBD.
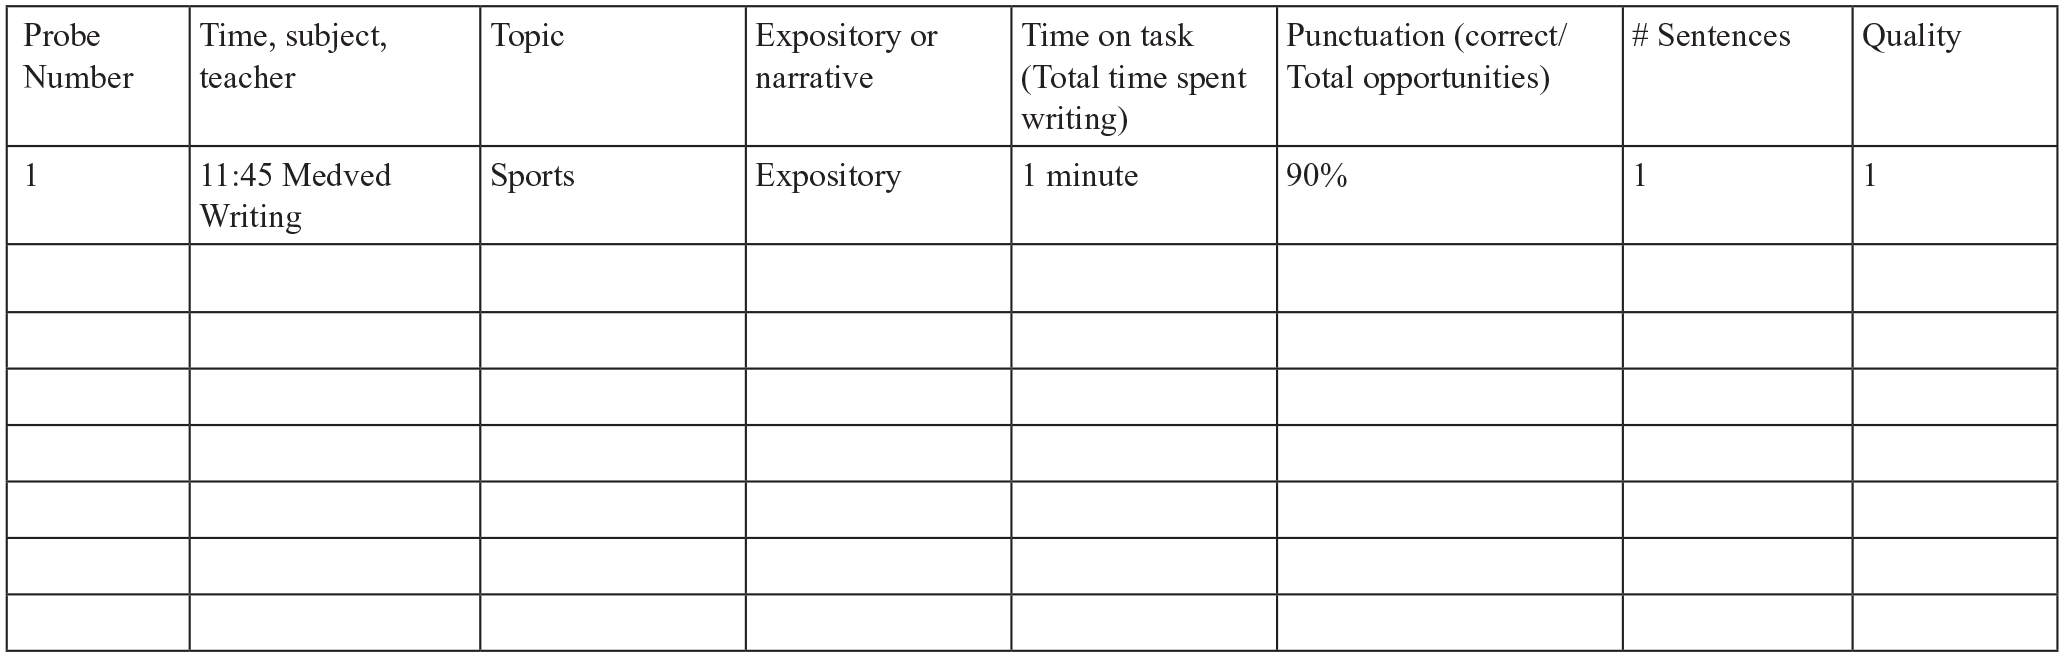
Example of Process and Product Tracking Tool.
Step 2: Gather baseline data
Once a tool is or tools are selected, gather baseline data so that a goal may be set based on the student’s present level of performance. For academic CBM, research suggests using the median data point of a minimum of three baseline probes to establish the student’s baseline performance (Stecker & Lembke, 2011). If the student has been receiving Tier 2 intervention, guidelines recommend using the last three data points collected on the student’s progress as a baseline. If not, teachers can get a reliable estimate of a student’s performance by administering three probes within approximately a week (IRIS Center, 2023).
For students with and at risk for EBD, it may be necessary to gather additional baseline data points, and to gather baseline data points from only one setting, after observing the student across a variety of settings, times, and topics to determine which setting presents the most accurate portrayal of the student’s abilities (Bruhn et al., 2018). This will also ensure that no confounding variables are interfering with the student’s performance and provide a clearer understanding of student performance on the writing task itself (Farmer et al., 2016; Kern & Wehby, 2014).
For example, if a student does not have a good rapport with their ELA teacher, their struggles with the writing task may be a combination of the perceived difficulty of the task and their relationship with their teacher. It is possible that, although writing is difficult for the student across content areas, this is compounded by the relationship and correspondingly may be a larger contributor to the student’s perceived academic challenge. Similarly, if the student is interested in a topic, they may be less avoidant and more motivated to complete the task. This may provide a more accurate understanding of the student’s writing ability compared to a non-preferred writing topic.
Finally, if the student is asked to write at a non-preferred time, such as at the end of a long reading block, they may struggle more due to their drained attentional resources, and self-regulation may therefore also already be taxed prior to the writing task. Thus, gathering data across settings, times, and topics, and taking the median data point of the observations, provides a more accurate understanding of the student’s level of performance to set an accurate and appropriate goal.
Tips for planning success
With any student, it is important to set them up for success. For students with EBD, it will be particularly important to consider the setting, time, and teacher with which they will be the most responsive to assessment. It will also be important that the student is aware that they will be engaging in frequent brief assessments to support their needs. Because there is not a large amount of flexibility in the types of measure that may be used for progress monitoring in writing, making sure that the student understands the task and the reason for it will help to prepare the student for their experience.
Another consideration is whether the student might work toward a reward for their assessments. Because progress monitoring requires frequent probes, a small reward for completing each assessment and/or a larger reward after completing each phase of progress monitoring may help to promote the student’s effort and engagement in the task. This in turn will provide the teacher with the most reliable and valid data possible to determine a student’s initial levels and ongoing progress.
For each of these considerations, we encourage teachers to conference with their student before gathering any progress-monitoring data to discuss the plan, as well as answer any questions the student might have. If appropriate, the student may be asked to identify how they would like to engage in these assessments. The teacher can also discuss any potential rewards or provide a preference assessment for the student during this time.
Preference assessments help teachers identify items that a student is motivated to earn by achieving their academic and behavioral goals. To conduct a preference assessment, teachers make a list of tangible items that are both motivating to the student and acceptable to school administration. Following this, students rank the items on the list based on their personal preference and then select an item to earn by meeting the specified academic and behavioral goals (Hilsmier et al., 2016; McKenna & Bettini, 2018). In addition, a checklist or schedule can be used as an advance organizer to communicate the activities and tasks the student is expected to complete during the lesson or the academic and behavioral goals for the lesson. These types of schedules can be used to check off activities or tasks as they are completed, with the student earning a preferred reward or incentive identified by the preference assessment upon completing all tasks. In summary, we encourage teachers to consider how they will conference with their student to set them up for success as part of their initial planning for progress monitoring to ensure the student’s needs are met.
Ms. Medved considered the available tools for monitoring Vasya’s writing progress. Based on Vasya’s writing samples, she knew that Vasya was able to write full sentences but was unable, or unwilling, to clearly communicate her thoughts across longer writing tasks (e.g., sentences within paragraphs did not surround a coherent topic). For this reason, she decided she would use CBM-WE to evaluate Vasya’s discourse-level fluency. She decided to start with narrative prompts because, based on her interactions with Vasya, these were preferred and would give a more accurate understanding of Vasya’s strengths as well as needs. Because Vasya’s spelling was not being considered, Ms. Medved decided that she would score based on CWS instead of incorrects based on spelling errors. Because production (i.e., total amount written) was an issue wherein Vasya would avoid the task altogether, she decided not to subtract incorrect sequences for the time being. She also made a note to track Vasya’s process and product as part of the progress-monitoring plan.
Although Mr. Marin reported that Vasya struggled with writing, Ms. Medved also noted that he often has students write at the end of the ELA block, which is right before students break for lunch. Ms. Medved wondered whether it might be possible that Vasya was starting to get tired and hungry by this time, which contributed to her avoidance of the writing task. She decided that she would implement a narrative writing prompt three times throughout the day in the middle of the week to determine whether the time of day or subject might be interfering with her progress. She set about gathering these data points and continued to implement the SRSD intervention.
Implementing Progress Monitoring
Once a teacher has established a student’s baseline levels of performance, a goal can be set, and decisions can be made as the student’s progress is evaluated over time. It is essential during this time to ensure that the student is receiving their intervention as intended (Kittelman et al., 2021; Roberts, 2016). A fidelity of implementation form may be useful for these purposes, which includes adherence to intervention protocols and implementation at the dosage proven to be effective for students with similar learning profiles. Often, an intervention package will include a fidelity checklist. If not, refer to the original research article for this checklist or a description of critical elements of the intervention. In the next section, we describe steps for setting and analyzing progress toward goals including (a) determining frequency and duration of progress monitoring; (b) setting a corresponding goal; and (c) graphing and analyzing the data.
Step 3: Determine frequency and duration
CBM writing scoring tools have demonstrated sensitivity to growth within a relatively short time frame when using the metric of CIWS for students in younger grades, with growth rates established within 3 weeks, and within 5 weeks when using CWS or CIWS for students across elementary grades (McMaster et al., 2017). However, the slope becomes reliable and stable after a minimum of 8–9 weeks of data collection (McMaster et al., 2011). For example, in the hypothetical scenario we would recommend collecting CWS data for at least 5 weeks. We also emphasize the importance of consistency in administration for this population (Bruhn et al., 2018). That is, administer each assessment with the same evaluator, setting, and time. This will help to reduce some variability in scores and ensure that a reliable trend is established. Even so, data may need to be gathered over a longer timeframe due to the differences in student behaviors that may produce more variability in data even with consistent data-gathering procedures in place. If time allows, more data collection (e.g., 9 weeks or more) is always better (McMaster et al., 2017).
Step 4: Set a goal
There are several considerations for setting goals related to writing in general, including the impact on the slope related to grade level, initial performance levels, English learner status, and gender. Specifically, students in earlier grades (i.e., Grades 2 and 3) may have more consistent growth across weeks, whereas students’ growth in later grades may start to wane after a 10-week data-collection period (i.e., Grades 4 and 5; McMaster et al., 2017). Students in earlier grades also show steeper slopes during intervention than students in later grades (Datchuk et al., 2020). Students with lower baseline scores or initial achievement levels than the normative performance of grade-level peers also have steeper slopes or rates of improvement than students with a higher baseline score (McMaster et al., 2017). Students who are English learners also have demonstrated slower rates of growth (Datchuk et al., 2020). Finally, girls’ initial performance levels and growth rates have been shown to exceed those of boys (McMaster et al., 2017). Although all of these are important considerations, boys are more frequently identified with EBD (Novak et al., 2020). As such, this will be a particularly important consideration when setting goals for this population of students.
With each of these considerations in mind, a recent systematic review indicated that struggling writers receiving intervention grew on average .39 CWS per minute per week across grade levels (Datchuk et al., 2020). Students in earlier elementary grades have steeper slopes as previously mentioned. For instance, prior research has found a growth rate of between .5 and 1 CWS for first-grade students with or at risk for disabilities (Jung et al., 2017). Within these ranges and considerations, educator expert judgment is needed to determine the initial goal rate on an individual student basis. For example, a hypothetical female student in first grade who is fluent in English with a lower baseline score might have a projected growth rate of 1 CWS, whereas a similar student who is currently learning English may have a projected growth rate of .75 CWS. A hypothetical student who is male in first grade with a low baseline score may have a growth rate of .9, whereas the same student in fifth grade may have a growth rate of .3. The central consideration is that goals are rigorous but attainable so that the educator can truly determine whether the student is demonstrating adequate response to the intervention. Moreover, we note that a lower slope does not equate to lowered expectations. Rather, it represents setting the student up for success by determining whether the intervention is aligned with and meeting student needs. Once an expected slope or rate of improvement is selected, the goal can be calculated by adding the baseline to the product of the weeks times the rate of improvement (i.e., Goal = Baseline + [Weeks × Rate of Improvement]).
Step 5: Graph and analyze the data
There are several options that may be considered for analyzing the gathered data. Data may be analyzed using a graph in which the y-axis represents the scale of the measure (e.g., CWS), while the x-axis represents the weeks of the intervention or assessment administrations. The scale will be important as the tools are quite variable for the different scoring methods selected. To create a goal slope, draw a line between the point representing the median of the baseline data points and the calculated goal point. Then, plot each data point based on the selected frequency of assessment administration to represent the student’s observed slope. Figure 2 provides an example graph using CWS.
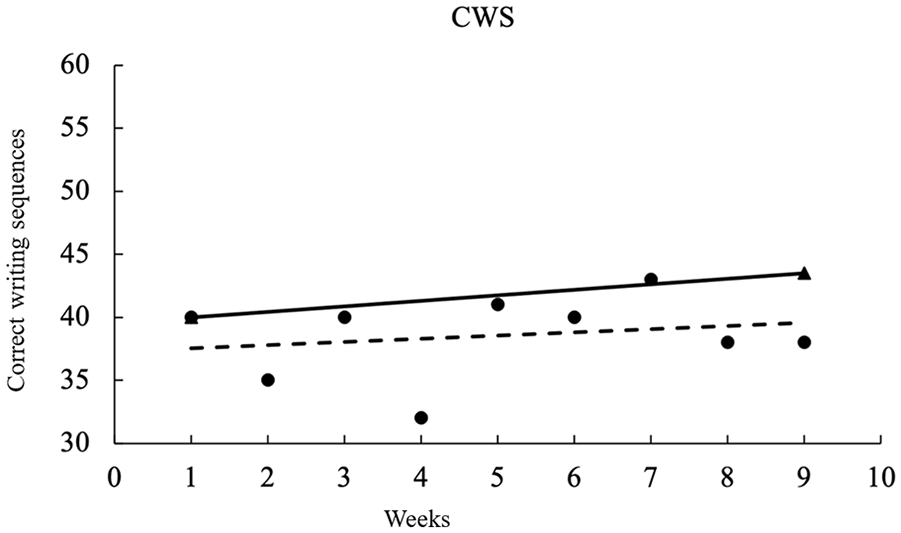
Katya’s Progress-Monitoring Graph.
Now the student’s goal and observed slopes can be compared to determine whether the student has made adequate progress. Using the slope method, if the student’s observed slope is level with or steeper than their goal slope, they are making adequate response to the intervention. If the slope is less steep or trending in the opposite direction, then the student is not responding adequately to the intervention in place, and the intervention will need to be intensified (Bruhn et al., 2018).
Although less rigorous than the slope method, an alternative method is the points below method (Ardoin et al., 2013). This may be useful because it is easier, more time effective, and students can monitor their own progress. Specifically, this method allows teachers (or students) to observe the final three data points. If these data are below the goal line, the student is not demonstrating adequate progress. If the points are above or above and below the goal line, the student is demonstrating adequate progress.
Tips for implementation success
We recommend involving the student in the data collection and evaluation process to the greatest extent possible. Involving the student in the progress-monitoring process can give students ownership over their data and a sense of control over decisions, which is particularly important for students with EBD. It also presents a valuable opportunity for students to learn practical skills related to graph knowledge and data analysis. Again, the approach to student involvement will depend on the student. It will be important to make sure students understand that they may not meet their goal but that is part of the process. If involving the student in evaluating their progress, we recommend emphasizing that the decision making is to determine whether instruction is meeting their needs rather than whether they are making adequate progress. To learn more about instructional programs for self-monitoring that may be used for these purposes, we refer teachers to a recent practitioner article by Didion and Toste (2022).
Ms. Medved set a goal based on Vasya’s median baseline score of 40 CWS. She chose a rate of improvement of .39 CWS since Vasya was in a later elementary school grade. Although she knew that girls may have a higher rate of improvement than the reported norm, she also considered Vasya’s frustration with the writing process when deciding on this goal. Next, Ms. Medved considered the length of time she would track progress before making a decision based on the gathered data. Considering Vasya’s disability category, Ms. Medved decided to gather data over a longer timeframe to allow for a more stable trend to be identified. For this reason, she decided to gather data over 9 weeks prior to deciding whether Vasya responded adequately to the intervention. With these in mind, she was ready to set a goal. She multiplied the weeks (9) by the rate of improvement (.39). She then added the product (3.51) to the baseline (40) to come up with a goal of 43.51 CWS.
Now that Ms. Medved had calculated the goal, she was ready to create a graph on which she would gather data over the next 9 weeks. She set up the graph so that the y-axis represented the CWS, and the x-axis represented the number of weeks. She then plotted the baseline data point and goal data point. She drew a line between these two points to represent the expected rate of improvement. With the graph ready, she administered a writing CBM once per week. Ms. Medved decided that she would administer the assessment with Vasya first thing on Wednesday mornings because this was the day when Vasya had music for her special period and is typically in a receptive mood during this time. Ms. Medved plotted each data point as she gathered it using pen and paper so that she could plot the data quickly immediately after administration.
When 9 weeks passed, she drew a line of best fit through the data. If she was unable to do so based on the variability of the data, she had a backup plan to use computer software to create a line of best fit for her. However, based on her data analysis, it was very evident that Vasya was not making the expected progress. Vasya’s observed slope was much less steep than the goal slope, indicating that Vasya was not making the progress needed for the intervention to be deemed effective for her (see Figure 2). She knew that the intervention needed to be intensified, but she was unsure what else she could do to support Vasya.
Intervention Intensification
If student response to an intervention is determined to be inadequate and the student requires a more intensive intervention to make the expected growth, more data are needed to determine how to intensify the intervention. For this purpose, diagnostic data must be gathered.
Step 6: Review and gather diagnostic data
Diagnostic data are data that may be used to determine why a student is encountering a specific challenge. For students with EBD, patterns of behavior will be particularly important to determine if there is a specific reason for the student’s performance. The tracking of student process (i.e., students’ behaviors during the writing task or length of the writing task) and product (i.e., length and quality of the writing produced) will provide valuable insight into specific behavioral challenges a student encounters in the writing process (Taft & Mason, 2011).
Student tracking of their own behaviors (e.g., with a strategy checklist derived from the intervention—such as self-monitoring; Ryan et al., 2008) also may provide useful information for why a student has writing challenges. Using the data already gathered, teachers can look for patterns in student behaviors related to writing (Bruhn et al., 2018). For example, data (e.g., time on task and intervention session-specific notes; see Figure 1) may show a student spends more time on task when they are provided with contingency reinforcers in sessions that use non-preferred texts (Kern & Wehby, 2014). Based on these data, providing contingency reinforcers in each session may prevent some of the challenges observed in sessions wherein the student refuses to engage in the task (Ryan et al., 2008).
At this point, additional diagnostic data also may be necessary. For students who struggle with word writing and spelling accuracy, a spelling inventory may be used to determine specific errors a student encounters that may be targeted instructionally (e.g., long-e vowel patterns). For students who struggle with sentence writing or paragraph writing, a checklist may be used across samples that evaluates presence and quality of sentence (e.g., punctuation, contains noun and verb, presented in logical order) or paragraph features (e.g., topic sentence, three details, details support topic sentence, logical order to sentences). Make sure to include writing samples across a variety of contexts and settings to obtain the most accurate information. When reviewing data, calculate within these categories across writing samples to determine strengths and needs. Table 3 provides additional resources teachers can use during each step of the DBDM/DBI process in writing for students with intensive writing needs.
Resources for Additional Learning on Implementing Data-Based Decision Making/Data-Based Individualization in Writing.
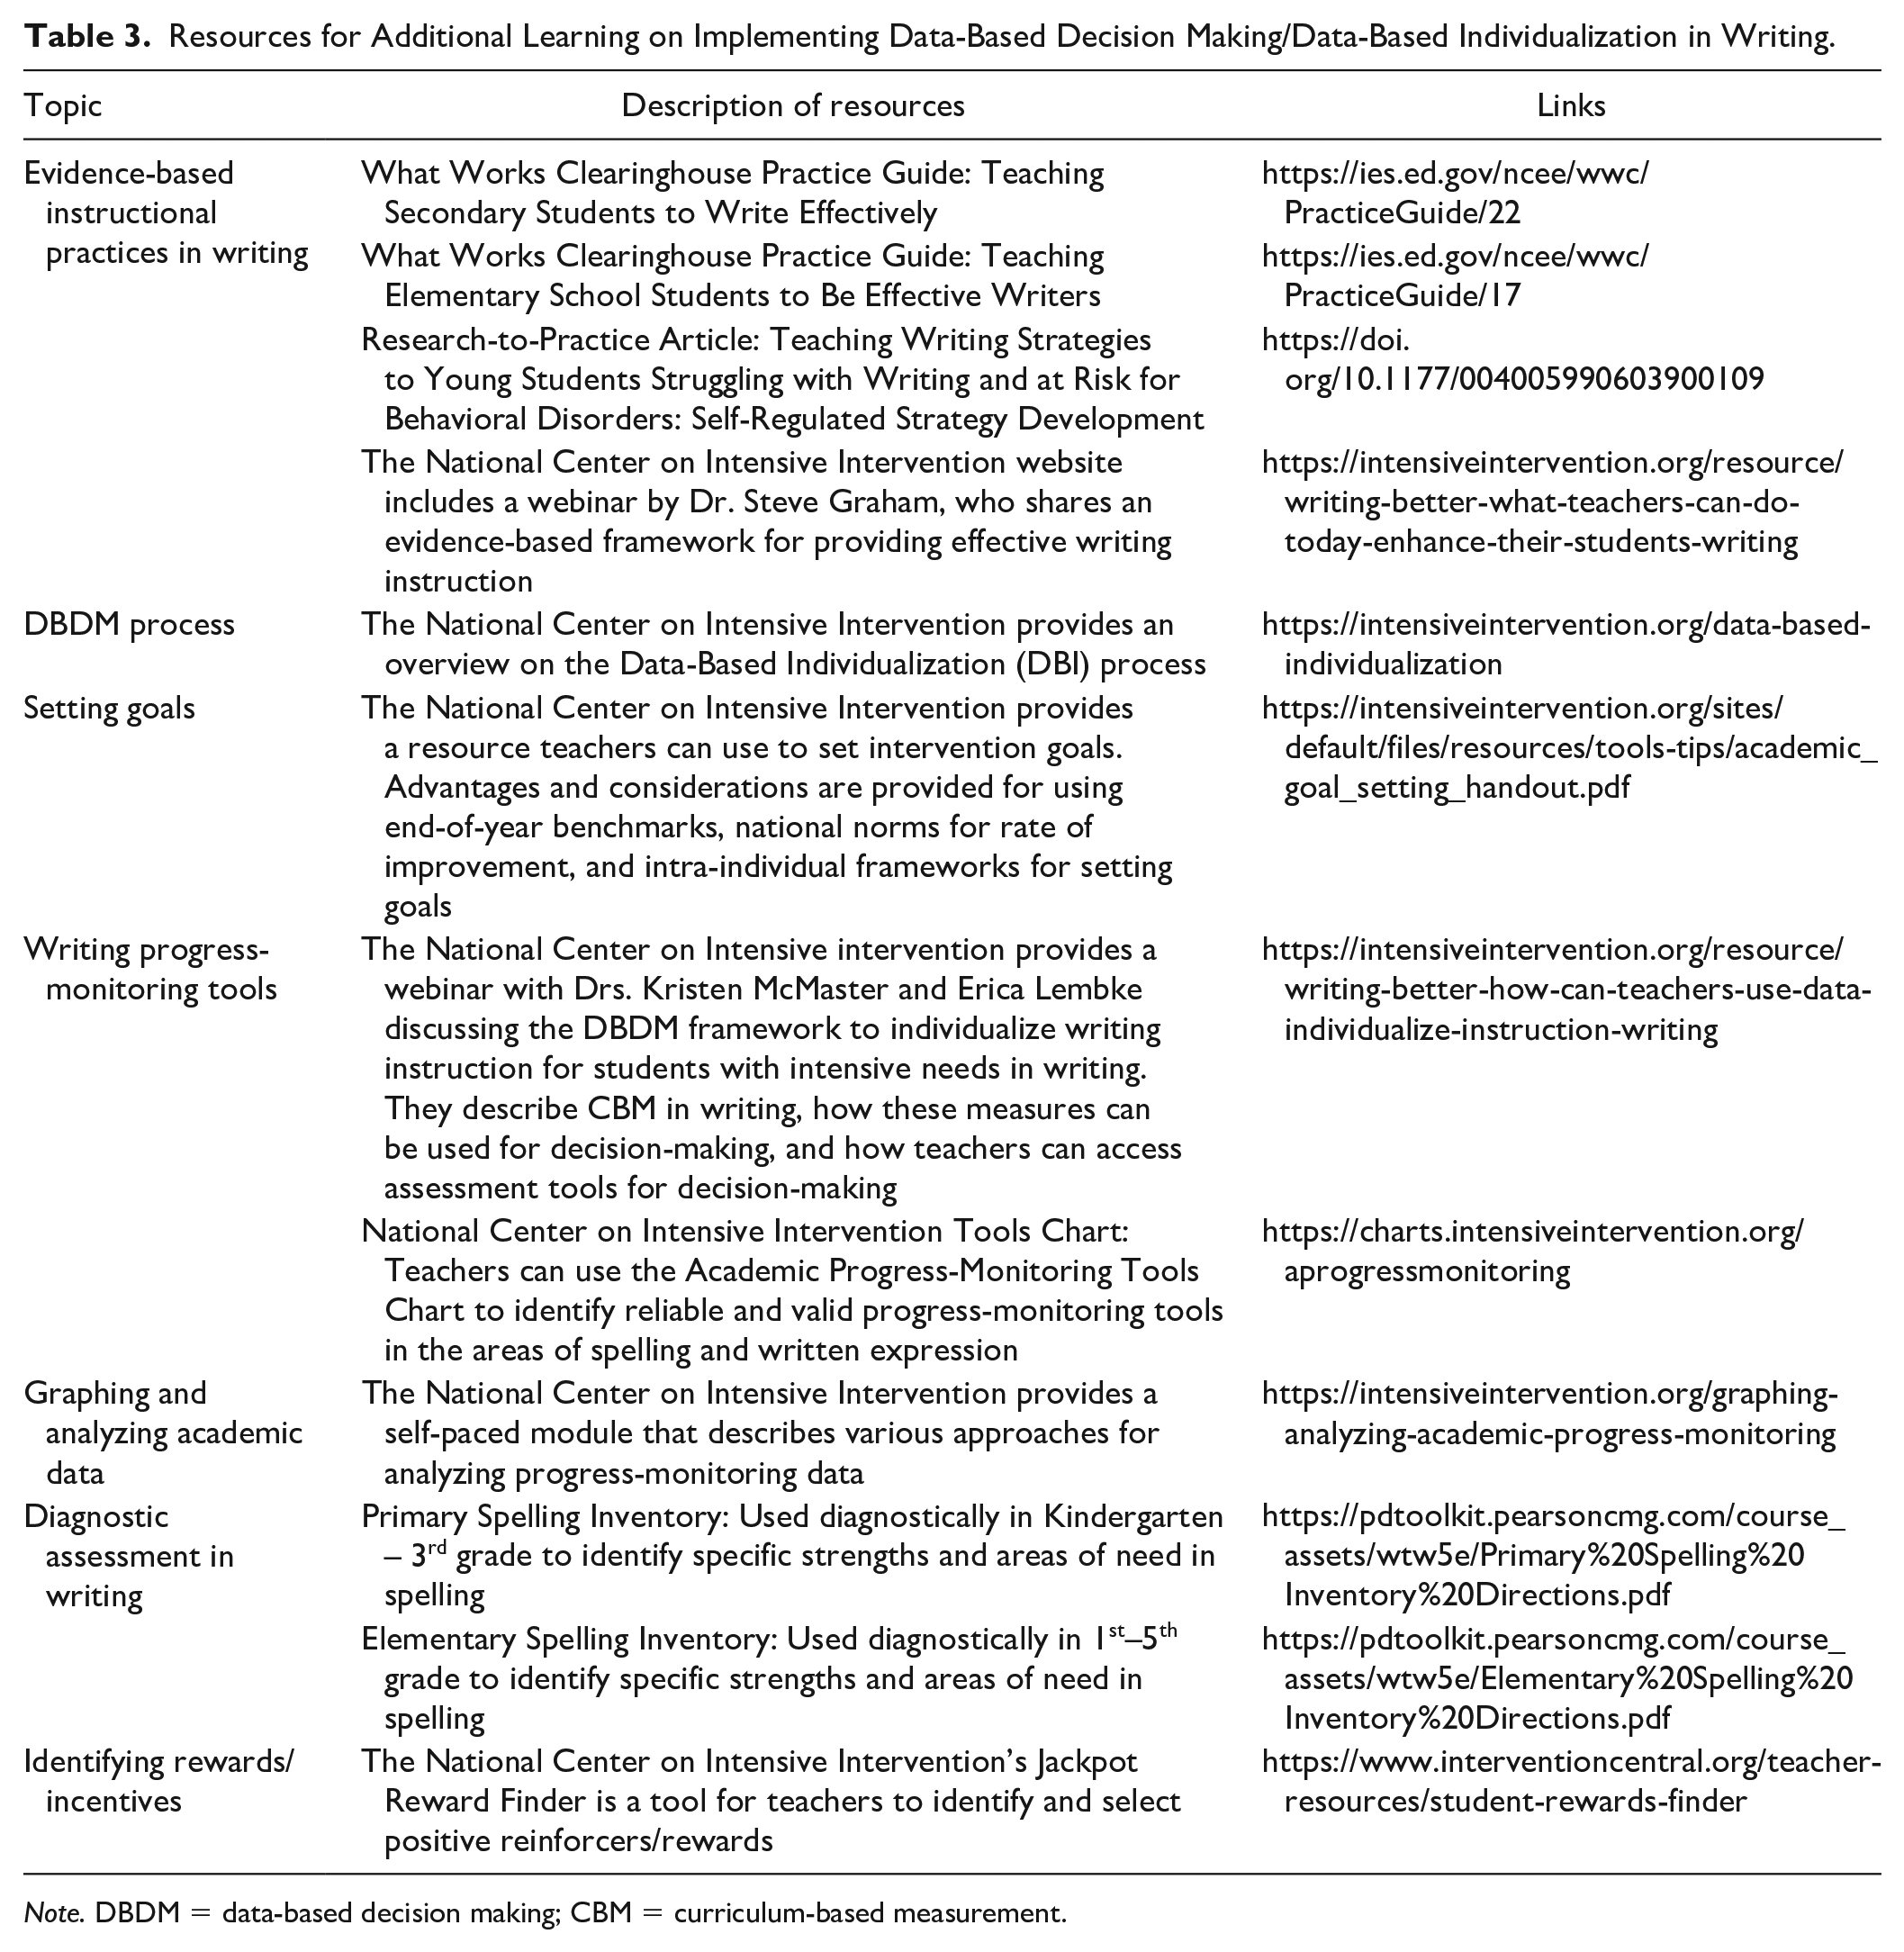
Note. DBDM = data-based decision making; CBM = curriculum-based measurement.
Tips for intensification success
Valuing the student’s experience with writing and making sure the student feels heard along the way will help determine ways to provide support. The student may be able to identify areas in which they perceive they require additional support. At this point, it will be important to triangulate the student’s identified need with their needs according to the gathered data. The intervention can then be intensified based on these needs. For procedures on intervention-intensification decisions, we refer readers to an article by Fuchs et al. (2017). We recommend having another conference with the student to discuss their perceived strengths and needs and to reset the intervention and progress-monitoring plan, much like in the initial progress-monitoring phase. This will ensure the student knows what to expect moving forward.
Ms. Medved reviewed the data gathered across the SRSD intervention. Based on her own observations of process and product, she noted that Vasya’s time on task was increasing over time across the intervention. Despite this growth, Vasya was not making the progress needed to demonstrate adequate response to the intervention. Ms. Medved gathered writing samples from Vasya’s content-area teachers and evaluated her paragraphs using a checklist. Based on the checklist, she noted that Vasya was strong in writing details related to a topic sentence, but that they were not presented in logical order and the topic sentence did not present a main idea for the paragraph. She intensified the intervention by increasing the alignment of the intervention (e.g., she chose a new strategy within SRSD that focused on producing main idea statements). She again tracked Vasya’s progress to determine whether this change would be enough or whether Vasya would need additional intensifications to support her needs.
Putting It All Together
Students with EBD face unique challenges in the writing process and require specific methods for monitoring progress according to these challenges. We recognize the challenges associated with gathering and using data as proposed in research. We encourage teachers to be creative in their data gathering and evaluation to support their ability to make decisions efficiently. For example, keep a folder for each group that includes their probes and graphs so that information and data can be easily accessed. Have students graph their own progress and conduct evaluations of their own or their peers’ writing samples. Provide general education teachers with the process and product checklist so that data may be obtained across a variety of contexts where appropriate. In addition, we encourage teachers to take advantage of the resources at their disposal cultivated by organizations such as the Council for Exceptional Children and the NCII. With the problem-solving abilities of teachers and access to resources available to support teachers, students with and at risk of EBD can make the progress needed to support their needs.
Footnotes
Declaration of Conflicting Interests
The author(s) declared no potential conflicts of interest with respect to the research, authorship, and/or publication of this article.
Funding
The author(s) received no financial support for the research, authorship, and/or publication of this article.