
Abstract
Objectives
To characterize the rs1042034 allele distribution in Vietnamese adults with untreated hypercholesterolemia and evaluate its impact on baseline lipid profiles and the early lipid-lowering response to rosuvastatin 20 mg.
Materials and Methods
In this cross-sectional exploratory study, 79 adults with low-density lipoprotein cholesterol [LDL-C] ≥ 3.4 mmol/L were enrolled and treated with rosuvastatin 20 mg plus lifestyle advice for 3 months. Genotypes were determined by TaqMan real-time PCR with Sanger sequencing validation. Baseline and 3-month lipid panels (LDL-C, high-density lipoprotein cholesterol [HDL-C], total cholesterol, non-HDL-C, triglycerides) were measured. Between-group comparisons used Kruskal–Wallis/ANOVA as appropriate; analysis of covariance (ANCOVA) models adjusted for baseline values assessed genotype (TT vs. CT + CC) effects on posttreatment lipids. Multivariable linear regression examined age, sex, and body-mass index as predictors; false discovery rate correction was applied.
Results
Baseline lipid concentrations did not differ significantly by genotype (overall LDL-C 4.37 ± 0.62 mmol/L; total cholesterol 6.62 ± 0.77 mmol/L). After three months, LDL-C reductions differed markedly by genotype (P < .001): median absolute reductions were −0.47 mmol/L (TT; fractional −9.7%), −1.12 mmol/L (CT; −28.1%) and −1.28 mmol/L (CC; −29.8%). HDL-C change also differed (P = .049) with medians 0.09, 0.24 and 0.15 mmol/L for TT, CT and CC, respectively. ANCOVA (adjusting for baseline) showed the TT genotype was independently associated with higher posttreatment LDL-C (β = 0.758; P = .001), lower posttreatment HDL-C (β = −0.121; P = .004), and higher TC (β = 0.482; P = .026) and non-HDL-C (β = 0.566; P = .007); TG was not affected (P = .751).
Conclusions
This study provides preliminary evidence that APOB rs1042034 polymorphism significantly influences rosuvastatin efficacy in Vietnamese patients with hypercholesterolemia.
Introduction
Dyslipidemia is among the most prevalent and impactful risk factors and occupies a central role in the pathogenesis of atherosclerotic cardiovascular disease—the leading cause of death, with more than 4.51 million fatalities recorded in 2020.1,2 To control this condition, statins have become the cornerstone therapy owing to their ability to lower low-density lipoprotein cholesterol (LDL-C) and reduce the risk of cardiovascular events. 3
Despite notable advances in lipid-lowering therapy, a study of 1413 patients with acute myocardial infarction showed that only 13.2% achieved the LDL-C target of <55 mg/dL during hospitalization, 4 highlighting the persistent challenge of cholesterol control in high-risk patients. One of the principal reasons is interindividual variability in statin response, largely rooted in genetic factors—particularly gene polymorphisms—which can directly affect drug efficacy and the likelihood of reaching therapeutic goals. In this context, numerous studies have demonstrated a strong association between single-nucleotide polymorphisms (SNPs) in the APOB gene and variations in lipid levels, cardiovascular risk, and responsiveness to lipid-lowering therapy.5–8
The APOB gene encodes apolipoprotein B—an essential structural component of LDL that plays a pivotal role in lipid metabolism. 9 Loss-of-function mutations in ApoB can lead to familial hypercholesterolemia, polygenic hypercholesterolemia when combined with other mutations, and interactions with additional risk factors. The rs1042034 polymorphism (also known as c.13013G > A) in the APOB gene has been reported to be associated with alterations in blood lipid concentrations and cardiovascular disease risk. A study in the Maonan and Han populations of China found that carriers of the A allele had higher triglyceride levels and lower high-density lipoprotein cholesterol (HDL-C) levels compared to noncarriers. 10 In another study, compared with the GG or AA genotype, individuals with the GA genotype and the combined GA + AA group for rs1042034 had a 1.67-fold and 1.63-fold higher risk of dyslipidemia, respectively. 11
In Vietnam, the estimated prevalence of dyslipidemia reaches 30.2%, yet only about 22.1% of affected individuals receive treatment. 12 This situation underscores that dyslipidemia remains a “silent enemy” that has not been effectively managed and warrants greater attention. Early identification and control of risk factors—particularly in individuals with unfavorable genetic profiles—constitute a crucial strategy in prevention and treatment. Among genetic determinants, the A allele of rs1042034 in the APOB gene has been consistently reported in multiple international studies to be associated with altered lipid profiles and an increased risk of atherosclerotic cardiovascular disease.10,11,13
The frequency and strength of association of the rs1042034 allele/genotype with dyslipidemia vary substantially across populations,14,15 however, data from Vietnam are virtually absent, partly because genetic testing remains beyond the capacity of most healthcare facilities. Against this backdrop, the present study was conducted to characterize the distribution of the APOB rs1042034 polymorphism in patients with hypercholesterolemia and to assess its impact on lipid parameters and atherosclerotic risk, thereby providing baseline evidence for cost-effective interventions tailored to the national context.
Methods
Study Settings and Participants
This descriptive cross-sectional study was conducted in previously untreated adults with hypercholesterolemia. All study participants were recruited from individuals presenting for medical examination at Bac Lieu General Hospital, one of the major hospitals in the Mekong Delta region. The study was carried out from May 2023 to May 2024.
Subjects were enrolled by convenience sampling. Eligibility criteria required adults (≥18 years) who met the National Cholesterol Education Program Adult Treatment Panel III (NCEP-ATP III) definition of hypercholesterolemia, defined as a fasting serum LDL-C concentration ≥3.4 mmol/L. 16 Exclusion criteria encompassed any conditions known to alter LDL-C levels—diabetes mellitus, hypothyroidism, hyperthyroidism, chronic kidney disease, nephrotic syndrome, cirrhosis, or cholestasis—as well as current use of agents that influence lipid metabolism, including lipid-lowering drugs (statins, fibrates, nicotinic acid, ezetimibe, bile-acid sequestrants), oral contraceptives, antipsychotics, or potent CYP3A4-metabolized medications (eg, ketoconazole, clarithromycin, erythromycin). The process of participant enrollment and exclusion is illustrated in Figure 1.
The study protocol complied with ethical standards for medical research and was approved by the Ethics Committee of Can Tho University of Medicine and Pharmacy (Decision No. 23.276.HV/PCT-HĐĐĐ, April 12, 2023). All participants were fully informed about the study and provided written voluntary consent. The investigation was carried out in accordance with the principles of the Declaration of Helsinki.
Data Collection
The study participants were documented for age, sex, and anthropometric characteristics—height (cm), weight (kg), body-mass index (BMI; kg/m2), and waist circumference (WC; cm)—as well as personal and familial medical histories. Smoking status was dichotomized as “yes” or “no” on the basis of a lifetime consumption of ≥100 cigarettes or cessation for ≥five years. 17 WC was assessed according to the risk thresholds proposed by the World Health Organization in 2006 18 and BMI was classified for obesity using the Asian-specific criteria. 19 Regarding medical history, ischemic heart disease was identified according to the 2024 European Society of Cardiology Guidelines for the management of chronic coronary syndromes, 20 hypertension was defined according to the 2020 International Society of Hypertension Guidelines and diagnosed by a cardiology specialist, and family history of dyslipidemia or coronary artery disease was also recorded. 21 Blood lipid components, including triglycerides (TG), total cholesterol (TC), LDL-C, and HDL-C, were classified according to NCEP-ATP III criteria. 16 Finally, the study evaluated LDL-C control after 3 months of treatment with rosuvastatin 20 mg combined with lifestyle modification, by measuring absolute and percentage changes in LDL-C levels, assessing the proportion of patients achieving therapeutic targets according to the 2021 European Society of Cardiology Guidelines, 22 and identifying factors associated with treatment outcomes.
Genotyping of the APOB rs1042034 polymorphism
Genomic DNA extraction
Peripheral venous blood was obtained from each participant after a minimum 8-h fast. Two milliliters of blood were drawn into tubes containing ethylenediaminetetraacetic acid as anticoagulant. Genomic DNA was isolated from whole blood using the Toppure® Blood DNA Extraction Kit (ABT, Vietnam) strictly following the manufacturer's instructions. DNA concentration and purity were assessed with a NanoDrop spectrophotometer (Denovix, USA). Only samples exhibiting a DNA concentration ≥10 ng/µL and an A260/A280 absorbance ratio between 1.8 and 2.0 were retained for subsequent analyses.
Real-time PCR genotyping
The rs1042034 genotype of the APOB gene was determined by TaqMan-based real-time PCR. Each reaction was prepared in a total volume of 25 µL containing 18 µL DEPC-treated water, 2.5 µL of 10× PCR buffer, 1 µL of an rs1042034-specific primer mix (10 µM), 1 µL of probe rs1042034-P1 labeled with FAM (5 µM), 1 µL of probe rs1042034-P2 labeled with HEX (5 µM), 1.5 µL of genomic DNA template (10 ng/µL), and EZ PCR Mix.
Amplification was performed on a CFX Opus 96 Real-Time PCR System (Bio-Rad) under the following thermal profile: an initial denaturation at 95 °C for 5 min, followed by 35 cycles of 95 °C for 25 s and 59 °C for 45 s, and a final extension at 72 °C for 5 min. Fluorescence was recorded on the FAM and HEX channels, and allelic discrimination was carried out with CFX Maestro v2.3, enabling assignment of the corresponding alleles for each individual sample.
Primers and probes
The primer sequences employed were as follow:
rs1042034-F: 5′-TCTTGAGAAGCTTCCTGAAGC-3′
rs1042034-R: 5′-AACATTAAACAGCTGAAAGAGATG-3′.
The TaqMan probes were designed as follows:
rs1042034-P1: 5′-FAM-TAATCACTGAAGATTGTGTTGATC-BHQ1-3′
rs1042034-P2: 5′-HEX-TAATCATTGAAGATTGTGTTGATCT-BHQ1-3′.
Genotype interpretation
Allelic discrimination was carried out on the basis of fluorescence-threshold detection:
Homozygous C/C (Ser/Ser): only the FAM signal surpassed the threshold.
Homozygous C/T (Ser/Asn): both FAM and HEX signals were detected.
Heterozygous T/T (Asn/Asn): only the HEX signal surpassed the threshold.
Quality control
For each RT-PCR run, negative controls were included to monitor potential contamination, while exogenous positive controls containing the C and T alleles of rs1042034 (APOB) were added to verify amplification performance and ensure compliance with MIQE and ISO 15189:2022 guidelines.
All reactions were repeated to verify consistency, and Sanger sequencing was performed on 15% of the total samples to confirm genotyping accuracy.
Accuracy verification by Sanger sequencing
To ascertain the accuracy of the qPCR-based genotyping, 20% of the initial sample set (18 specimens) were randomly selected for Sanger sequencing.
Genomic DNA was first amplified in a 50 µL PCR mixture containing 38.5 µL DEPC-treated water, 5 µL of 10× PCR buffer, 1.5 µL of the rs1042034-F2/R2 primer mix (10 µM), and 5 µL of template DNA (10 ng/µL). Thermal cycling was performed as follows: 95 °C for 5 min; 35 cycles of 95 °C for 30 s, 55 °C for 30 s, and 72 °C for 45 s; and a final extension at 72 °C for 5 min. Amplicons were evaluated by electrophoresis on 2% agarose gels in 1× TAE buffer at 110 V for 60 min. Samples exhibiting sharp, appropriately sized bands (∼600 bp) were purified with the PCR Purification Kit (Jena Bioscience, Germany).
Purified products were diluted to 10 ng/µL and subjected to cycle sequencing with the BrightDye Terminator v3.1 kit. Each 10 µL reaction comprised 6 µL DEPC water, 2 µL 5× Sequencing Buffer, 0.5 µL single primer (10 µM), 0.5 µL terminator enzyme, and 1 µL template DNA. Cycling conditions were: 96 °C for 3 min; 25 cycles of 96 °C for 10 s, 50 °C for 5 s, and 60 °C for 4 min; followed by a 4 °C hold.
Sequencing products were purified with the Dye Sequencing Clean-up Kit (MCLab, USA), denatured at 95 °C for 2 min, snap-chilled on ice for 5 min, and analyzed on an ABI 3130/3130XL Genetic Analyzer (Applied Biosystems, USA) equipped with 50 cm capillaries and POP-7 polymer. Chromatograms were interpreted with Chromas software to assign APOB rs1042034 genotypes.
Data and Statistical Analyses
All statistical analyses were conducted using R software version 4.3.0 (R Foundation for Statistical Computing, Vienna, Austria).
Continuous variables were summarized as mean ± standard deviation (SD), while categorical variables were presented as counts and percentages. The Shapiro–Wilk test was used to assess normal distribution. Baseline comparisons across genotype groups (TT, CT, CC) were performed using one-way ANOVA for continuous variables and Chi-square or Fisher's exact tests for categorical variables. To evaluate the impact of genotype on changes in lipid parameters after treatment, analysis of covariance (ANCOVA) was applied. The outcome variables included posttreatment levels of LDL-C, HDL-C, total cholesterol, triglycerides, and non-HDL-C. In each model, the genotype (TT vs. CT + CC) was used as the main predictor, and the corresponding baseline lipid value was included as a covariate to adjust for baseline differences. Regression coefficients (β), standard errors (SE), t-values, and P-values were reported.
To illustrate the distribution of lipid changes across genotype groups, we constructed boxplots using base R plotting functions and the RColorBrewer package for professional color schemes. For each lipid parameter (LDL-C, HDL-C, non-HDL-C, triglycerides, and total cholesterol), boxplots were generated to show the absolute and percentage changes after treatment, stratified by genotype (TT, TC, CC). Median values were indicated with solid red dots and annotated numerically in blue. Overlaid stripcharts were used to display individual data points, and a horizontal dashed line at zero denoted no change. Additionally, P-values from the Kruskal–Wallis test were calculated using kruskal.test() and directly embedded within each plot to highlight statistical significance. This approach provided a clear and intuitive visual comparison of lipid-lowering responses between genotype groups. The ANCOVA models were implemented using the lm() function in the base R package stats, and the tidy results were formatted using the broom and dplyr libraries.
In addition, multiple linear regression models were used to assess the effects of age, sex, and BMI on the changes in lipid levels (ΔLDLc and ΔHDLc). To account for multiple comparisons, Benjamini–Hochberg false discovery rate (FDR) correction was applied using the p.adjust() function in R. All statistical tests were two-tailed, and a P-value < .05 was considered statistically significant.
Results
A total of 79 subjects were recruited and followed until the end of the study. There were no significant differences among genotypes in most baseline characteristics (P > .05), except for BMI, which was significantly higher in the TT genotype group compared to the other two genotypes (26.27 ± 2.7 vs. 24.54 ± 2.33 and 24.49 ± 2.3; P = .029). The detailed information is presented in Table 1.
Baseline Characteristics of 79 Participants Stratified by Genotype Group (n = 79).
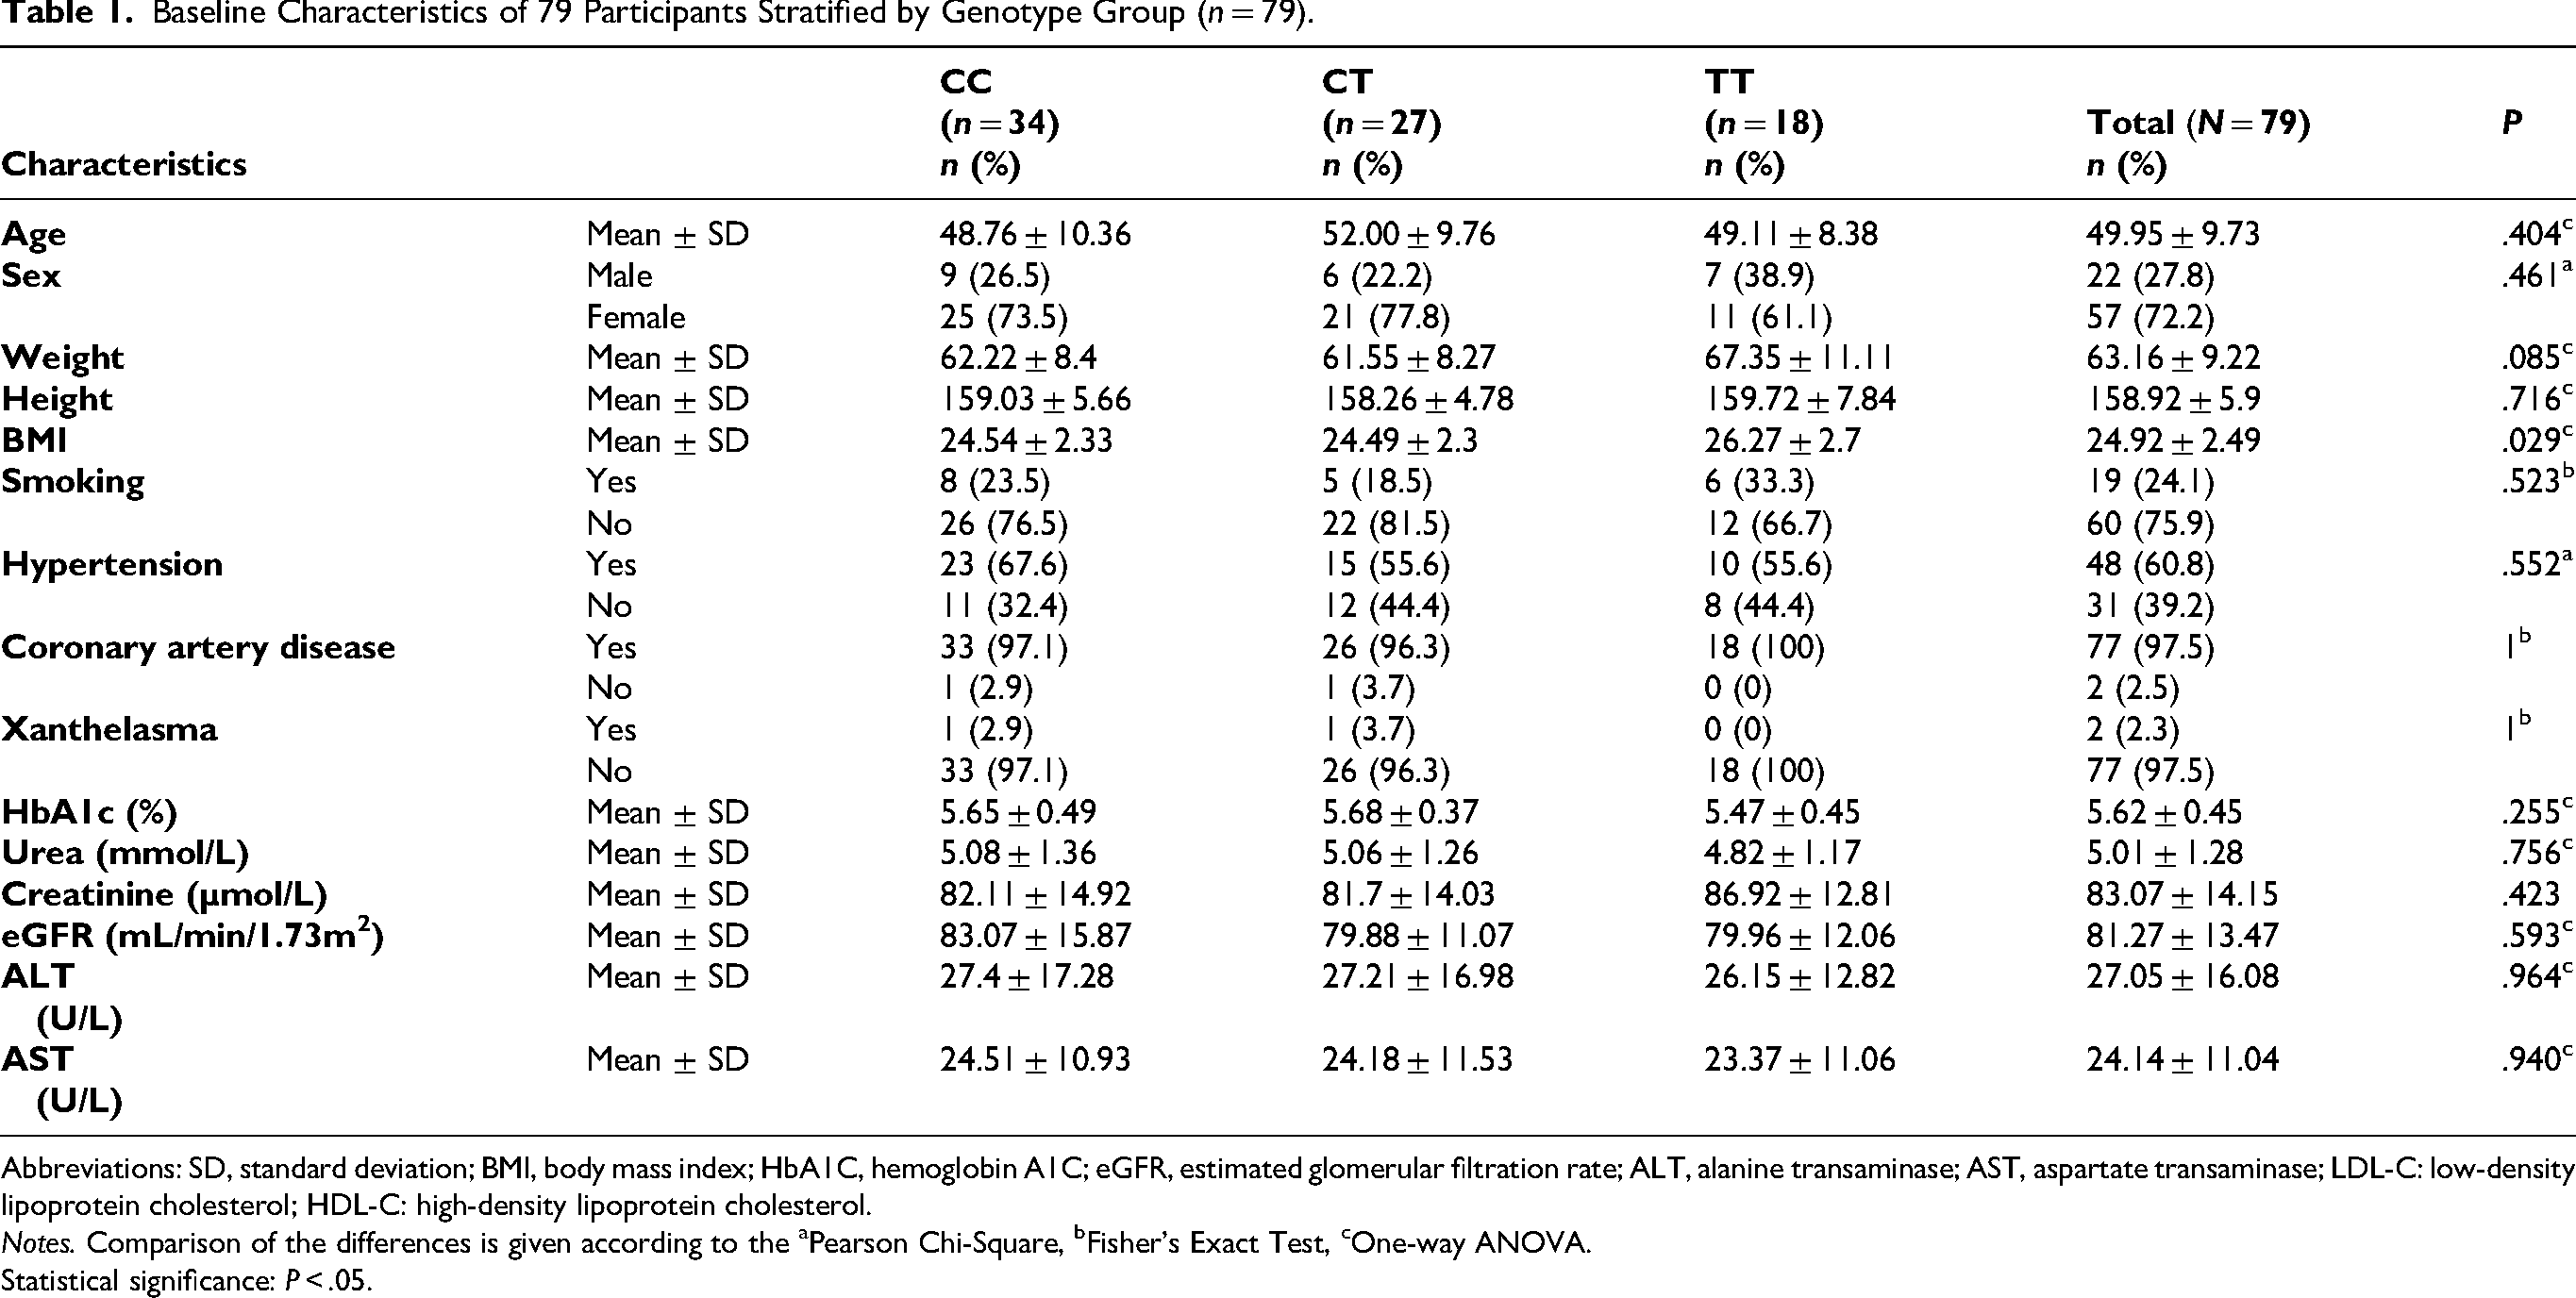
Abbreviations: SD, standard deviation; BMI, body mass index; HbA1C, hemoglobin A1C; eGFR, estimated glomerular filtration rate; ALT, alanine transaminase; AST, aspartate transaminase; LDL-C: low-density lipoprotein cholesterol; HDL-C: high-density lipoprotein cholesterol.
Notes. Comparison of the differences is given according to the aPearson Chi-Square, bFisher's Exact Test, cOne-way ANOVA.
Statistical significance: P < .05.
Lipid Profile of Participants Stratified by Genotype Group (n = 79).
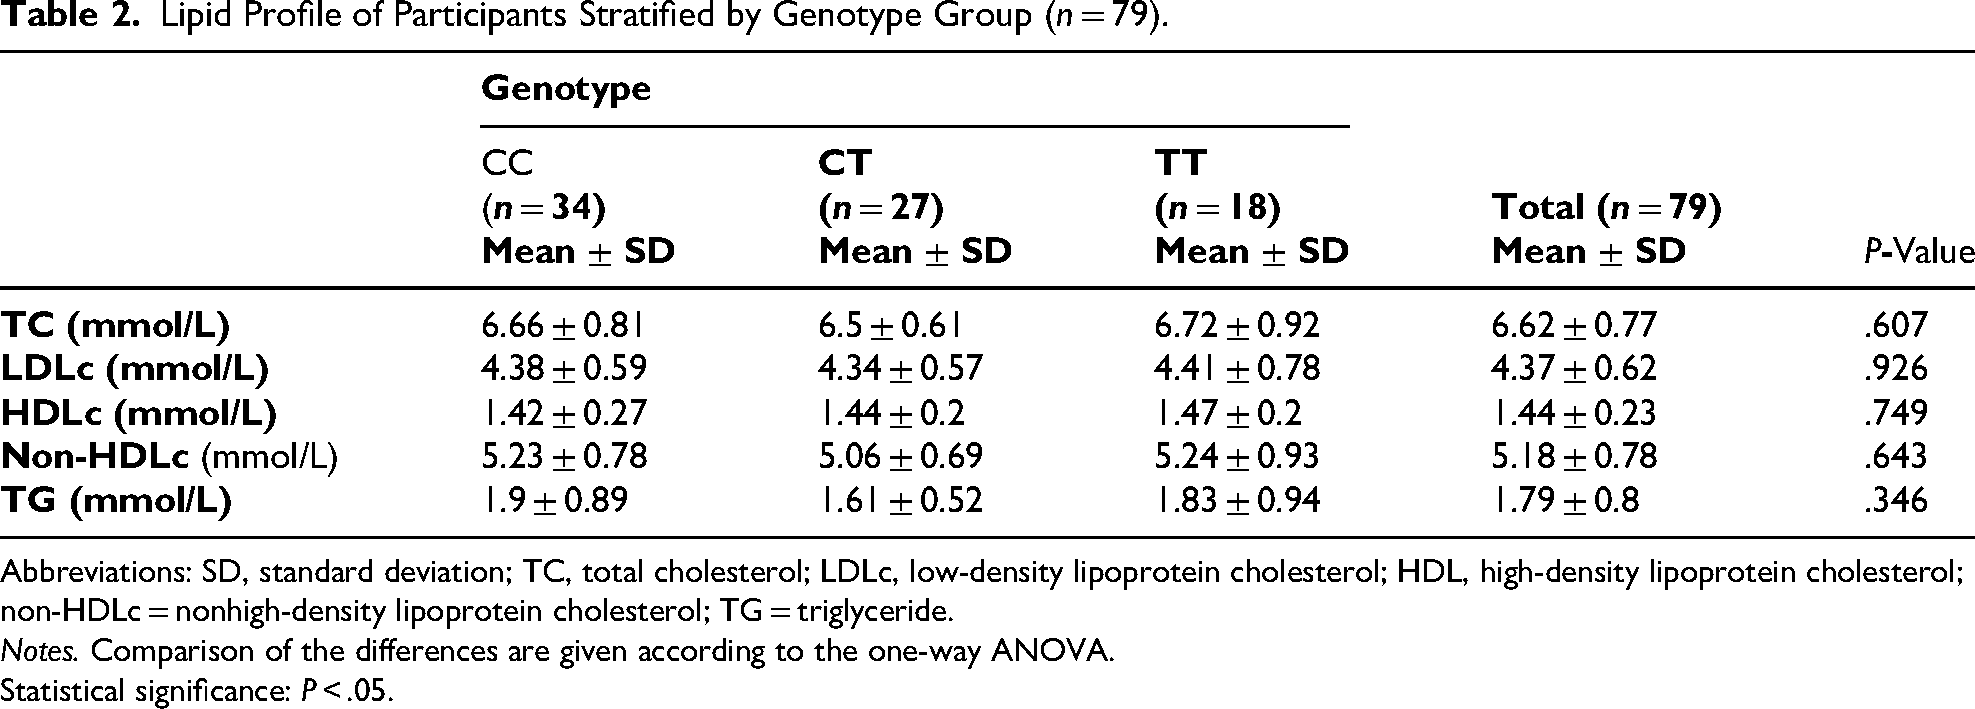
Abbreviations: SD, standard deviation; TC, total cholesterol; LDLc, low-density lipoprotein cholesterol; HDL, high-density lipoprotein cholesterol; non-HDLc = nonhigh-density lipoprotein cholesterol; TG = triglyceride.
Notes. Comparison of the differences are given according to the one-way ANOVA.
Statistical significance: P < .05.
No statistically significant differences were observed in baseline concentrations of TC, LDL-C, HDL-C, non-HDL-C, and TG among the genotype groups (P > .05). Comprehensive data are provided in Table 2. The boxplots show that both absolute and fractional reductions in LDL-C after treatment differ significantly among genotypes (P < .001). The TT group exhibited the smallest median reduction (absolute: −0.47 mmol/L; fractional: −9.71%), whereas the TC (–1.12 mmol/L; −28.14%) and CC (–1.28 mmol/L; −29.75%) groups had greater decreases (Figure 2).

Flowchart of study participant selection.

Boxplots of absolute and percentage changes in LDL-C by genotype. Boxplots illustrate absolute (left) and percentage (right) reductions in LDL-C after treatment, stratified by genotype (TT, TC, CC). Red dots indicate median values, which are also numerically annotated. Horizontal dashed lines at zero represent no change. Individual data points are overlaid as stripcharts. Statistical significance across groups was assessed using the Kruskal–Wallis test; P-values are displayed within each plot.
The boxplots show a statistically significant difference in HDL-C change between genotypes (P = .049), with median changes of 0.09, 0.24, and 0.15 mmol/L for TT, TC, and CC, respectively. Changes in non-HDL-C (P = .53), TG (P = .75), and TC (P = .43) did not differ significantly among genotype groups (Figure 3).

Boxplots of lipid parameter changes (TC, TG, HDL-C, non-HDL-C) by genotype. Boxplots display changes in total cholesterol (TC), triglycerides (TG), HDL-C, and non-HDL-C after treatment, stratified by genotype. Each plot includes group-specific median values (red dots with annotations), individual data points (stripcharts), and reference lines at zero. P-values were derived from the Kruskal–Wallis test and are shown on each panel to indicate statistical comparisons between genotype groups.
Linear regression analysis with FDR adjustment showed that BMI was significantly positively associated with Δ LDL-C (β = 0.1107, FDR-adjusted P = .006). Both age (β = –0.0049, FDR-adjusted P = .006) and BMI (β = –0.0230, FDR-adjusted P = .003) were significantly negatively associated with Δ HDL-C. No significant associations were found for gender. The detailed information is presented in Table 3.
Linear Regression Analysis of the Association Between Demographic Variables and Changes in Levels of LDL-C and HDL-C, With FDR Adjustment.

Abbreviations: LDLc, low-density lipoprotein cholesterol; non-HDLc = nonhigh-density lipoprotein cholesterol; TG = triglyceride; LDL-C: low-density lipoprotein cholesterol; HDL-C: high-density lipoprotein cholesterol; BMI: body mass index.
Notes: Linear regression models were used to examine the effect of age, gender, and BMI on changes in lipid levels (Δ LDL-C and Δ HDL-C).
P-values were adjusted for multiple comparisons using the Benjamini–Hochberg false discovery rate (FDR) method.
The forest plot shows that BMI was significantly positively associated with Δ LDL-C, whereas both age and BMI were significantly negatively associated with Δ HDL-C after FDR correction. Gender was not significantly associated with changes in LDL-C or HDL-C (Figure 4).

Forest plot of predictors for Δ LDLc and Δ HDLc. Forest plot illustrating the associations between age, gender, and BMI with changes in LDL-C and HDL-C after treatment. Regression coefficients (β) and their 95% confidence intervals are shown. Variables with statistically significant associations after false discovery rate (FDR) correction are shown in red.
Analysis of covariance revealed that genotype (TT vs. CT + CC) was significantly associated with posttreatment levels of LDL-C (β = 0.758, P = .001), HDL-C (β = –0.121, P = .004), TC (β = 0.482, P = .026), and non-HDL-C (β = 0.566, P = .007), after adjusting for baseline values. No significant association was observed for TG (P = .751) (Table 4).
Analysis of Covariance Assessing the Effect of Genotype (TT vs. CT + CC) on Posttreatment Changes in Lipid Parameters, Adjusted for Baseline Values.

Abbreviations: LDLc, low-density lipoprotein cholesterol; non-HDLc = nonhigh-density lipoprotein cholesterol
Notes. Regression coefficients (β), standard errors (SE), t-statistics, and P-values are presented.
The models assess the effect of genotype (TT vs. CT + CC) on changes in lipid parameters (LDLc, HDLc, TC, TG, non-HDLc) while adjusting for baseline lipid levels.
Discussion
In this first exploratory study in Vietnam examining the APOB rs1042034 polymorphism, we observed that patients with the TT genotype experienced a markedly attenuated LDL-C reduction after three months of rosuvastatin 20 mg therapy compared to C allele carriers. In practical terms, the TT homozygotes had a smaller percentage drop in LDL-C, suggesting a reduced statin efficacy in lowering LDL-C for this genotype. Additionally, differences were noted in HDL-C responses. The TT group showed a blunted HDL-C increase and in some cases even a slight decrease, whereas CC/CT individuals tended to exhibit the modest HDL-C elevation expected with statin therapy. These patterns, although based on a small single-center sample, hint that the rs1042034 variant may influence lipid-modifying responses to statins in Vietnamese patients with hypercholesterolemia. We emphasize that these findings are preliminary and hypothesis-generating, given the study's limited scope and sample size.
When comparing our lipid profile findings to other populations, it's important to note that the baseline impact of rs1042034 on lipids has also been inconsistent across studies. Some works have associated the variant allele with a generally unfavorable lipid profile—for example, a meta-analysis identified the A allele (complementary to T in our notation) of the APOB rs1042034 polymorphism as a risk allele linked to higher LDL-C and lower HDL-C in various ethnic groups. 23 This aligns with reports from China's ethnic minorities: among the Chinese Yugur population, carriers of the A (T) allele of rs1042034 showed significantly higher odds of hyperlipidemia compared to noncarriers. 11 In American cohorts, the minor allele at rs1042034 corresponds to a glutamine to lysine substitution in ApoB and has been linked to altered cholesterol levels. One study found that this SNP was associated with higher total cholesterol, 24 and the CC genotype homozygous for the common allele was correlated with elevated cholesterol in young patients. 25 Interestingly, the same allele appeared to have an age-dependent effect, acting as a protective factor in older individuals in that population. 25 In contrast, a study in a Chinese Han population reported no significant association between rs1042034 and hyperlipidemia, underscoring potential ethnic or regional differences. 26 It is intriguing that the same biological variant could appear “harmful” in one context and “protective” in another. Potential explanations include differences in genetic background (eg, linkage with other variants in APOB or nearby genes) and gene–environment interactions (diet, lifestyle, comorbidities), or even selection bias in some populations.
Our finding that TT homozygotes showed a smaller LDL-C reduction after rosuvastatin therapy is noteworthy and warrants attention, as rs1042034 has not been specifically evaluated in prior large-scale statin response meta-analyses. The strongest pharmacogenetic evidence to date comes from a GWAS meta-analysis of approximately 41,000 statin-treated individuals, which identified SORT1/CELSR2/PSRC1, SLCO1B1, APOE, and LPA as loci significantly associated with on-treatment LDL-C changes, but did not include rs1042034. 27 In the broader literature, evidence on rs1042034 and statin-induced LDL-C reduction is limited, and data on APOB polymorphisms are scarce. In an Iraqi cohort with coronary artery disease, the rs676210 variant (ApoB Pro2739Leu) was associated with greater LDL-C lowering in AA homozygotes, suggesting that APOB variants may modulate statin response. 28 To our knowledge, no published data have examined the pharmacogenetic effects of rs1042034 in statin-treated cohorts. This polymorphism in the APOB gene, previously known as the EcoRI polymorphism, involves a single nucleotide change that substitutes glutamic acid with lysine at position 4154 of ApoB-100, the principal apolipoprotein of LDL. Located in the protein's carboxyl-terminal region, this residue is outside the LDL receptor-binding domain, as early in vitro studies by Gallagher et al found no significant effect on LDLR binding. 29 Although our study examined rs1042034, data from the closely linked rs1042031—essentially the same functional variant as the historical EcoRI site—show that this substitution enhances LDL catabolism and lowers plasma LDL-C. In a Danish cohort, K4154 K (AA) and E4154 K (GA) genotypes had ∼5% lower apolipoprotein B and LDL-C than E4154E (GG). 30 This effect may involve altered LDL binding to arterial proteoglycans or increased susceptibility to oxidation, as the charge shift from glutamic acid to lysine could modify LDL retention or oxidation without directly affecting LDLR-mediated clearance. 29 On the other hand, a Japanese study on hepatitis C virus infection reported that individuals with the minor allele of rs1042034 had lower LDL-C but higher triglycerides, suggesting that this variant may enhance LDLR-mediated uptake of LDL into hepatocytes, thereby reducing circulating LDL-C. 31 These findings may help explain why, in our study, individuals with the TT genotype (carrying the rs1042034 variant) showed a smaller LDL-C reduction after rosuvastatin therapy than those with the CC genotype. The rs1042034 variant may enhance hepatic LDL clearance, resulting in a higher baseline removal rate of LDL particles. In such individuals, further LDL receptor upregulation by statins yields limited additional benefit, whereas CC genotype carriers—with less efficient baseline clearance—experience a greater LDL-C reduction. This pattern is consistent with evidence that K4154 (allele A) carriers start from a lower LDL set-point due to increased catabolism, thereby attenuating the lipid-lowering effect of statins. For HDL-C, the mechanisms remain unclear, as statins generally exert only modest effects on HDL-C metabolism. In our data, TT genotype patients did not exhibit the slight HDL-C increase seen in C-allele carriers. Whether rs1042034 polymorphism directly affects HDL is uncertain, although some studies have linked its minor allele to lower HDL-C levels in certain populations.10,32 This variant may be in linkage disequilibrium with other HDL-related genes (eg, APOA1/C3/A4 cluster or CETP), or altered LDL catabolism may indirectly influence HDL via changes in cholesterol flux and interlipoprotein transfer. Nonetheless, the HDL-C differences between genotypes in our study should be interpreted cautiously, as absolute changes were small.
This study has several important limitations that temper the interpretation of the results. First, the sample size was small (this was a pilot, single-center study), which greatly limits statistical power. With only a modest number of patients in each genotype subgroup, the study may be underpowered to detect anything but relatively large effects, and there is a heightened risk of type I error for the observed genotype–response association. The results should therefore be viewed as hypothesis-generating rather than confirmatory. In addition, the sampling was a convenience sample of Vietnamese adults with high cholesterol presenting to one hospital. This could introduce selection bias—the cohort may not represent all hypercholesterolemic Vietnamese. Moreover, our study duration was only three months, which is sufficient to assess short-term lipid response, but it does not inform whether the genotype influences long-term statin efficacy or safety. A longer follow-up might reveal whether the smaller LDL reduction in TT individuals persists or narrows over time. Finally, given the exploratory nature and the multiple comparisons inherent in examining several lipid parameters and genotypes, there is a possibility of chance findings. Overall, the existing literature on rs1042034 and statin response is sparse and sometimes conflicting—our study contributes novel data from a Vietnamese perspective, but larger studies in Asian populations are needed to confirm or refute a true gene–statin interaction.
Conclusion
In conclusion, this exploratory study suggests a potential link between the APOB rs1042034 polymorphism and differential lipid responses to rosuvastatin therapy in Vietnamese adults with hypercholesterolemia.
Footnotes
Acknowledgments
We are grateful to express our sincere gratitude to the Rectorate Board of Can Tho University of Medicine and Pharmacy, and Bac Lieu General Hospital for creating favorable conditions for this study to be carried out.
ORCID iDs
Ethical Considerations
This study was approved by the Ethics Committee of Can Tho University of Medicine and Pharmacy, Viet Nam (Approval No. 23.276.HV/PCT-HĐĐĐ) on April 12, 2023. In addition, the research was conducted ethically in accordance with the World Medical Association Declaration of Helsinki.
Consent to Participate
Informed consent was obtained from all individual participants included in the study.
Consent to Publish
Additional informed consent was obtained from all individual participants for whom identifying information is included in this article.
Author Contributions
Conception and design of the study: Chau Thi Kim Doan and Anh Tan To Le; acquisition of data, analysis, and interpretation of data: Chau Thi Kim Doan, Anh Tan To Le, Duy Tran Khanh Nguyen, Phi Cong Pham, and Bao The Nguyen; manuscript preperation: Chau Thi Kim Doan, Anh Tan To Le, Chieu Thi Truong, Loc Duc Ngo, Tran Tran Nguyen, Duy Tran Khanh Nguyen, Tram Thi Bich Vo, Hao Minh Pham, Dung Thanh Nguyen, Tien Ngoc Thuy Pham, and Bao The Nguyen; final approval: all authors reviewed and approved the final version of the manuscript.
Funding
The authors received no financial support for the research, authorship, and/or publication of this article.
Declaration of Conflicting Interests
The authors declared no potential conflicts of interest with respect to the research, authorship, and/or publication of this article.