
Abstract
Introduction:
Both exercise and pre-meal metformin could lower postprandial glucose and lipid profiles.
Aims:
To explore whether pre-meal metformin administration is superior to metformin administration with the meal in reducing postprandial lipid and glucose metabolism, and whether its combination with exercise confer superior benefits in metabolic syndrome patients.
Materials and Methods:
In a randomized crossover design, 15 metabolic syndrome patients were assigned to 6 sequences including 3 experimental conditions: metformin administration with a test meal (met-meal), metformin administration 30 min prior to a test meal (pre-meal-met) with or without an exercise bout designed to expend 700 Kcal at 60% VO2 peak performed the evening just before pre-meal-met condition. Only 13 participants (3 males, 10 females; age: 46 ± 9.86, HbA1c: 6.23 ± 0.36) were included in the final analysis.
Results:
Postprandial triglyceridemia was unaffected by any condition (all P > .05). However, both pre-meal-met (−7.1%, P = .009) and pre-meal-metx (−8.2%, P = .013) significantly reduced total cholesterol AUC with no significant differences between the two latter condition (P = .616). Similarly, LDL-cholesterol levels were significantly lower during both pre-meal-met (−10.1%, P = .013) and pre-meal-metx (−10.7%, P = .021) compared to met-meal with no difference between latter conditions (P = .822). Plasma glucose AUC was significantly reduced by pre-meal-metx compared to both pre-meal-met (−7.5%, P = .045) and met-meal (−8%, P = .03). Insulin AUC was significantly lower during pre-meal-metx compared to met-meal (−36.4%, P = .044).
Conclusions:
Metformin administration 30 minutes prior to meal seems to exert favorable effects on postprandial TC and LDL-Cholesterol levels compared to its administration with meal. Addition of one exercise bout only improved postprandial glycemia and insulinemia.
Trial registry:
Pan African clinical trial registry, Identifier PACTR202203690920424.
Introduction
Type 2 diabetes (T2D) is a multifaceted disease involving multiple cardiovascular risk factors such as obesity and hyperglycemia. Patients with T2D also have two-to-three-fold increased risk for cardiovascular diseases (CVDs). 1 It is, therefore, rational that optimal treatment of T2D should include concurrent management of hyperglycemia and other T2D-associated cardiovascular risk factors. The Action to Control Cardiovascular Risk in Diabetes (ACCORD) trial, showed that intensive glucose control without weight loss did not confer additive benefits and has, in contrast, increased mortality rates in the intensive therapy group as compared to the standard-therapy group. 2 This emphasizes the importance of T2D therapy that combine both weight-reducing effects with optimal glucose lowering effects.
Many antidiabetic agents including metformin, GLP-1 receptor agonists, and Sodium-glucose transport protein 2 inhibitors could, in addition to their antidiabetic effects, confer weight-reducing, antidyslipidemic and antihypertensive effects. 3 -7 This makes them promising agents not only for type 2 diabetes patients, but also for at high risk patients with other metabolic disorders including metabolic syndrome and metabolic (dysfunction) associated fatty liver disease (MAFLD) who may not meet the definition of T2D. 3 -7 Importantly, although many antidiabetic agents have been FDA-approved in the last 20 years, nearly all of these agents are tested against and are prescribed in combination with metformin, making metformin the gold-standard treatment. According to the last consensus report by the American Diabetes Association (ADA) and the European Association for the Study of Diabetes (EASD), metformin is still the first line treatment for managing hyperglycemia in T2D. 8,9 and is currently considered as an essential medicine by the World Health Organization. 10 The drug has also gained momentum outside the spectrum of T2D and has now entered the realms of cancer, aging and CVDs. The UK prospective diabetes study was the first large scale study to report that metformin reduces cardiovascular risk. 11 The cardioprotective effects of metformin were further confirmed by the 10 years follow-up of this same trial; demonstrating that despite its similar glycemic control compared to other conventional glucose lowering agents, metformin was the only agent that had the potential to significantly reduce the risk of myocardial infarction. 12
Several studies showed that metformin’s lipid lowering effects may at least partially contribute to the cardiovascular risk reduction, where it has been estimated that metformin reduces circulating triglycerides (TG) by approximately 10%, 13,14 However, Gormsen et al 15 showed that 3 months of metformin treatment neither reduced postabsorptive TG kinetics nor altered intrahepatic portioning of fatty acids toward oxidation, suggesting that metformin-induced improvements in lipid metabolism are likely to be related to its glucose lowering effects. In contrast, Sato et al 16 reported that metformin may alter postprandial lipid metabolism. Specifically, the authors pointed out that metformin administration 30 min prior to a meal reduced postprandial TG excursions compared to its administration with the meal. 16 This is very interesting since postprandial triglycerdemia was demonstrated to more accurately reflect CVDs than does fasting triglycerdemia 17,18 and may therefore underlie the reduced cardiovascular risk associated with metformin.
Similar to metformin, exercise is also a cornerstone in the prevention and treatment of metabolic and CVDs. 19 Several meta-analyses conclusively showed that both acute and chronic exercise improve glycemic control, fasting and postprandial glucose and lipid metabolism. 20 -22 Given that exercise and metformin share a common molecular target—AMP-activated protein kinase (AMPK)—many researchers investigated whether metformin adds to the benefits of exercise on glucose and lipid metabolism. 23 In this context, some studies reported that the combination of metformin and exercise did not add any effect and may have even attenuated some of the beneficial effects of exercise on glucose metabolism. 24,25 These findings have, however, not been consistent. 26 -28 Erickson et al 28 showed in this regard that the combination of metformin and exercise resulted in the lowest postprandial glycemic excursions. A finding consistent with what was demonstrated by Ortega et al 27 who showed that metformin exercise combination results in lower postprandial glycemic excursion and this may be related to improved insulin sensitivity.
Therefore, the primary aim of this study was to investigate whether the benefits of pre-meal metformin administration on lipid and glucose metabolism could be transposed to subjects with metabolic syndrome (MetS). A secondary aim was to investigate whether the addition of one exercise bout performed the evening prior to pre-meal metformin administration could confer an additive benefit on postprandial and glucose metabolism.
Materials and Methods
Participants
This study was approved by Farhat Hached’s University Hospital Ethics Committee (IRB 00008931) and confirmed with the Declaration for Helsinki. The study was registered in the pan African clinical trial registry as PACTR202203690920424. Subjects were recruited for this study after providing a written informed consent. A total of 15 metformin-naïve MetS patients were recruited for this study 3 men, 10 women (3 premenopausal and 7 post-menopausal women). Eligible participants (Table 1) were physically inactive obese adults (both sexes) that met the MetS definition. 29 Physical inactivity was defined by not engaging in any structured exercise program during the last 3 months.
General Characteristics of the Study Subjects.a
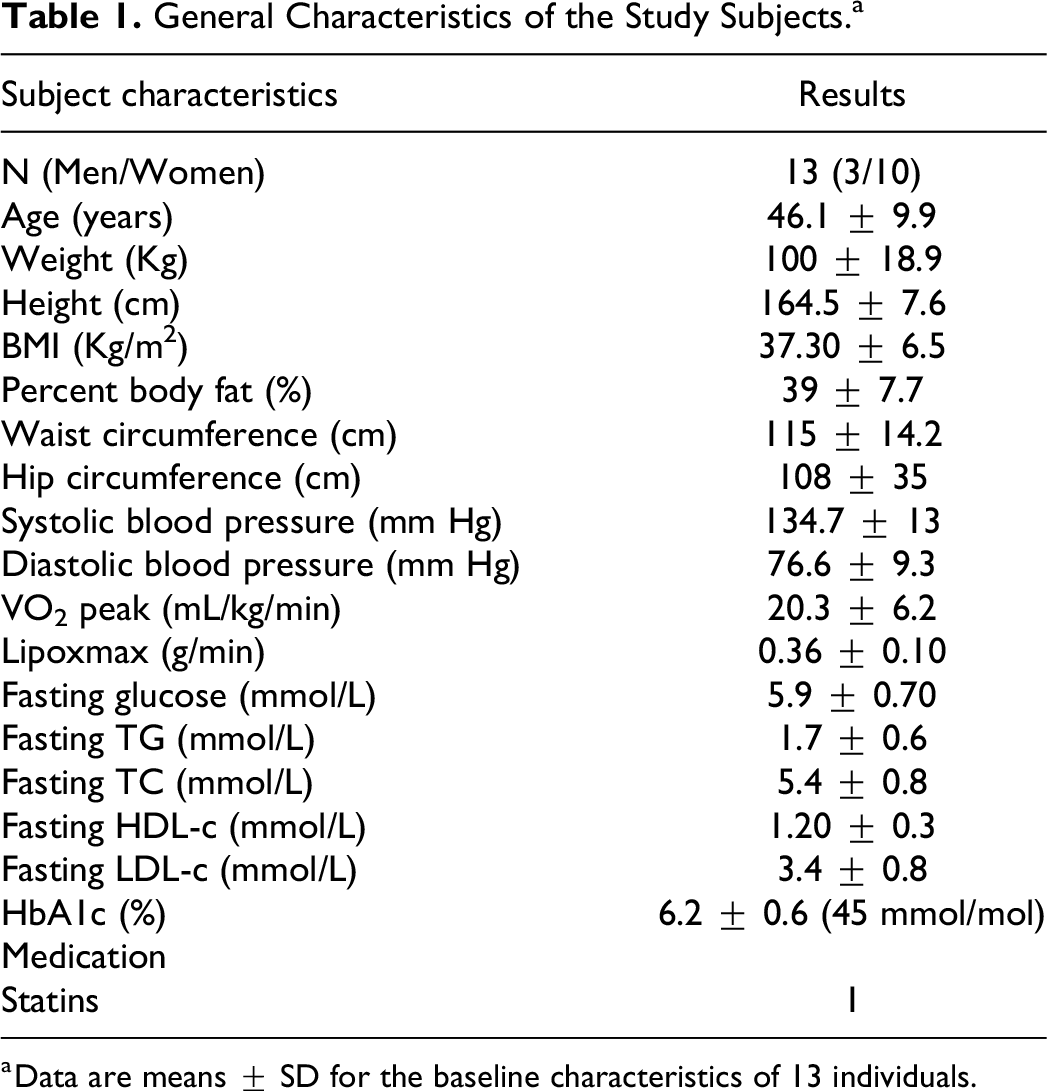
a Data are means ± SD for the baseline characteristics of 13 individuals.
Study Design
In a randomized, open label, crossover design, subjects were randomly assigned to 6 experimental sequences including 3 experimental conditions: ABC, BCA, CAB, BAC, CBA and ACB, where in the first experimental condition (A), metformin was administered with meal (met-meal). In the second condition (B), metformin was taken 30 min before the meal (pre-meal-met). The third experimental condition (C), (pre-meal-metx) was identical to the pre-meal-met condition and differed only by the fact that it was preceded by an acute exercise bout performed the evening preceding the pre-meal-metx condition and was designed to expend 700 Kcal at 60% VO2 peak. A washout period of at least 1 week separated each condition except for pre-menopausal women who were tested in their early follicular phase and thus required to undergo a longer washout period depending on their cycle and the randomization sequence.
Study Protocol
Each subject rendered a total of 5 visits to the laboratory: 2 pre-experimental visits and 3 experimental sessions.
Pre-experimental sessions
Subjects manifesting their preliminary interest were asked to report to the lab after an overnight fast. This first visit was dedicated to explain the study protocol and procedures and to sign the informed consent. From subjects who accepted to participate in the study and signed the informed consent, a fasting blood sample to screen for the different components of MetS was taken. The detailed medical history of the participant and the anthropometric parameters were also collected during this session. The second session was dedicated for the measurement of resting metabolic rate (RMR) and the conduction of a graded exercise test. The outcomes from these latter tests were used to calibrate the exercise session and for the nutrition and metabolic control before each experimental session.
Experimental sessions
Each subject reported to the laboratory between 7:30 and 8:00
Macronutrient Composition of the Standardized Breakfast.

Briefly subjects came to the laboratory between 5:30 and 6:00
Nutritional Control
Two days before each experimental condition, subjects were prescribed a diet that closely matched their total daily energy expenditure. For this end, the RMR was multiplied by an activity factor of 1.4, which characterizes sedentary activities. It was demonstrated that using an appropriate activity factor and resting energy expenditure for the estimation of total daily energy requirements (TDER) is strongly correlated with fully controlled feeding interventions. 30 Dietary intake was designed to match total daily energy expenditure and was maintained constant across the 3 experimental conditions. TDER was divided as follows: 25%, 35% and 40% for breakfast, lunch and dinner. The macronutrient composition of the meals followed the following proportions: 54% carbohydrates, 30% lipids and 16% protein.
Measurements
Graded exercise test
VO2 peak along with the intensity at which maximal lipid oxidation (Lipoxmax) occurred, were determined using a previously published treadmill (870 A Medisoft®, Dinant, Belgique) protocol. 31 Briefly, patients started the test at a speed of 3.5 km/h and a grade of 1%, the speed was increased by 1 km/h every 3 minutes until reaching a speed of 7.5 km/h. Thereafter, the grade was increased by 2% every 3 minutes until reaching an RER of 1. The speed was then increased by 1 km/h every 1 minute until volitional exhaustion. The rationale behind the sharper last increase in treadmill speed is to reach rapidly VO2 peak. Gases were collected breath-by-breath using an open-circuit metabolic card (Ergocard, Medisoft®, Dinant, Belgium). Heart rate and electrocardiographic signal were monitored continuously during the test using Cardioline Click ECG, (Cardioline, Italy).
Resting metabolic rate
The resting metabolic rate was measured using the indirect calorimetry method (Ergocard, Medisoft®, Dinant, Belgium), using standard procedures. 32
Anthropometric measurements
Height and weight
Height was quantified using a stadiometer in a standing position and after a normal expiration, using (SECA 225, Hamburg, Germany) with a precision of 1 mm. Body mass was quantified using an electronic measuring scale (Polar Electro, Kempele, Finland).
Waist and hip circumference
Waist and hip circumferences were measured using a flexible non elastic tape. Waist circumference was taken at the narrowest point of the torso between the lower rib margin and the iliac crest. Hip circumference was assessed as the widest level of the iliac crest.
Body composition
The 4-site skinfold method of Durnin et al 33 was used to assess body composition.
Perceived appetite sensation
Participants were asked to rate their hunger, satiety, satisfaction and prospective food eating, using a 100 mm visual analog scale. 34 Ratings were obtained following the same schedule of blood sampling. Data for these parameters are presented as Area under the curves (AUC).
Indirect calorimetry and calculations
For the graded exercise test, VO2, VCO2 values during the last 2 minutes of each stage were averaged for the determination of non-protein substrate oxidation were used to quantify substrate oxidation. 35
Carbohydrate oxidation: 4.210 VCO2 − 2.9621 VO2
Fat oxidation: 1.695 VO2 − 1.701 VCO2
Blood collection and biochemical measurement
For serum analysis of TG, TC, HDL-C and insulin, blood was collected in plain tubes and left at room temperature for coagulation. Triglycerides were analyzed following the triglycerides-glycerol-3-phosphate oxidase method. TC was analyzed following cholesterol oxidase method. HDL-C was analyzed directly following a colorimetric enzymatic method. LDL-C was derived from the Friedwald formula. 36 For the analysis of plasma glucose, blood was collected in fluoride/oxalate tubes and was analyzed using the hexokinase method. All parameters except for insulin were analyzed on Beckmann Coulter AU-680 biochemistry autoanalyzer AU680 (Beckmann Coulter AU-680, California, USA) immediately after centrifugation. Insulin was analyzed using an electro-chemiluminescence immunoassay for Cobas ® E411. The IMMAGE Immunochemistry System (Beckman Coulter, USA) was used for measurement of HbA1c by the nephelometry method according to Beckman manufacturers.
Sample size calculation
The primary endpoint was postprandial area under the curve for triglycerides. Secondary endpoints included the effect of each intervention on postprandial glucose, TC, LDL-C- HDL-C, insulin perceived appetite sensations and gastrointestinal side effects.
Using Web plot digitizer, 37 data of TG AUC from the study of Sato et al 16 were extracted for sample size calculation. Using G*Power version 3.1.9.2 (University of Kiel), it was estimated that a total sample size of 13 participants would provide 80% statistical power to detect a statistically significant difference between our within-subjects factor (condition), when this interaction amounted to a standardized effect size (Cohen’s d) of 0.86 (α = 0.05) as calculated from the data of Sato et al. 16 Anticipating a 20% dropout, a total sample size of 15 participants was be considered.
Statistical analysis
The normality of residuals was checked by the Shapiro-Wilk test and visual inspection of the distribution. When the assumption of normality was not met the corresponding data was log transformed then retransformed to their natural units for clarity. A 2-way repeated measures ANOVA was performed to analyze time and condition differences in biochemical parameters. One-way repeated measures ANOVA was used to analyze differences in AUC measures. AUC was measured using the trapezoidal rule. All data are presented as mean ± SD. Significance level was set at P < .05.
Results
Participant Characteristics
Participant characteristics are presented in Table 1. Fifteen patients were recruited for this study. Two patients withdrew from the study for personal reasons, therefore only 13 patients were included in the final analysis. Four patients had recent onset T2D and 9 patients were prediabetic. No patient was under glucose lowering agent. Three patients had hypertension and 10 were pre-hypertensive.
Lipemia
For Triglycerides, no significant differences were found in fasting levels. Two-way repeated measures ANOVA revealed only a main effect of time (Figure 1A, P < .001). One way ANOVA showed no significant effects in triglycerides AUC levels (Figure 2A).

Postprandial blood lipid responses. Average postprandial responses for triglycerides (A), total-cholesterol (B), LDL-cholesterol (C), and HDL-cholesterol (D), following metformin administration with the meal (met-meal), metformin administration 30 minutes prior to the meal without (pre-meal-met) or with a 700 Kcal exercise-induced caloric deficit at 60% of VO2 peak performed the evening just before pre-meal-met. Data are mean ± SEM. $, significant main effect of time (P ≤ .05); ‡, significant main effect of condition (P ≤ .05).

Four-hour postprandial area under the curve of triglycerides (A), total cholesterol (B), LDL cholesterol (C), HDL cholesterol (D), following metformin administration with the meal (met-meal), metformin administration 30 minutes prior to the meal without (pre-meal-met) or with a 700 Kcal exercise-induced caloric deficit at 60% of VO2 peak performed the evening just before pre-meal-met. ‡, significant main effect of condition (P ≤ .05).
Fasting TC was similar between met-meal and pre-meal-met (P = .423) and between pre-meal-met and pre-meal-metx (P = .186). However, a tendency for difference was found between met-meal and pre-meal-metx (P = .058). A main effect of time (P = .020) and condition (P = .01) but no condition*time interaction (P = .466) were found for TC as revealed by the two-way ANOVA (Figure 1B). Post hoc analysis revealed that compared to met-meal, TC levels were significantly lower during pre-meal-met (P = .018) and pre-meal-metx (P = .016). Analysis of TC AUC (Figure 2B) revealed a main effect of condition (P = .06). Post hoc analysis revealed that compared to met-meal, TC levels were 7.1% lower during pre-meal-met (P = .009) and 8.2% during pre-meal-metx (P = .013).
Fasting LDL-C was similar across conditions (all P > .05). Two-way repeated measures ANOVA (Figure 1C) revealed a main effect of time (P < .0001) and condition (P = .010) but no condition*time interaction (P = .484). Post-hoc analysis for the condition main effect revealed that compared to met-meal, LDL-C was significantly lower during pre-meal-met (P = .018) and pre-meal-metx (P = .026). Analysis of LDL-C AUC (Figure 2C) revealed a main effect of condition (P = .07). Post hoc analysis of LDL-C AUC revealed that compared to met-meal, TC levels were 10.1% lower during pre-meal-met (P = .013) and 10.7% lower during pre-meal-metx (P = .021).
No significant differences were detected between condition in fasting HDL-C levels. ANOVA revealed only a significant main effect of time for HDL-C (Figure 1D, P = .005). AUC analyses showed no significant effect in HDL-C levels (Figure 2D, P .726).
Plasma glucose
Fasting plasma glucose were not different across conditions (P > .05). Two-way repeated measures ANOVA (Figure 3A) revealed a main effect of time (P < .001), a main effect of condition (P = .008) and a tendency for a time x condition interaction (P = .066). Post hoc analysis of the condition main effect revealed that glucose was significantly lower during pre-meal-metx compared to both pre-meal-met (P = .019) and met-meal (P = .027). These findings were reflected by glucose AUC (Figure 3C) where one-way repeated measures ANOVA revealed a main effect condition (P = .020). Post-hoc analysis of glucose AUC revealed that glucose during pre-meal-metx was 8% and 7.5% lower than met-meal AUC (P = .03) and pre-meal-met AUC (P = .045) respectively.

Postprandial glucose and insulin responses. Average postprandial responses of glucose (A) and Insulin (B), and 4-hour area under the curve of glucose (C) and insulin (D) following metformin administration with the meal (met-meal), metformin administration 30 minutes prior to the meal without (pre-meal-met) or with a 700 Kcal exercise-induced caloric deficit at 60% of VO2 peak performed the evening just before pre-meal-met. Data are mean ± SEM. $, significant main effect of time (P ≤ .05); ‡, significant main effect of condition (P ≤ .05).
Serum insulin
No significant differences were found for fasting insulin. A significant main effect of time (P < .001) and condition (P = .012) but no Condition*Time interaction (P = .347) were revealed by two-way ANOVA for insulin (Figure 3B). Pairwise comparisons of the condition main effect showed that compared to met-meal, insulin was 36% lower during pre-meal-metx (P = .018). Pre-meal-met decreased insulin levels by 22% compared to met-meal, but the difference only tended to be significant (P = .041). One way ANOVA revealed a main effect of condition (P = .047) in insulin AUC (Figure 3D). Post hoc analysis revealed that insulin was 36.4% lower during pre-meal-metx compared to met-meal (P = .044) and ≈ 22% lower during pre-meal-met compared to met-meal with a trend toward significance (P = .073).
Perceived appetite responses
No significant differences were found across conditions in AUC of hunger, satisfaction, satiety, and prospective food consumption (Figure 4A to D, all P > .05).
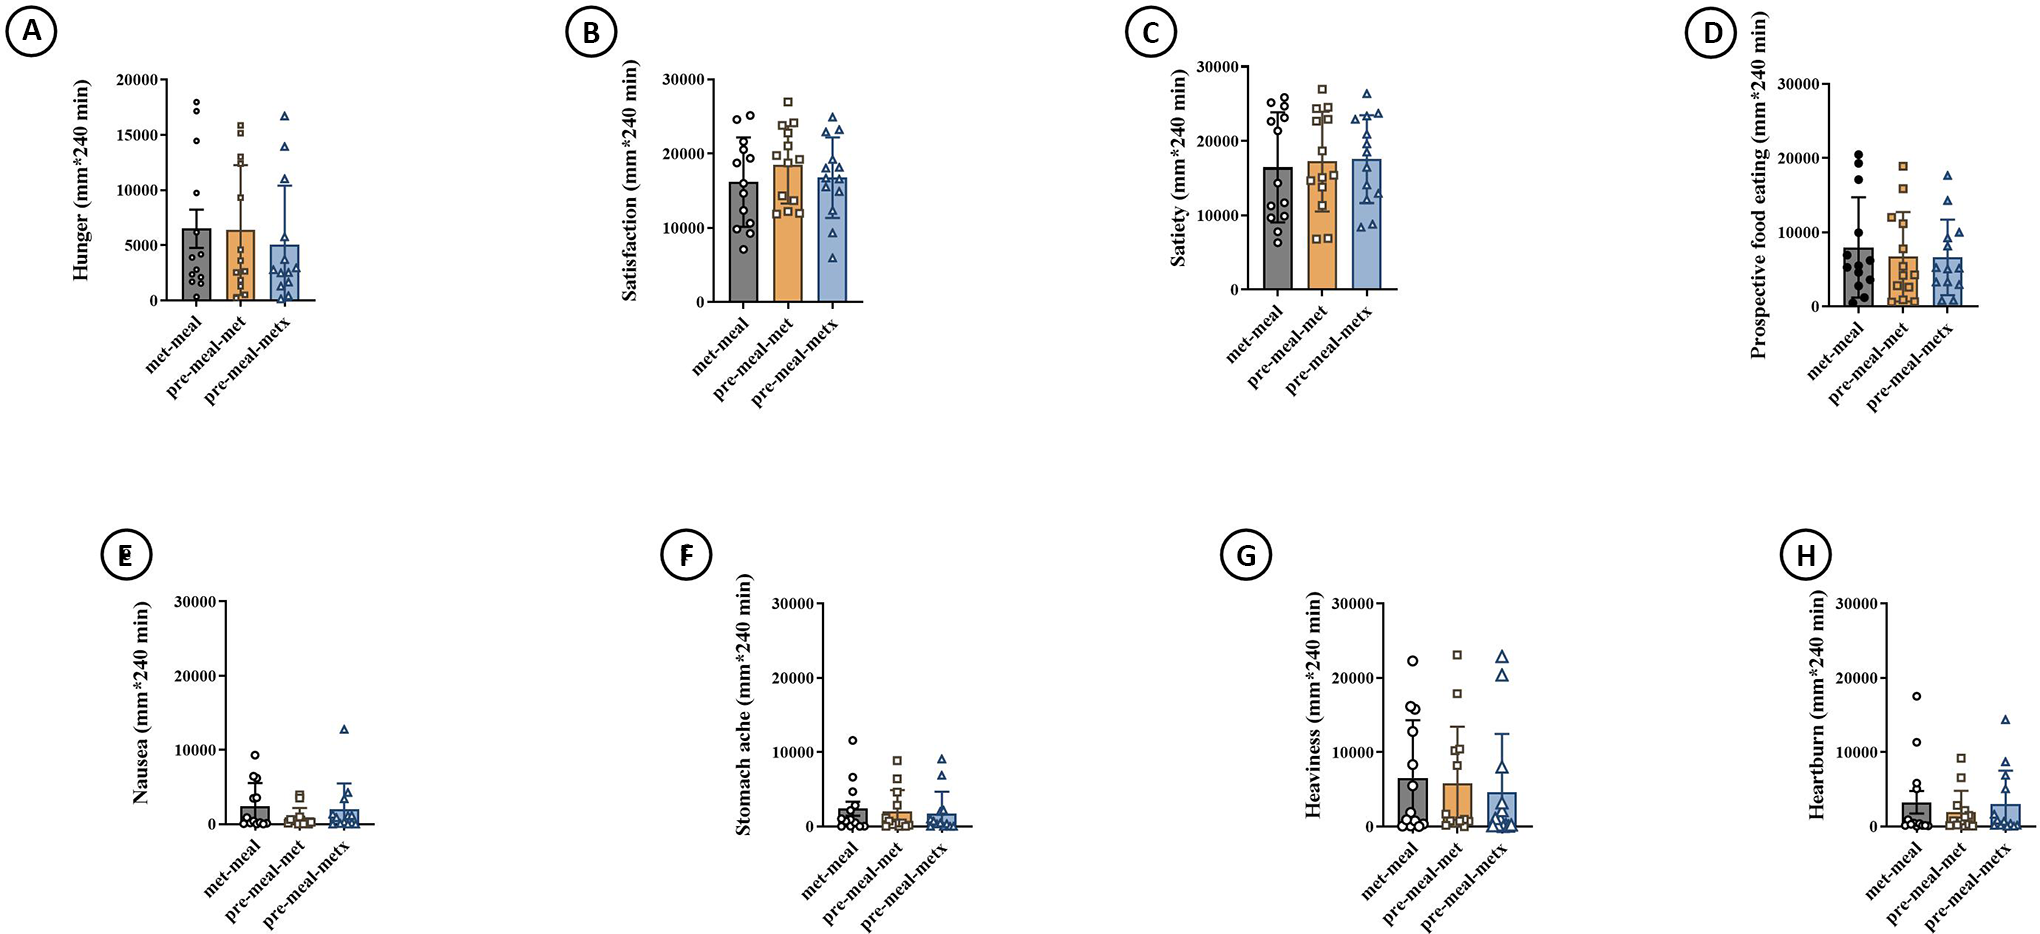
Four-hour area under the curve of subjective appetite hunger (A), satisfaction (B), satiety (C), prospective food consumption (D), and side effects parameters; nausea (E), stomach ache (F), heaviness (G), and heart burn (H) following metformin administration with the meal (met-meal), metformin administration 30 minutes prior to the meal without (pre-meal-met) or with a 700 Kcal exercise-induced caloric deficit at 60% of VO2 peak performed the evening just before pre-meal-met.
Gastrointestinal Side Effects
No significant differences were found across conditions in Nausea stomach ache, heaviness and heart burn (Figure 4E to H, all P > .05).
Discussion
The main findings of this study were that while the postprandial plasma triglycerides following a standardized breakfast meal were not affected by pre-meal metformin administration, TC and LDL-C were slightly affected by administration timing; showing slight decreases when metformin is administered 30 min prior to the meal. Importantly, the addition of exercise did not add to these benefits and resulted in a similar decrease in TC and LDL-C. In contrast to the lipemic parameters, the effect of exercise was most obvious on glucose and insulin responses, with no effect of metformin’s administration timing on these latter parameters in MetS patients.
In contrast to our findings, Sato et al 16 previously showed in T2D individuals that pre-meal metformin administration was superior to metformin administration 30 min after the meal in reducing postprandial triglycerdemia. One potential explanation for these discrepancies may arise from the targeted population. In our study, the included population had a mixture of the different components of MetS whereas in the study of Sato et al 16 subjects were recruited on the basis of high non fasting TG level and the presence of T2D, which may have, at least partly, contributed to the observed discrepancy between our study and that of Sato et al. 16 The test meal employed in this study contained a moderate amount of fat (35.5 g), which is far less to that recommended by an expert panel on fasting and postprandial lipemia (70-80 g of fat). Therefore, this may suggest that such a moderate amount of fat may have not exceeded a certain threshold to observe an effect of pre-meal metformin administration on postprandial lipemia. This also seems unlikely, because the amount of fat in our meal is slightly higher than that utilized in the study of Sato et al 16 (28 g). Moreover, previous studies showed that a moderate amount of fat (30-50 g) is sufficient to dose dependently increase postprandial triglyceridemia and chylomicrons triglycerides levels even in healthy individuals. One advantage behind utilizing a test meal with a moderate lipid amount was to mimic physiological eating patterns where the ingestion of high elevated lipid content in a single meal is less likely to occur.
Finally, one last explanation for these discordances is that subjects in the study of Sato et al 16 were already on metformin and other glucose lowering drugs and there was no control of the timing of the last metformin dose administered the day before initiating experimental sessions. In fact, although the experimental sessions were initiated after only 10-h overnight fast, we cannot fully rule out a possible lasting effect of the last metformin dose. Indeed, a plausible lasting effect of the last metformin could be suggested by the long terminal half-life of metformin, estimated to be around 20 h after the cessation of multiple-dosage regimens. 38 Also, since subjects were already on metformin, we cannot fully attribute the lesser increase in TG to pre-meal metformin administration and thus a possible interfering effect of the chronic metformin utilization could not be excluded. In our study, we anticipated these limitations by including metformin naïve individuals in order to eliminate any potential interactive effect of chronic metformin utilization with timing of metformin administration.
Interestingly, we found that the timing of metformin administration affects TC and LDL-C kinetics. To the best of our knowledge, no other studies have investigated the effect of metformin administration timing on these parameters. The lower postprandial TC and LDL-C found after pre-meal metformin could be related to the inhibition of the apical sodium-dependent bile acid transporter (ASBT), leading to a reduced reuptake of bile acids in the terminal ileum. This may ultimately elicits increased bile acids synthesis from cholesterol and thus reducing blood cholesterol. 39 Whether pre-meal metformin administration differentially affects ASBT bile acid metabolism compared to metformin administration with or after the meal is unknown, thus further mechanistic investigation is needed.
We found that the addition of an acute exercise bout did not further improve postprandial TC and LDL-C beyond pre-meal metformin administration. The fact that previous studies demonstrated that metformin blunts some of the beneficial effects of exercise might suggest that the absence of any additional improvement in LDL-C and TC is consistent with a blunting effect of this combination. The absence of an exercise-placebo condition, a main limitation of this study, prevented any systemic investigation of this possibility. It should be noted, however, that another study reported that MetS may blunt the lowering effects of exercise on postprandial lipemia—an effect that was absent in healthy individuals. 40 Moreover, given that the majority of our subjects had only slightly impaired lipid profiles and that the test meal contained moderate lipid amounts, a flooring effect might also be suggested. Previous studies also pointed to the importance of considering exercise energy expenditure as an important mediating factor for exercise-induced reductions on postprandial lipemia. 22 In our study, exercise was carefully designed to induce a 700-Kcal energy expenditure without any replacement of the energy expended, therefore exercise and metformin combination seems to have no additive effects on postprandial lipemia.
In contrast to postprandial lipemia, exercise effects were obvious on postprandial glycemia and insulinemia; where glucose was significantly lower during pre-meal-metx compared to met-meal and pre-meal-met, whereas insulin was lower in pre-meal-metx compared to met-meal and only a tendency to reduction was observed compared to pre-meal-met. Our findings were in perfect agreement with other studies.
26,28
Erickson et al
28
showed that postprandial exercise could add to the effect of metformin on postprandial glucose excursions in T2D subjects on metformin monotherapy. Similarly, Ortega et al
26
showed that the combination of metformin and intense aerobic exercise resulted in greater reduction in 72-h glucose AUC and glucose peaks as measured by intermittently scanned continuous glucose monitoring and that these findings correlated very well with improved insulin sensitivity as assessed by HOMA-IR. This in contrast to what has been previously shown by Myette-Côté et al
41
where the addition of one exercise bout to metformin treatment resulted in higher postprandial glucose excursions. Similarly, Boule et al
42
showed that exercise and metformin may interfere with each other and result in blunted postprandial glucose decrease. These latter findings were consistent with more mechanistic studies indicating that metformin attenuate the insulin sensitizing effect of acute and chronic exercise.
24,25
Factors like exercise timing relative to the meal and circadian factors may explain the discrepancies between our findings and the results of these latter studies. In our study exercise timing was controlled where exercise was performed in the afternoon between 4:00 and 6:00
In our study, insulin was significantly lower in the fasting state during pre-meal-metx compared to the 2 other conditions. The administration of metformin 30 min prior to meal attenuated the magnitude of insulin rise after meal ingestion (at time = 15 min) beyond that observed during met-meal and this effect was further magnified by the addition of an acute exercise bout. Ferrannini et al 44 and DeFronzo et al 45 previously demonstrated that the first 20 min of insulin infusion during a euglycemic insulin clamp, muscle glucose is minimally increased, whereas hepatic glucose production is markedly inhibited. Therefore, it could be suggested that the administration of a single metformin dose 30 min prior to meal ingestion would have potentiated hepatic insulin sensitivity beyond its administration with meal and that the addition of exercise would have accentuated this effect. Of course, as mentioned earlier this is in contrast to what has been reported in the literature; where the addition of metformin to exercise has been demonstrated to attenuate the insulin sensitizing effects of exercise. 24 However, in these latter studies the attenuated improvement of peripheral insulin sensitivity coincided with higher free fatty acids and numerically, but non statistically significant, higher hepatic insulin sensitivity (≈15% higher), which may suggest a coordinated differential organ-specific adjustment. In line with this logic hepatic insulin sensitivity has been demonstrated to dissociate from peripheral insulin sensitivity (the latter deteriorates while the former improves) in low caloric diet-mediated T2D reversal. 46 Similar pattern of response was also observed in response to prolonged fasting. 47 What has metformin in common with these scenarios is the stimulation of intestinal glycolytic glucose utilization—a caloric restriction-like effect—that may decrease systemic glucose appearance and consequently finely tune tissue specific insulin sensitivity to maintain blood glucose within physiological levels.
Except its glucose and lipid lowering properties, metformin has also been reported to have anti-obesogenic properties. These properties appear to be related to its effects on appetite and food intake. Sato et al 16 showed that pre-meal metformin administration decreases satiety compared to metformin administration after meal. In our study we have not detected such effect. An explanation for this discrepancy may arise from methodological differences related to the interactive effects between the chronic metformin use and the acute pre-meal metformin administration in the study of Sato et al. 16 In our study, we minimized these effects by including metformin naïve subjects and showed that administration of a single metformin dose may not have superior effects to metformin administration with the meal on appetite sensations.
Metformin is generally administered with or after the meal to minimize its associated gastrointestinal side effects. Similar to Sato et al 16 we have showed that pre-meal metformin administration does not exacerbate the gastro-intestinal side effects of metformin. However, it should be noted that we only studied the acute effects of pre-meal metformin administration and therefore our findings should be interpreted cautiously since we have not studied long-term effects of pre-meal metformin administration.
Conclusion
Our study suggests that pre-meal metformin administration may be superior to metformin administration with the meal in reducing TC and LDL-C without exacerbating gastrointestinal side effects. While exercise seems to not add to these effects, its combination with pre-meal metformin administration appears to have superior benefits on postprandial glucose and insulin kinetics compared to metformin alone.
Footnotes
Authors’ Note
Asma Omezzine and Ezdine Bouhlel are joint senior authors. This crossover trial was approved by Farhat Hached’s University Hospital Ethical Committee (IRB 00008931). The study was conducted in accordance with the Declaration of Helsinki and informed consent was obtained from all individual participants included in the study.
Acknowledgments
The authors want to thank Mme. Nozha Ben Ahmed Mahjoub (Department of Endocrinology, Farhat Hached University Hospital) for her assistance throughout the experimental protocol. The authors want to thank Elite gym Msaken and Kings gym Msaken for their unconditional help in the realization of this protocol. Finally, the authors want to thank the laboratory of SAIPH for their generous gift that consisted in providing metformin tablets.
Author Contributions
JM designed the study and drafted the manuscript, and MHB helped in designing the study and assisted in the realization of experimentations. TA and FC assisted in patient care and in the realization of the experimental part of this work. All authors helped in patient care, revised, read, and approved the final version of this manuscript.
Declaration of Conflicting Interests
The author(s) declared no potential conflicts of interest with respect to the research, authorship, and/or publication of this article.
Funding
The author(s) received no financial support for the research, authorship, and/or publication of this article.