
Abstract
Background:
Drug-induced QT prolongation is a potentially preventable cause of morbidity and mortality, however there are no widespread clinical tools utilized to predict which individuals are at greatest risk. Machine learning (ML) algorithms may provide a method for identifying these individuals, and could be automated to directly alert providers in real time.
Objective:
This study applies ML techniques to electronic health record (EHR) data to identify an integrated risk-prediction model that can be deployed to predict risk of drug-induced QT prolongation.
Methods:
We examined harmonized data from the UCHealth EHR and identified inpatients who had received a medication known to prolong the QT interval. Using a binary outcome of the development of a QTc interval >500 ms within 24 hours of medication initiation or no ECG with a QTc interval >500 ms, we compared multiple machine learning methods by classification accuracy and performed calibration and rescaling of the final model.
Results:
We identified 35,639 inpatients who received a known QT-prolonging medication and an ECG performed within 24 hours of administration. Of those, 4,558 patients developed a QTc > 500 ms and 31,081 patients did not. A deep neural network with random oversampling of controls was found to provide superior classification accuracy (F1 score 0.404; AUC 0.71) for the development of a long QT interval compared with other methods. The optimal cutpoint for prediction was determined and was reasonably accurate (sensitivity 71%; specificity 73%).
Conclusions:
We found that deep neural networks applied to EHR data provide reasonable prediction of which individuals are most susceptible to drug-induced QT prolongation. Future studies are needed to validate this model in novel EHRs and within the physician order entry system to assess the ability to improve patient safety.
Introduction
Drug-induced long QT syndrome (diLQTS) is characterized by marked prolongation of the QT interval on an electrocardiogram (ECG) following drug administration. This prolongation of the QT interval increases the risk of developing Torsades de Pointes (TdP), a form of polymorphic ventricular tachycardia which can be fatal. 1 The 99th percentile for the QTc interval is 480 milliseconds (ms) in adult women and 470 ms in adult men 2 and the risk of TdP significantly increases when the QTc interval exceeds 500 ms. 2 -8 There have been numerous cardiac and noncardiac medications associated with QT prolongation and TdP, and it is the most common cause for withdrawal of medications on the market as well as failure to make it out of the drug development pipeline. 9 -11 Recently, this condition has gained media notoriety given that at least 2 of the medications utilized early in the treatment of COVID-19, hydroxychloroquine and azithromycin, can cause QT prolongation. 12 Given that diLQTS is a preventable cause of morbidity and mortality, an accurate prediction model is needed to stratify an individual’s risk of developing this condition. In most cases, alternative therapies could be considered for an individual identified as high risk. 13 In cases where a medication may be unavoidable, 14 knowing an individual’s risk could be used to guide monitoring. 15 A system for stratifying patients by risk of diLQTS 16,17 would improve safety for the use of known QT-prolonging medications.
Machine-learning methods can leverage big data sources to predict various cardiovascular and non-cardiovascular outcomes. Many standard machine-learning techniques, such as support vector machines, 18 random forests, 19 and boosted/bagged decision trees, 20 have successfully predicted clinical outcomes; however, recently deep-learning models have demonstrated superior results. 19,21 -25 Deep learning methods are composed of multiple hierarchical layers of neural networks which allows improved learning potential and power but requires a larger amount of data. Data from the electronic health record (EHR) is increasingly a source for the development of prediction models using machine learning methods. Consolidation of EHR data into harmonized databases allows deep learning methods to be utilized for clinical applications and allows a model created in one EHR to be directly deployed in others. 17,26 -29 Furthermore, a model built directly off of EHR data can be directly inserted into a physician order entry (POE) system to alert a provider of increased risk in real time.
In this study we present a method for risk stratification using machine learning techniques applied to harmonized EHR data. We hypothesize that deep machine-learning methods can reliably identify patients at risk for diLQTS. Ultimately, we aim to develop a system that can be integrated into EHR systems to alert providers of this risk.
Methods
Data Source and Study Population
We examined data from the UC Health hospital system, an integrated academic healthcare system that includes 3 main regional centers (North, Central, South) across the Colorado Front Range that share a single Epic instance. Data were gathered from 2003 through November, 2018, and were queried using Google BigQuery to create a dataset and conduct analyses directly on the Google cloud platform.
Inpatient encounters were selected in which the patient was administered a known QT-prolonging medication (Supplementary Table 1), 30 and had an ECG performed within 24 hours of medication administration.
Case Selection
The primary outcome was the presence or absence of a QTc interval of greater than 500 ms. Cases were identified as those encounters in which the QTc by ECG exceeded 500ms 31,32 and controls were those in which no ECG had a QTc > 500 ms throughout the encounter, after having received a known QT-prolonging medication. These designations (case/control) were the labels used for training and testing the learning models. ECGs with conduction disease in the form of bundle branch block, intraventricular conduction disease, or ventricular pacing, defined by a QRS duration of greater than 120 ms, were excluded.
Model Development and Data Analysis
We used a common data model for EHR data, based on the Observational Health Data Sciences and Informatics (OHDSI) collaboration, which uses the Observation Medical Outcomes Partnership common data model (OMOP-CDM) which is a mapping of the raw EHR data to a harmonized dataset. 28 6,458 variables were included in the model which consisted of medications, procedure codes, diagnosis codes, labs, and demographic data. There were no missing variables for continuous variables, and the remaining data was coded as a binary variable with no history of that variable being coded as a zero.
After label assignment, data was split into a training (80%) and testing set (20%). The training set was used to develop and compare deep learning models using 5-fold cross-validation, to allow comparison of models and tuning of hyperparameters.
Given the relative infrequency of the outcome, there was imbalance between the cases and controls. Re-sampling techniques can be used to improve this balance and avoid the over-assigning of new cases to the majority class. 26 Both oversampling techniques (increase frequency of cases relative to controls) and undersampling techniques (reduce frequency of controls used) were employed. These techniques included SMOTE, 33 ADASYN, random oversampling, and random undersampling. The random oversampling technique generated 21,100 additional samples and the random undersampling discarded 21,100 samples in order to match the majority and minority class.
Once an optimal resampling approach was selected, several classification algorithms (naïve Bayesian classification, regularized logistic regression, random forest classification, deep neural networks) were compared. The deep neural network model contained 6 hidden layers. The first hidden layer used 1024 neurons, and layers 2-6 had 512 neurons each. The activation function used was sigmoid for all of the neurons on the hidden layer and 50% dropout at each hidden layer. Models were selected based on discrimination using the F1-score, 34 which measures performance on imbalanced datasets more effectively than alternative metrics such as classification accuracy and the receiver operating characteristic 35 (ROC), which was used for secondary comparison.
We also examined calibration of the optimal model for discrimination using calibration curves, binned by deciles of predicted probability, displaying frequency of events within each bin. To perform Platt rescaling, we performed logistic regression using 50% of the testing set (random sampling) with predicted probability from the optimal model on the actual events, and then used the predicted coefficients to calculate a “rescaled” risk probability on the other 50% of the testing set. We used Youden’s J method to identify an optimal cutoff for the rescaled prediction model, 36 and then examined sensitivity and specificity curves (as well as false positive and false negative) over various cutoffs, with attention to identifying an optimal cutoff to fit the clinical application.
All analyses were run on Google Cloud Platform, using 96 CPUs and 620 GB of RAM. Scripts were composed in Python (version 3) and were run on Jupyter Notebook with Tensorflow platform on the Google Cloud Platform. Machine learning packages included scikit-learn and keras.
Results
Across the entire dataset, 35639 inpatients were identified who received a known QT-prolonging medication and had an ECG within 24 hours following administration. Of those, 4558 (12.8%) patients developed a QTc > 500 ms by ECG, while the QTc of the remaining 31081 (87.2%) patients remained < 500 ms for the duration of the encounter. The age and gender did not significantly differ between the groups, and the prevalence of cardiovascualr risk factors for each group is displayed in Table 1.
UCHealth Population Baseline Demographics.a
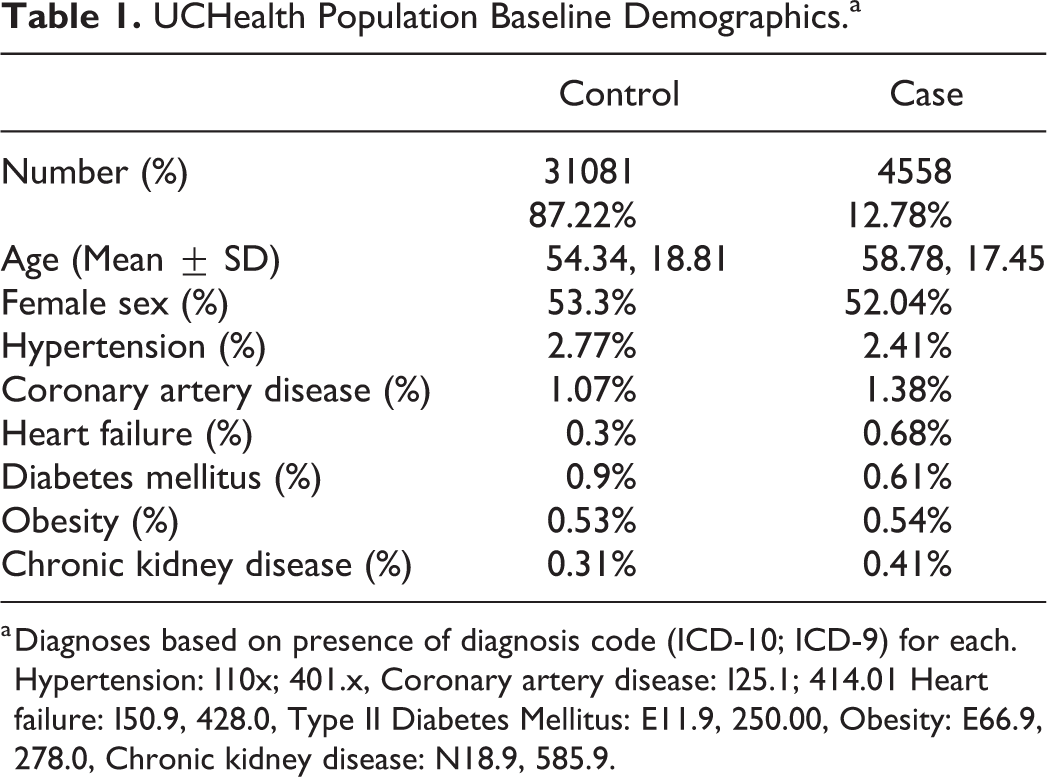
a Diagnoses based on presence of diagnosis code (ICD-10; ICD-9) for each. Hypertension: I10x; 401.x, Coronary artery disease: I25.1; 414.01 Heart failure: I50.9, 428.0, Type II Diabetes Mellitus: E11.9, 250.00, Obesity: E66.9, 278.0, Chronic kidney disease: N18.9, 585.9.
We examined various re-sampling methods to address the substantial degree of imbalance in the dataset of cases compared to controls. We found that random oversampling had the overall best performance by F1 score and AUC (F1 0.404; AUC 0.71) as compared with other re-sampling methods including SMOTE, random undersampling, and ADASYN (Table 2).
Various Resampling Techniques Using Deep Neural Network.

Using random oversampling on the training data, we tested the accuracy of various classification models on the held-out dataset. A deep neural network provided superior classification for development of a long QT interval compared with other methods with an F1 score of 0.404 and an AUC of 0.71 (Figure 1). The F1 Score is a measure of the weighted average of precision and recall which takes into account false positives and false negatives and is a more useful measurement with uneven distributions. Prediction accuracy for other methods is listed in Table 3.

Receiver operating characteristic for deep neural network.
Accuracy of ML Methods.

In order to rescale predictions, we performed logistic regression of predicted risk of diLQTS on actual outcomes in a 50% split sample from the testing set, in which the model parameters were β0 (intercept) −3.7 ± 0.1, β1 4.1 ± 0.2, pseudo-R2 0.15, P < .0001, and then applied the predicted probabilities from that model to the predictions in the other 50% sample for Platt rescaling. After recalibration, no subject had over 0.5 predicted probability of diLQTS, with overall better calibration than the original model (Figure 2). We then applied Youden’s J method to identify the optimal cutoff probability for classification to both the original and resampled probabilities, and found that while rescaling had decreased the optimal cutoff from 0.43 to 0.14, there was no difference in the discrimination based on AUC (0.71 for both). When applied to the testing set, this cutpoint yielded a sensitivity of 71%, specificity 73%, false positive rate 28%, and false negative rate 30% (Figure 3).

Original model predictions and predictions following rescaling.

Model performance at varying cutpoints.
Discussion
In this analysis, we examined the prediction of drug-induced QT prolongation using harmonized EHR data. We found that a deep neural network with random oversampling had the most accurate classification performance and overall performance of the model was reasonable.
A frequent challenge encountered in prediction analysis of healthcare data is that of an imbalanced class distribution. In this case, the minority outcome (development of a prolonged QTc interval), was much less frequent than the majority outcome (no significant increase in QTc interval). This imbalance can become a problem when applying machine learning methods as some assume a relatively equal balance between classes. This assumption leads to a tendency to favor the majority class when applied to an imbalanced dataset, which can decrease the accuracy in classifying minority occurrences. 37 Because this is a frequently encountered scenario, prior groups have studied various rebalancing strategies. 37,38 Previous analysis has shown an improvement in prediction accuracy when applying rebalancing methods, as long as the dataset is sufficient in size. 39 Resampling techniques including random oversampling of the minority class or random undersampling of the majority class each have drawbacks. In the case of oversampling the minority class, this can lead to an overfit model, while in the case of undersampling the majority class, there is an associated loss of information. 40 In our dataset, rebalancing using oversampling was likely the superior method given the increase in power obtained with this method. However, no one technique will be optimal for all datasets and it remains essential to evaluate multiple rebalancing methods for any given problem.
We found the prediction classification using a deep neural network to be reasonably accurate for classifying individuals at risk of developing diLQTS and superior to alternative classification methods. Deep learning methods combine multiple layers of neurons allowing for nonlinear relationships to be modeled. 41 These methods have recently been found to have superior prediction capabilities and have been applied to the prediction of cardiovascular outcomes and cardiovascular imaging analysis. 42,43 Deep learning techniques tend to perform better than other techniques as the amount of data increases which is likely why it had superior performance when applied to our large dataset. One of the major disadvantages of using a deep learning model is the black-box nature of the method and therefore an inability to determine individual predictor variables for the outcome. Therefore, this analysis does not inform the identification or modification of risk factors for developing drug induced QT prolongation.
We developed our model directly from harmonized EHR data (OMOP common data model). Machine learning models are notoriously biased for the population from which they are derived, and using a common data model allows for direct application and validation in a separate EHR to examine bias. Once verified, this model can also be directly incorporated into the EHR as a clinical decision support tool. Based on a given risk probability for the development of a prolonged QT interval, patients can be assigned a risk score. This information is stored on the EHR backend and is hidden from users but can be incorporated into front-end logic in the form of a best-practice advisory (BPA). Identifying individuals at increased risk could sway providers to choose an alternative therapy not known to cause QT prolongation when possible, or to appropriately monitor patients who must receive a QT prolonging agent.
Prior investigators have developed risk scores for predicting diLQTS, but this is the first to our knowledge to utilize deep learning methods applied to EHR data. 44,45 Prior studies have typically focused on a specific patient population, while this study examined all inpatient encounters regardless of reason for admission or hospital location. Other groups have used machine learning techniques in the prediction of long QT, but have focused on the drug molecules rather than individual factors. 46
Calibration measures how accurately the model’s predicted probability matches the observed probability of the outcome. Prior to recalibration, our model showed generally poor calibration, with a pattern indicative of overfitting; however, after Platt rescaling, the model had better calibration, and showed satisfactory discrimination. Further evaluation of sensitivity/specificity curves identified other potential cutoffs for screening for diLQTS, depending on the overall goal and follow-up options (Figure 3). By choosing different cutpoints, we can improve the sensitivity of our prediction at the expense of specificity, or vice-versa, which can be an important clinical tool. Currently, patients who are initiating certain antiarrhythmic agents including Dofetilide and Sotalol are recommended to undergo direct observation in the hospital. When trying to determine who may not need such intensive monitoring, decreasing false negatives could be favored, and in our model, lowering the cutoff to 0.04 for the rescaled prediction yields a sensitivity of 0.94, with a decrease in specificity to 0.24 (Figure 3). Alternatively, when identifying outpatients initiating more benign agents who might benefit from more intensive monitoring, a higher cutpoint with low false positives may be preferred.
There are several limitations of this study. First, it was performed in a single hospital system and global applicability is unproven. Validation in novel institutions is necessary prior to widespread clinical use. Additionally, the retrospective and observational nature lead to many missed cases, as most patients will not have an ECG performed within 24 hours of medication administration. Further, some variables that could potentially be useful for model development are excluded if they were not included in the harmonized dataset.
Conclusion
As we enter the age of precision medicine, we work toward the goal of identifying the right drug, for the right patient, at the right time. In this investigation, we applied ML models to individuals receiving known QT prolonging medications, and found that these methods can reasonably predict which patients are susceptible to develop significant drug induced QT prolongation. The combination of random overrsampling and a deep neural network algorithm provided superior classification compared with other models. Our methodology and use of harmonized EHR data is an important step for developing prediction tools that can be applied to clinical practice. Future studies should examine whether the addition of common genetic variants can improve the prediction accuracy of diLQTS and whether clinical decision support tools can be developed to improve the safety surrounding the use of medications known to prolong the QT interval.
Supplemental Material
Supplemental Material, sj-docx-1-cpt-10.1177_1074248421995348 - Prediction of Drug-Induced Long QT Syndrome Using Machine Learning Applied to Harmonized Electronic Health Record Data
Supplemental Material, sj-docx-1-cpt-10.1177_1074248421995348 for Prediction of Drug-Induced Long QT Syndrome Using Machine Learning Applied to Harmonized Electronic Health Record Data by Steven T. Simon, Divneet Mandair, Premanand Tiwari and Michael A. Rosenberg in Journal of Cardiovascular Pharmacology and Therapeutics
Footnotes
Acknowledgments
Author Contributions
STS led the construction and writing of the mansucript. MR and PT constructed the model and performed the analysis. All authors provided feedback to the research methods and review of the manuscript.
Declaration of Conflicting Interests
The author(s) declared no potential conflicts of interest with respect to the research, authorship, and/or publication of this article.
Funding
The author(s) disclosed receipt of the following financial support for the research, authorship, and/or publication of this article: This work was supported by grants from the NIH/NHLBI (K23 HL127296; R01 HL146824) and from the Google Cloud COVID-19 research credits program.
Supplemental Material
Supplemental material for this article is available online.
References
Supplementary Material
Please find the following supplemental material available below.
For Open Access articles published under a Creative Commons License, all supplemental material carries the same license as the article it is associated with.
For non-Open Access articles published, all supplemental material carries a non-exclusive license, and permission requests for re-use of supplemental material or any part of supplemental material shall be sent directly to the copyright owner as specified in the copyright notice associated with the article.