
Abstract
Background:
Galvanic current-induced vasodilation (CIV) is impaired in patients under low-dose aspirin (ASA; ≤ 500 mg/day), but potential covariates and the impact of the time since the last ASA intake are unknown.
Objectives:
We used tissue viability imaging (TiVi) in patients at risk of cardiovascular disease and examined its association with self-reported treatments.
Patients/Methods:
We recorded the age, gender, height, weight, smoking status, and use of 14 different drug categories in 822 patients either with known peripheral artery disease or at risk thereof. The difference between TiVi arbitrary units (TAUs) where stimulation was applied and an adjacent skin area was recorded, as well as the time since the last ASA intake. Step-by-step regression analysis was used to determine the factors that affect CIV amplitude.
Results and Conclusions:
CIV was 28.2 ± 22.9 vs. 14.6 ± 18.0 TAUs (P < 0.001) in patients treated with ASA (n = 287) and not treated with ASA (n = 535), respectively. The main determinants of CIV amplitude, by order of importance, were: aspirin intake, diabetes mellitus, age, and male sex. In ASA-treated patients, the main determinants were diabetes mellitus, time since the last ASA intake, male gender, and age. Non-invasive determination of the physiological effects of low-dose ASA is feasible in routine clinical practice. It could be a clinical approach to provide objective evidence of ASA intake, and potentially could be used to test adherence to treatment in ASA-treated patients.
Introduction
Low-dose (≤ 500mg/day) acetylsalicylic acid (ASA) is one of the most commonly used drugs in patients with or at risk of cardiovascular disease, despite recent debate. 1,2 ASA has many advantages: it costs little, is available worldwide, and has a long-lasting effect on platelet aggregation. Unfortunately, up to one third of patients seem to be resistant to ASA due to a high platelet re-synthesis rate, an insufficient dose, or poor adherence to treatment. 3,4 Tailored treatment based on laboratory platelet function tests could benefit such patients. 5,6 Another option is to switch to a different category of antiplatelet drugs. Unfortunately, blood assays, which involve a moderately invasive approach, show a debatable cost/benefit ratio on a population basis. Ideally, a non-invasive technique to assess the clinical effects of ASA should be used to follow up ASA-treated patients, and for example could help defining ASA treatment adherence beyond the sole patient’s declaration.
Applying galvanic current to skin leads to current-induced vasodilation (CIV). In healthy volunteers, CIV is a normal neurovascular response, which is abolished by ASA. 7 We recently used multivariate linear analysis to show that a low-dose ASA intake and body mass index (BMI) were associated with CIV amplitude measured by laser speckle contrast imaging (LSCI), but the other clinical characteristics of patients or of the other drugs taken by the 400 patients were not studied. 8 Although many drug categories were not tested, we concluded that CIV could be an objective and specific marker of ASA intake. Low-cost handheld portable spectrometric devices have been put forward as a way to estimate skin perfusion. They are less expensive and less sensitive to movement artifacts compared to LSCI. The way that these devices work is they take a photographic recording during standard light illumination through polarization filters, then perform a colorimetric analysis of the images.
The aim of this study was to determine the CIV response on the forearm using a tissue vitality spectrometric system (TiVi: WheelsBridge AB, Linköping, Sweden) in subjects with suspected peripheral artery disease (PAD). We hypothesized that recording the CIV could be a simple marker of low-dose ASA (≤ 500 mg/day) intake in clinical routine practice. Having included a wide variety of drug categories, our primary aim was to determine whether ASA is the only (or at least the main) drug to impair the recorded CIV response. As secondary goals, we tested: 1) whether the CIV response would be proportional to the time since the last ASA intake, 2) whether a cutoff point could be found to determine ASA intake, and 3) the concordance of TiVi results, LSCI results, and platelet aggregation tests in a subgroup of patients.
Methods
Study Design
Participation in this prospective interventional single-center study was offered to symptomatic and asymptomatic patients referred for the investigation of known or suspected peripheral artery disease (PAD) in the Department of Vascular Medicine at Angers University Hospital. The study was conducted in accordance with the Declaration of Helsinki, was approved by the local Ethics Committee, and was registered in the clinicaltrial.gov database under reference NCT:03357367 before the first patient was included. The inclusion criteria were: minimum age of 18 years old, referral for vascular investigations to the Department of Vascular Medicine at Angers University Hospital, and coverage by the French national healthcare system. The exclusion criteria were: use of high-dose ASA (> 500 mg/day) in the previous week, pregnancy, inability to understand the study goal, and patients protected by decision of law. Eligible patients were given the option to participate after the protocol was explained to them orally and in writing, and they were included after they signed a written consent form.
Calculation of the Number of Subjects
We expected 25% of our patients to be treated with ASA. Our 2 main objectives were to determine which clinical variables influenced CIV response and to specify the area under receiver operating characteristics curve for ASA prediction, estimated at 0.80 precise to 0.02. Given that it is generally accepted that 10 to 15 observations must be studied to assess whether there is an association between 2 variables by linear regression, recruiting a minimum of 800 patients was enough to cover both goals.
Study Population
The clinical data collected included age, gender, height, weight, body mass index (BMI), smoking status, and currently prescribed medications. Categories of drugs prescribed to less than 15 participants were not considered of interest in the database (i.e.: antiarrhythmic agents, calcium blockers, diuretics, proton-pump inhibitors, nonsteroidal anti-inflammatory drugs). The categories studied were: antihypertensives, cholesterol-lowering drugs, antidiabetic drugs, opioids or benzodiazepines or antiserotonin or other neuroleptics, platelet ADP inhibitors, anticoagulants, acetaminophen, corticosteroids, alpha blockers, anti-TNFα agents or other immunosuppressors, antihistamines, allopurinol, beta-blockers, betamimetics, and ASA. For ASA, the dose regimen and the time since the last intake were recorded. The presence of diabetes mellitus was assessed by a prescription (intake or administration) for antidiabetic drugs.
Assessment of Skin Microcirculation
As part of microvascular investigations, patients were placed in a semi-recumbent position in a quiet air-conditioned room (22+/−3°C) with moderate lighting and no direct sunlight. Skin blood flow was studied on the volar aspect of the forearm using a TiVi700 imager (WheelsBridge AB, Linköping, Sweden). We used so-called active probes specifically designed to allow for simultaneous recording of blood flow and application of current (probe LI-611, Perimed, Sweden). These active probes have a circular chamber measuring approx. 1 cm2, which was filled with deionized water. A reference disposable adhesive electrode (PF384, Perimed, Sweden) was positioned 5 to 10 cm away from the active probe, forming the anode and closing the current system. The probe and electrode were connected to a 9-volt battery-powered current supplier (PeriIont Micropharmacology System, PF 382 Perimed, Jarfalla, Sweden), which delivered a galvanic current of 0.1 mA for 2 periods of 10 seconds separated by a 4-minute interval. Pictures of the skin covering the probe chamber and an adjacent skin area used as reference were taken before the first period of current application and 10 minutes after the second period of current application. We made sure that the distance between the skin of the forearm and the camera lens of the TiVi700 system was constant between patients by using an integrated laser pointer.
As a way of comparing techniques, skin blood flow was also measured in 30 patients who agreed to the additional measurements. We used a laser speckle contrast imager (LSCI: Pericam PSI System, Perimed, SW) and a double-layer adhesive patch to subtract movement artifacts, as previously described. 8 For the LSCI measurement, we recorded for 30 seconds before and 10 minutes after applying of the current. LSCI and TiVi measurements were not simultaneous and were performed in a random order. The whole LSCI and TiVi procedure took less than 30 minutes.
Quantification of Platelet Activity
In the same 30 patients who agreed to an additional LSCI recording, a blood sample on citrated tubes was collected from the arm on which CIV was not applied. Aspirin-induced platelet inhibition was measured on this blood sample using the VerifyNow® System (Werfen, Barcelona, Spain) following the manufacturer’s recommendations. The results were expressed as aspirin reaction units (ARUs). A lack of aspirin-induced platelet dysfunction must be considered when ARU ≥ 550. 9 Patients were informed of the results of the platelet aggregation test and asked about compliance if platelet aggregation was normal.
Analysis of Images
All microvascular recordings were analyzed a posteriori by operators blinded from any other data collected for the study. As previously described, LSCI recordings were analyzed by subtracting a reference area and the result was the average of the 30 seconds of recording expressed in laser speckle arbitrary units: LSAU. 8 Pictures taken to measure current-induced vasodilatation using the TiVi700 system were imported into the relevant software (TiVi700 analyzer, WhellsBridge) and analyzed as follows: First, 2 circular regions of interest (ROI) were delineated so that one corresponded to the stimulated skin area (i.e. inside the chamber of the active probe, ROI1) and the other corresponded to the non-stimulated skin area (reference, ROI2). The software automatically calculated the mean blood perfusion values after the ROIs were defined. To correct the values of variations independent from current stimulation, ROI2 was subtracted from ROI1 for each point in time (i.e. before the first current application and 10 min after the second current application). For each patient, current-induced vasodilatation was calculated as the difference between the corrected mean blood perfusion values at the 2 points in time and expressed in TiVi perfusion arbitrary units (TAUs).
Statistical Analyses
Categorical data are reported as numbers of observations and percentages. Continuous data are reported using means and standard deviations (SD) if distribution is normal and using medians [25-75 percentiles] otherwise.
We analyzed which clinical factors affected CIV amplitude using step-by-step linear regression analysis, assuming that CIV was specific to acetylsalicylic acid intake and independent from other variables. A second analysis was performed among ASA-treated patients, taking the time since the last ASA intake as a potential explanatory variable. Due to the variable’s expected non-Gaussian distribution, we analyzed CIV amplitude among quintiles of times and looked for a significant relationship between the mean CIV within each quintile and the median time of the quintile using linear regression analysis.
The predictive value of current-induced vasodilatation amplitude toward acetylsalicylic acid intake was determined by computing receiver operating characteristics (ROCs). The area under ROC curve (AUROC) was used to indicate the test’s accuracy. A random choice would result in an area of 0.5 and an optimal area is close to 1. Assuming an equal cost of false positive and false negative results, the cutoff point that minimizes the distance of the curve to the 100%/100% sensitivity/specificity angle is considered optimal for clinical use.
The correlation between current-induced vasodilatation measurement, LSCI, and platelet activity measurement was determined by calculating the correlation coefficient r.
For all statistical tests, a 2-tailed probability level of P < 0.05 was used to indicate statistical significance. Statistical analyses were performed using SPSS 15.0.1 (SPSS Inc.).
Results
As shown in the flowchart (Figure 1), 8 of the 830 patients included initially were excluded for technical reasons. One of them had agreed to the additional LSCI and blood sampling procedures.

Study flowchart. LSCI: Laser Speckle Contrast Imaging; Tivi: Tissue Viability imaging.
Three of these 8 patients were excluded due to a dysfunction of the current supplier. In the case of 4 patients, the TiVi image was unsuitable or of poor quality either before or after the stimulation. The last of these 8 excluded patients was unable to remain still.
The characteristics of the 822 patients studied are reported in Table 1. Approximately half of these patients (n = 426) were suspected to have PAD. Among them, 193 were investigated for lower extremity artery disease, while 233 underwent other investigations due to suspected upper extremity, carotid, vertebral, mesenteric or renal artery disease. Of these 426 patients, 257 (60.3%) received ASA for risk factors of PAD. Among the 822 patients studied, 396 had known carotid or vertebral (n = 108), upper extremity (n = 166), lower extremity (n = 140), splanchnic (n = 12) or cardiac (n = 75) diseases. Of these 396 patients, 278 (70.2%) received ASA to treat cardiovascular disease. Thereafter, almost two thirds (65.1%) were treated with low-dose ASA. Most patients (99.3%) received less than 200 mg/day. Daily doses of ASA were 75 mg, 100 mg, 160 mg, 250 mg, 300 mg, and 500 mg in 402, 47, 82, 1, 2 and 1 patient(s), respectively. Depending on the time of the experiment and the patient’s habits, the time since the last intake was heterogeneous, with median time of 19.7 [3.3-22.2] hours, as shown in Figure 2.
Characteristics of the Patients: ASA Is for Aspirin Intake.


Time since the last intake in patients receiving low-dose ASA treatment.
Most patients who reported times since the last intake > 24 hours spontaneously reported that they had forgotten their last intake, while a few stopped the treatment voluntarily or for medical reasons. As shown in Table 1, some significant differences were found between the 2 groups, specifically as regards ongoing treatments for patients under ASA who more often received antihypertensive and cholesterol-lowering drugs, likely due to already known PAD at the time of referral.
Figure 3 shows an example of TiVi images obtained in a patient with ASA treatment and a patient without ASA treatment before and after skin galvanic stimulation.

A picture of the skin through the probe chamber and on an adjacent skin area used as a reference was taken before current application (rest) and 10 minutes after the end of the second period of current application (T10).
Although a small difference was observed between patients treated with aspirin and patients not treated with aspirin, the stimulation induced only in few patients a mild prickle sensation rarely encoded more than 1 on the 10 cm Visual Analog Scale (VAS). On average, the CIV was almost double in patients not treated with ASA compared to ASA-treated patients.
The step-by-step regression analysis using all clinical characteristics and drug categories reported in Table 1 showed that ASA treatment was the first (but not only) parameter associated with CIV amplitude: see Table 2.
Step by Step Regression Analysis With F = 0.05 to Introduce a New Step and F = 0.10 to Exclude a Further Step.

The results are for the entire population (n = 822; upper panel) and for ASA-treated patients only (n = 535, lower panel). Studied variables include ASA intake, age, sex, male sex, weight, height, body mass index, systolic and diastolic blood pressures, active smoking and the following drug categories: antihypertensive drugs, cholesterol-lowering drugs, antidiabetic drugs, non-ASA antiplatelet agents (ADP inhib.), anticoagulants (anticoagul.), acetaminophen, corticosteroids, alpha blockers, beta blockers, beta-agonists, antimitotic drugs and immunosuppressors (Immuno.), antihistamines, allopurinol. Diabetes mellitus is defined as the intake or administration of antidiabetic drugs. In ASA-treated patients only, the time since the last ASA intake was added to the previous variables.
Diabetes mellitus (antidiabetic drug use) in particular had a significant weight on the various models used to determine the factors associated with CIV amplitude. As expected, in the subgroup of ASA-treated patients, the time since the last ASA intake had a significant weight in the models (Table 2). When CIV amplitude was analyzed in each quintiles of time since the last ASA intake, there was a linear relationship between mean CIV and median time, as shown in Figure 4.

Mean and standard errors of CIV amplitude (TAUs) per quintiles of time in ASA-treated patients. Times are presented as median [25°–75°] centiles.
As a logical consequence of the significance of diabetes mellitus in determining CIV amplitude, and as shown in Figure 5, the cutoff point to be used in diabetic patients (17.5 TAUs) was lower than the one that optimized the prediction of ASA intake in non-diabetic subjects (22.5 TAUs). As a result of this difference, the accuracy of CIV for the whole group (estimated from the lowest distance in Figure 5) that was found for a cutoff point of 19.5 TAUs was not as suitable as the accuracies found for each subgroup. This suggests that different cutoff points should be used in diabetic and non-diabetic patients.

Distance from the 100%/100% sensitivity/specificity angle for the receiver operating characteristics (ROC) curve in diabetic (red) and non-diabetic (blue) patients as a function of the cutoff point used (Diabetes mellitus being defined as the prescription of anti-diabetic drugs). Due to the shift between optimal cutoff point (lowest distance) between the 2 groups, the diagnostic performance calculated for the whole population (dark dashed line) is lower than in each subgroup. The gray dotted line represents the curve that would result from a random choice.
Figure 6 shows that a significant correlation was found between LSCI and TiVi results, while no correlation was observed between TiVi and platelet aggregation tests measured using VerifyNow. While all patients were treated with ASA, 5 of the 29 patients tested had ARU aggregation values above 550, which points to a lack of platelet dysfunction. Four of them received the lowest daily dose: 75 mg. It should be noted that one female patient who had a high ARU value combined with a high flow increase on LSCI was informed of these paradoxical results and eventually admitted that she had stopped treatment for 8 days, but she had not reported this at inclusion. The other 4 patients with normal ARU values confirmed that their intake had been regular. One had high CIV responses while 3 had very low CIV responses although they were relatively young and non-diabetic.
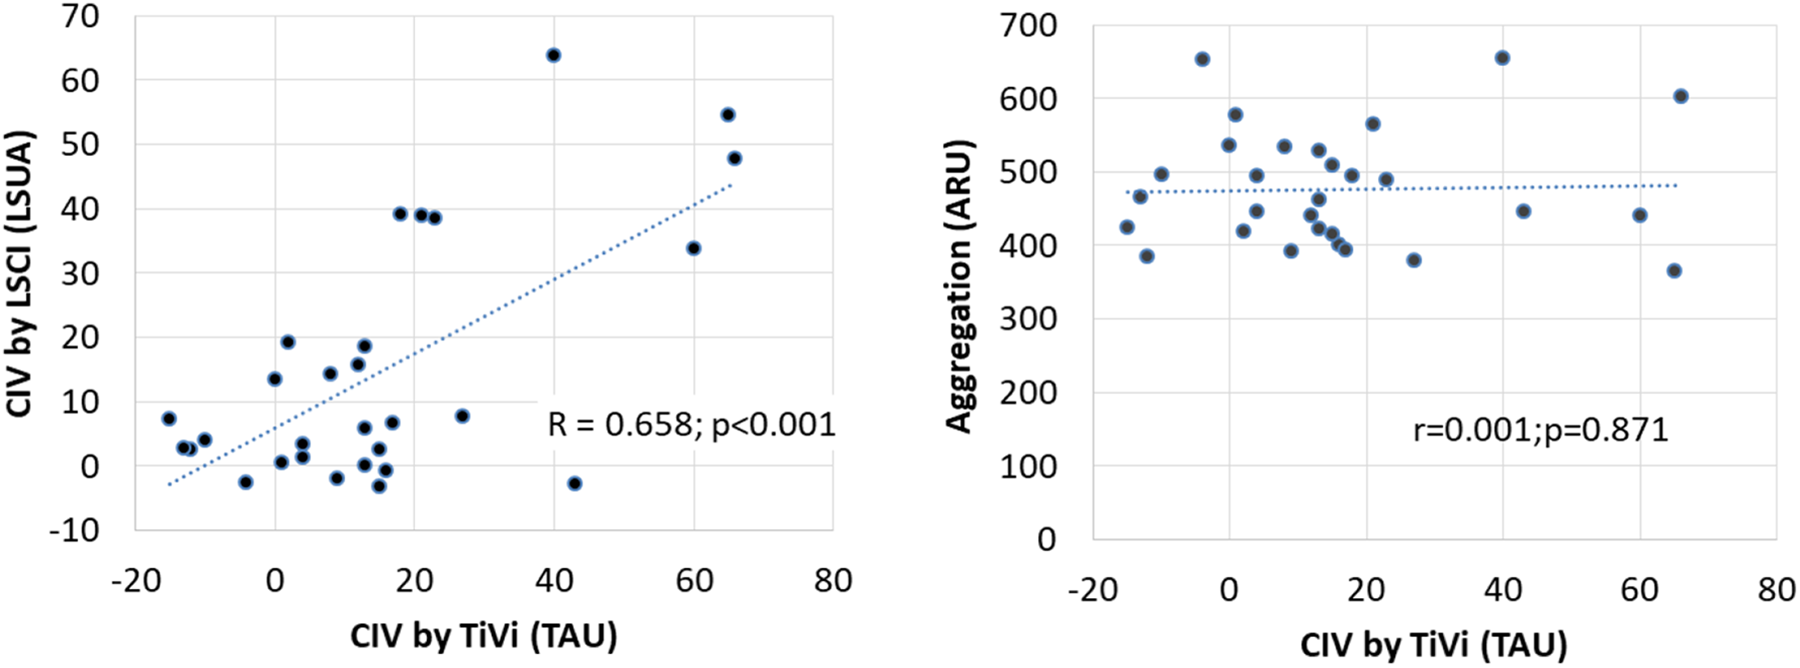
Correlation of TiVi current-induced vasodilation (CIV) amplitude to laser speckle contrast imaging (LSCI)-measured CIV and to platelet reactivity in the 29 aspirin-treated patients that underwent the 3 recordings.
Discussion
CIV and Aspirin
Although current-induced vasodilation (CIV) was initially studied as an undesirable side effect of iontophoresis, 10 it is an interesting specific axon reflex originally observed in healthy subjects. In healthy volunteers, 2 cathodal-current applications of 10 seconds through deionized water doubled the amplitude observed following all-at-once 20-second current application. 11 This amplified vascular response due to segmental application was observed for inter-stimulation intervals of up to 40 minutes, and was impaired by a single dose of 1-g oral aspirin for up to 3 days. 11 Segmented anodal stimulations also resulted in a CIV response that was impaired by low-dose ASA for up to 26 hours, but not by the ADP inhibitor clopidogrel bisulfate. 12 Among the various treatments used in a large series of 400 patients, ASA intake was the only drug that impaired anodal CIV amplitude, and CIV was specific and highly accurate in predicting ASA intake in these subjects. 8 All these studies were performed with laser Doppler flowmetry or laser speckle contrast imaging tools. 8,10 -12 These systems are expensive, however, and highly sensitive to environmental conditions and the movement of subjects. 13,14 The tissue viability (TiVi) imaging system was suggested as a low-cost alternative to estimate human microcirculation. 15 TiVi quantifies red blood cell concentration in microcirculation, while laser Doppler or laser speckle contrast imaging (LSCI) are noninvasive investigations of microcirculatory blood flow. TiVi technology is based on polarization spectroscopy measurements of light absorption by red blood cells within the red and green wavelength regions. 15,16 The system’s advantages include that it can be handheld and shows lower inter-subject variability than laser Doppler flowmetry, although it seems to discriminate vasoconstriction responses better than vasodilation responses. 16,17 As for anodal stimulation using LSCI-detected CIV, this study confirms that ASA is probably the only drug associated with CIV impairment in cathodal-induced and TiVi-detected CIV, since we consider that antidiabetic drug are not responsible by themselves for the CIV impairment, but only indicate the existence of underlying diabetes mellitus (and of the neurovascular dysfunction associated with this disease). The area under the curve to predict ASA intake in this study (0.679) is significantly lower than the one observed previously with LSCI (0.853). 8 This suggests either that LSCI is a more effective tool (although not as user-friendly as TiVi for routine clinical use) or that anodal stimulation is preferable to cathodal stimulation for inducing CIV.
Time Since the Last Intake
Apart from the different techniques used to detect CIV, the appeal of this study compared to our previous work is the relationship between CIV response and the time since the last aspirin intake. An estimated time that would be required to reach the mean value observed in the group of patients not treated with aspirin can be calculated based on the regression line of Figure 4: the calculated time is 79 hours (3.3 days). This result is fascinatingly close to the results observed in studies involving aggregation tests. In 15 healthy subjects who received aspirin 81 mg·day−1, arachidonic-acid-induced light transmission aggregation (LTA) recovered within 4 days of stopping the drug. 8 In 38 healthy volunteers receiving either a placebo or 75 or 300 mg of aspirin once a day for 14 days, template bleeding times and specific platelet function testing (using the PFA-100) normalized within 96 hours and 144 hours after stopping aspirin, respectively; there was no apparent difference in effect duration between patients taking 75 or 300 mg of aspirin. 18 In 248 patients with hypertension receiving long-term aspirin treatment at a 100-mg daily dose, stopping aspirin with daily platelet reactivity testing showed that reactivity normalized 96 hours after discontinuing aspirin. 19 In 14 male volunteers who received 100 mg aspirin·day−1 for 10 days and in 58 aspirin-treated patients tested 3, 4 or 6, and 10 days after stopping the drug, prior to elective surgery, the aggregation normalized within 3 days of stopping aspirin in the volunteers and within 4 to 6 days in the patients. 20 Whether or not CIV could be used as an individual bedside test to confirm the reversal of ASA’s clinical effects after stopping it is a question worth examining as part of future studies and potential clinical applications.
Correlation of Techniques
Another asset of this study is the subgroup examination of concordances of TiVi-detected CIV, LSCI results, and biochemical analysis of platelet reactivity. The respective underlying methods and each method’s advantages and limitations as regards assessing microvascular reactivity have already been described in detail. 16,17 The correlation between LSCI and TiVi results that we observed is in the same range as in previous reports comparing the 2 techniques (ρ = 0.64), 21 or comparing TiVi to laser Doppler flowmetry (r2 = 0.521). 22 Conversely, the lack of correlation between TiVi results and platelet biochemical assays is surprising. The 2 approaches do not measure similar aspects of platelet function. Specifically, CIV is expected to be dependent on microvascular impairment, as can be observed in diabetic patients. 23 It is also possible that the concordance would be different with other aggregation functional biochemical tests. The correlations between thromboelastography and coagulation test parameters are very weak, with r2 ranging from 0.033 to 0.106 respectively, 24 but even platelet reactivity tests are poorly correlated between each another. 25 The correlation of platelet reactivity using VerifyNow and Multiplate P2Y12 assays in patients with acute coronary syndrome was only r = 0.43. 26 In 316 patients receiving aspirin and clopidogrel, a poor correlation was observed between arachidonic acid-induced platelet reactivity by aggregometry and the VerifyNow aspirin assay (r = 0.15), while neither method correlated with multiple electrode aggregometry. 27 A major issue with aggregation tests is the pre-analytic constrains. Pre-analytic errors that could explain the higher variability observed with multiplate aggregation test compared to VerifyNow were the reason for our choice of technique. 28 Lastly, platelet reactivity assays are sensitive to platelet counts and hematocrit levels, while to the best or our knowledge no such correlation is reported with microvascular reactivity. 29
Limitations
One source of limitations is that patients self-reported treatments. Elderly patients with a cardiovascular disease often have poor knowledge of the medications prescribed to them. 30 In primary healthcare facilities, only 10.9% of 1,618 patients were able to correctly recall the names of their drug(s). 31 As such, it cannot be excluded that some patients left out ASA from their treatment, which would explain the otherwise unexplainable lack of CIV observed in certain patients. Conversely, a persisting CIV response in patients reporting ASA among the drugs they take could result from unreported poor adherence to the treatment. This theory is reinforced by the fact that analysis of CIV in healthy volunteers receiving the drug under supervision never resulted in persistent CIV. Lastly, assessments of cardiovascular diseases or diabetes mellitus were only indirectly based on medication intake. It cannot be excluded that some patients had the disorders but remained untreated, thereby contributing to endothelial dysfunction.
Our study also involves certain technical issues. On the one hand, acquisition through the glass chamber attenuated the TiVi signal by a factor of 30% compared to adjacent skin, yet correcting results to account for the attenuation did not change our findings (data not shown). On the other hand, it seems that TiVi is sensitive to pigmented skin 32 and the results we observed for ASA detection were less satisfactory than in the case of LCSI. Other portable tools may therefore be preferable for future studies provided that they accurately measure microvascular blood flow and incur a reasonable cost. 33,34
From a methodological point of view, we were asked to justify the use of CIV as a way of detecting the effect of ASA treatment in the patient information letter. It is possible those patients who did not take the drug on a regular basis were not keen to participate and that the number of patients with persistent CIV responses due to low adherence was underestimated. It could also be argued that ASA-treated patients suffered from more severe PAD or were most likely to have an already known cardiovascular disease compared to untreated patients. On the one hand, difference in severity is not excluded, but we cannot analyze data on the basis of symptoms because the database does not allow for this approach. On the other hand, the proportion of patients receiving ASA was higher in patients with a known cardiovascular disease compared to patients with suspected PAD.
From a practical point of view, the rooms were air-conditioned, but temperature regulation was not as strict as would be advised in a research study on microcirculation. Similarly, we did not ask the patients to refrain from smoking, consuming excessive amounts of alcohol or caffeine, doing strenuous exercise, or eating high-fat foods for 8 to 24 hours before the experiment. Neither did we leave them at rest for 20 minutes before the start of the experiment. We did not record blood pressure throughout the experiment to calculate conductance and we did not aim to (we could not) avoid noise coming from the corridor. We did not perform the experiments in a supine position after a 30-minute rest, but in a semi-recumbent armchair and within a few minutes of rest only. All these factors could be significant limitations for the study of microcirculation and potentially explain the fact that our results were not as promising as those previously reported with Laser Speckle. Nevertheless, we wanted to estimate feasibility in routine clinical practice and not under strict research conditions.
CIV appears as a clinical bedside approach to provide objective evidence of ASA intake. It remains to be studied whether or not CIV could be used in ASA adherence screening as a 1-time measurement, or as a way of systematically detecting non-adherence to ASA treatment during each visit in patients with a high risk of thrombotic events (arterial bypasses, atrial fibrillation, stroke, coronary angioplasties).
In conclusion, measuring vasodilation in response to segmented cathodal current application seems to be a straightforward way to confirm a clinical effect of low-dose ASA in patients at risk of cardiovascular disease. The inter-individual variability of observed responses is likely multifactorial in ASA-treated patients (i.e. adherence, comorbidities, true ASA resistance, etc.), but it includes the time since the last intake of the drug.
Footnotes
Authors’ Note
Work performed at Angers University Hospital, Angers, France. Ethics approval: CPP OUEST V RENNES 2017-A02528-45; NCT03357367.
Acknowledgments
The authors would like to thank Patrick Vandeputte, Marine Mauboussin, Stephanie Maréchal-Girault, Isabelle Mainfroid, and Anne Humeau-Heurtier for their technical help. The protocol was promoted and partly granted by Angers University Hospital. We would also like to thank Werfen loaning the Verifynow® device to us.
Author Contributions
J.H., P.R., O.F., and W.Y.S. contributed to collecting and analyzing data and to revising the content. P.A. and S.H. contributed to the concept and design as well as interpreting data and writing the article. All authors approved the final version of the manuscript.
Declaration of Conflicting Interests
The author(s) declared no potential conflicts of interest with respect to the research, authorship, and/or publication of this article.
Funding
The author(s) disclosed receipt of the following financial support for the research, authorship, and/or publication of this article: The intercommunal structure Angers Loire Metropole contributed to acquiring the TiVi device.