
Abstract
Introduction:
Tegaserod, an orally active, potent 5-hydroxytryptamine-4 serotonin receptor agonist, was previously indicated for irritable bowel syndrome but was voluntarily withdrawn due to potential cardiovascular side effects. In vitro studies suggested that tegaserod increased platelet aggregation, but these results were not reproduced or were inconclusive. We sought to assess ex vivo effects of tegaserod on platelet aggregation.
Methods:
In this double-blind, placebo-controlled, crossover study, we randomized a majority of healthy patients with no history of cardiovascular risk factors (n = 21) to receive tegaserod or matching placebo for 7 + 2 days followed by a 7- to 10-day washout period, and then patients were crossed over to the other study drug for the next 7 + 2 days. Unstimulated and agonist-stimulated platelet aggregation; P-selectin expression; serum thromboxane (Tx)B2 and urinary 11-dehydro (11-dh) TxB2; and tegaserod and M29.0 concentrations were serially assessed.
Results:
There was no significant difference in percentage change in unstimulated or adenosine diphosphate (ADP)- and ADP + serotonin-, collagen- and thrombin receptor activating peptide–induced maximum platelet aggregation and in platelet P-selectin expression in the presence of tegaserod at any time point when compared to placebo. Similarly, there was no significant difference in percentage change in serum TxB2 or urinary 11-dhTxB2 levels between placebo and tegaserod. No new or unexpected findings were observed in evaluations of safety or pharmacokinetic parameters.
Conclusion:
This comprehensive pharmacodynamic study, by employing established markers used in prior investigations, which have been considered by the Food and Drug Administration to indicate drug-related platelet effects, does not demonstrate any influence of tegaserod treatment on platelet function.
Introduction
Tegaserod maleate, an orally active 5-hydroxytryptamine-4 (5-HT4) serotonin receptor partial agonist, was developed for the treatment of functional motility disorders of the gastrointestinal tract. It was previously approved in the United States for irritable bowel syndrome with constipation (IBS-C) and chronic idiopathic constipation. 1 -3 A retrospective analysis of 29 placebo-controlled clinical studies across several gastrointestinal indications demonstrated that 13 of 11 614 patients treated with tegaserod had major adverse cardiovascular (CV) events (myocardial infraction, stroke, and unstable angina) when compared to only 1 of 7031 patients treated with placebo. 4 Based on these observations, tegaserod was voluntarily withdrawn from the market. However, subsequent studies found no evidence of occurrence of increased CV event associated with tegaserod compared to placebo. 5,6
Platelet activation and aggregation play pivotal roles in the occurrence of ischemic events in patients with CV disease. Therefore, studies were conducted to explore a potential direct effect of tegaserod on platelet function. In some, but not all in vitro studies, preincubation with tegaserod or its metabolite, M29, was reported to be associated with an increase in platelet aggregation in response to adenosine diphosphate (ADP) and serotonin plus ADP. 7 -10 However, concerns were raised about the validity of these studies since the results were not reproduced or were inconclusive. Thus far, there has been insufficient evidence to reliably indicate an effect of tegaserod on platelet function that may influence clinical outcomes.
In this first ex vivo clinical study, we have evaluated platelet activation and aggregation in patients taking tegaserod at the previously indicated dose (6 mg twice daily) or placebo. The primary objective of the study was to assess ex vivo effects of tegaserod on platelet aggregation induced by ADP and serotonin plus ADP. We also studied ex vivo effects of tegaserod on platelet aggregation induced by collagen and thrombin receptor activating peptide (TRAP) on unstimulated and ADP-stimulated P-selectin expression by flow cytometry and on serum thromboxane (Tx) B2 and urinary 11-dehydro (11-dh) TxB2 levels. Since this study began, tegaserod was subsequently approved on March 29, 2019, for reintroduction for the treatment of IBS-C in women younger than 65 years of age. 11
Methods
In this double-blind, placebo-controlled, randomized, crossover study, male and female patients with at least 1 CV risk factor, no history of CV ischemic disease, and aged 18 to 65 years were enrolled. Major exclusion criteria included patients taking anticoagulants, dietary supplements, ingredients, or other medications that may alter platelet function, antiplatelet agents, or any experimental medication within 30 days. Detailed inclusion and exclusion are presented in the Supplement A.
All procedures performed in this study involving human participants were in accordance with the ethical standards of the institutional and/or national research committee and with the 1964 Helsinki declaration and its later amendments or comparable ethical standards. Informed consent was obtained from all individual participants included in the study.
Study Design
Following the initial screening visit (visit 1), eligible patients were requested to stop any restricted medications listed in the exclusion criteria for up to 14 days. Eligible patients were then randomly assigned to receive tegaserod (6 mg) or placebo twice daily for 7 (+2) days (phase 1), followed by a 7- to 10-day washout period, and then patients were crossed over to the other agent for the next 7 + 2 days (phase 2). At each on-site study visit following the screening visit (visits 2, 3, and 4 [phase 1] and visits 5, 6, and 7 [phase 2]), patients arrived at the clinic in the morning after fasting overnight and took their first daily dose while on site. Blood samples for pharmacodynamic and pharmacokinetic analyses at visits 2, 4, 5, and 7 were collected at predose, 1 hour ± 5 minutes postdose, and 2 hours ± 5 minutes postdose and on visits 3 and 6 at 1 hour postdose. Urine samples were collected at predose on visits 2, 4, 5, and 7 (Figure 1). Assignment to treatment groups was based on the randomization schedule created by a biostatistician using a SAS program (SAS Version 9.4). Patients and the investigative staff were blinded to the sequence of each patient’s use of placebo and tegaserod in order to reduce bias.

Study flow diagram. PK indicates pharmacokinetics; TxB2, Thromboxane B2; u-11dh-TxB2, urinary 11-dehydro thromboxane B2.
In this study, we used established markers used in prior investigations that have been considered by the FDA to indicate drug-related platelet effects. These established markers include ADP-, collagen-, TRAP-, and ADP plus serotonin-induced platelet aggregation to indicate platelet reactivity, unstimulated and ADP-stimulated platelet P-selectin expression, and serum TxB2 and urinary 11-dh TxB2 to indicate platelet activation in response to tegaserod.
Laboratory Assays
Light Transmittance Aggregometry
Blood samples were collected from the antecubital vein into vacutainer tubes (Becton-Dickinson) containing 3.2% trisodium citrate for light transmittance aggregometry and flow cytometry measurements. Platelet-rich plasma (PRP) was prepared by centrifuging blood samples at 200g for 7 minutes at room temperature. 12 The PRP samples were checked for hemolysis using the Specimen Integrity Chart for Hemolysis. 13 If hemolysis ≥200 mg/dL was detected, the sample was rejected for evaluation of aggregation. Platelet-poor plasma (PPP) was prepared (using the blood tube previously for PRP) by centrifugation at 1800g for 10 minutes at room temperature. If the platelet concentration in the PRP met or exceeded 300 000 platelets per µL, the concentration was adjusted to a range of 200 000 to 250 000 platelets per µL using PPP from the same subject. The light transmittance aggregometry was performed according to standard procedures within 3 hours of blood collection. Briefly, platelets were stimulated with 5-μM ADP, 5-μM serotonin + 1-μM ADP, 4 µg/mL collagen, 10 μM/L TRAP, and phosphate-buffered saline (PBS) that served as vehicle to assess spontaneous aggregation. Aggregation was assessed using a Chronolog Lumi-Aggregometer (Model 490 4 + 4; Chrono-log Corporation) with the Aggrolink software package. The final extent of aggregation, measured at 6 minutes after agonist addition, and the maximal extent of aggregation were expressed as the percentage change in light transmittance from baseline, with PPP as a reference.
Expression of Platelet P-Selectin
Unstimulated and ADP-stimulated P-selectin expression was determined by whole blood flow cytometry (BD FACSCalibur 3-color Flow Cytometer) analysis using the following monoclonal antibodies: R-phycoerythrin-conjugated CD41a (recognizes the total GPIIb/IIIa receptor population), and phycoerythrin conjugated CD62p (recognizes P-selectin). All antibodies were obtained from BD Biosciences. 14 P-selectin was reported as percentage of positive cells based on the following formula:

Serum Thromboxane B2
Blood samples were collected for serum TxB2 in serum separator vacutainer tubes (Becton-Dickinson) without anticoagulant and incubated immediately at 37 °C for 1 hour. Serum was separated by centrifugation at 2000g for 10 minutes at 40 °C, stored at −70 °C, and shipped on dry ice to the Eicosanoid Core Laboratory at Vanderbilt University for analysis using gas chromatography–mass spectrometry. Percentage change in serum TxB2 was calculated using the following formula: Percent change in serum TxB2 (ng/mL) = [(TxB2 pre-dose − TxB2 post-dose)/TxB2 pre-dose] × 100%.
Urinary 11-Deydro Thromboxane B2
Urine samples were collected in sterile urine collection containers and were immediately stored at −70 °C. Urine aliquots were shipped on dry ice to Inflammatory Markers Laboratory for urinary 11-dh Tx B2 analysis using the AspirinWorks enzyme-linked immunoassay test kit as previously described. 15 Briefly, 100 µL of urine in assay buffer was incubated with mouse monoclonal antibody and 11-dh TxB2-alkaline phosphatase tracer in a competitive fashion. Urinary 11-dh TxB2 concentrations were determined by measuring color development at 405 nm with a Microplate reader and expressed as pictogram per milliliter. Final results were reported as picogram 1-dh TxB2 per milligram creatinine to normalize results for urine concentration.
Percentage change in urinary TxB2 metabolite was calculated using the following formula: Percentage change in urinary 11-dh TxB2 (pg/mg creatinine) = [(11-dh TxB2 pre-dose − 11-dh TxB2 post-dose)/11-dh TxB2 pre-dose] × 100%
Pharmacokinetic Analysis
Blood samples were collected in vacutainer tubes containing K2 EDTA (Becton-Dickinson) on ice. Plasma samples were immediately recovered by centrifugation at 2000g for 10 minutes at 4 °C and immediately stored at −70 °C. Plasma samples were shipped on dry ice in batches to Worldwide Clinical trials, Austin, Texas, for the measurement of tegaserod and its metabolite M29.
Adverse Events
Serious adverse event and treatment-emergent adverse events (TEAEs) were recorded during the study period.
Primary Outcomes
Primary outcomes were the percentage change from predose platelet aggregation (maximum and final) induced by 5-µM ADP and 5-µM serotonin + 1-µM ADP in patients treated with tegaserod and placebo at 7 to 9 days, at 1 hour ± 5 minutes postdose and percentage change from predose platelet activation as indicated by unstimulated and 5-µM ADP-stimulated platelet surface expression (% cells) of P selectin in patients treated with tegaserod and placebo at 7 to 9 days, at 1 hour ± 5 minutes postdose.
Secondary Outcomes
Secondary outcomes included percentage change from predose platelet aggregation (maximum and final) induced by collagen and TRAP at all post-dose time points; changes in serum TxB2 and urinary 11-dh TxB2 levels in patients treated with tegaserod and placebo at all post-dose time points; plasma concentrations of tegaserod and its major metabolite (M29.0) at times noted in the Study Design (Figure 1); platelet aggregation-induced by ADP and ADP + serotonin and unstimulated and ADP-stimulated platelet surface expression of P-selectin at times other than 1 hour postdosing on day 7 as described in the Study Design and percentage change in spontaneous aggregation (in response to PBS) in patients treated with tegaserod and placebo at all postdose time points.
Definition of Compliance
Patients’ drug compliance (eg, amount taken/amount expected to be used between visits) was based on pill counts assessed by the study site staff.
Statistical Analysis
The intent-to-treat (ITT) population was defined as all patients who received at least 1 dose of blinded study drug and had at least 1 post-baseline platelet aggregation assessment. The Per-protocol population included all ITT patients who had at least 1 platelet aggregation result on day 7 to 9 of each period without any important protocol deviations. The safety population was defined as all patients who received at least 1 dose of blinded study drug. The pharmacokinetics (PK) Population included all patients who were dosed and had sufficient concentration–time data to estimate the planned PK parameters.
For continuous variables, descriptive statistics (n, mean, SD, median, and minimum and maximum) were presented. For all parameters, baseline was defined as the pretreatment value prior to the administration of study drug within each treatment phase. For continuous variables, descriptive statistics (n, mean, SD or SEM) were presented. The intra- and intergroup comparisons were conducted using paired t test; if the normality assumption was not met, a nonparametric method (Wilcoxon signed-rank test) was used. P values < .05 were considered statistically significant. All statistical analyses were performed using SAS for Windows, version 9.4. A detailed Statistical plan is included in Supplement A.
Sample Size Determination
Enrollment of 20 pairs was estimated to provide 80% power to detect a clinically meaningful absolute difference of approximately 7% in ADP-induced aggregation in treatment success between the placebo group (81.5 ± 8.6) and the treatment group (88.5 ± 10.1), assuming a conservative within-subject correlation of 0.3, no patient loss to follow-up, and a 2-tailed α of .05. 16,17
Results
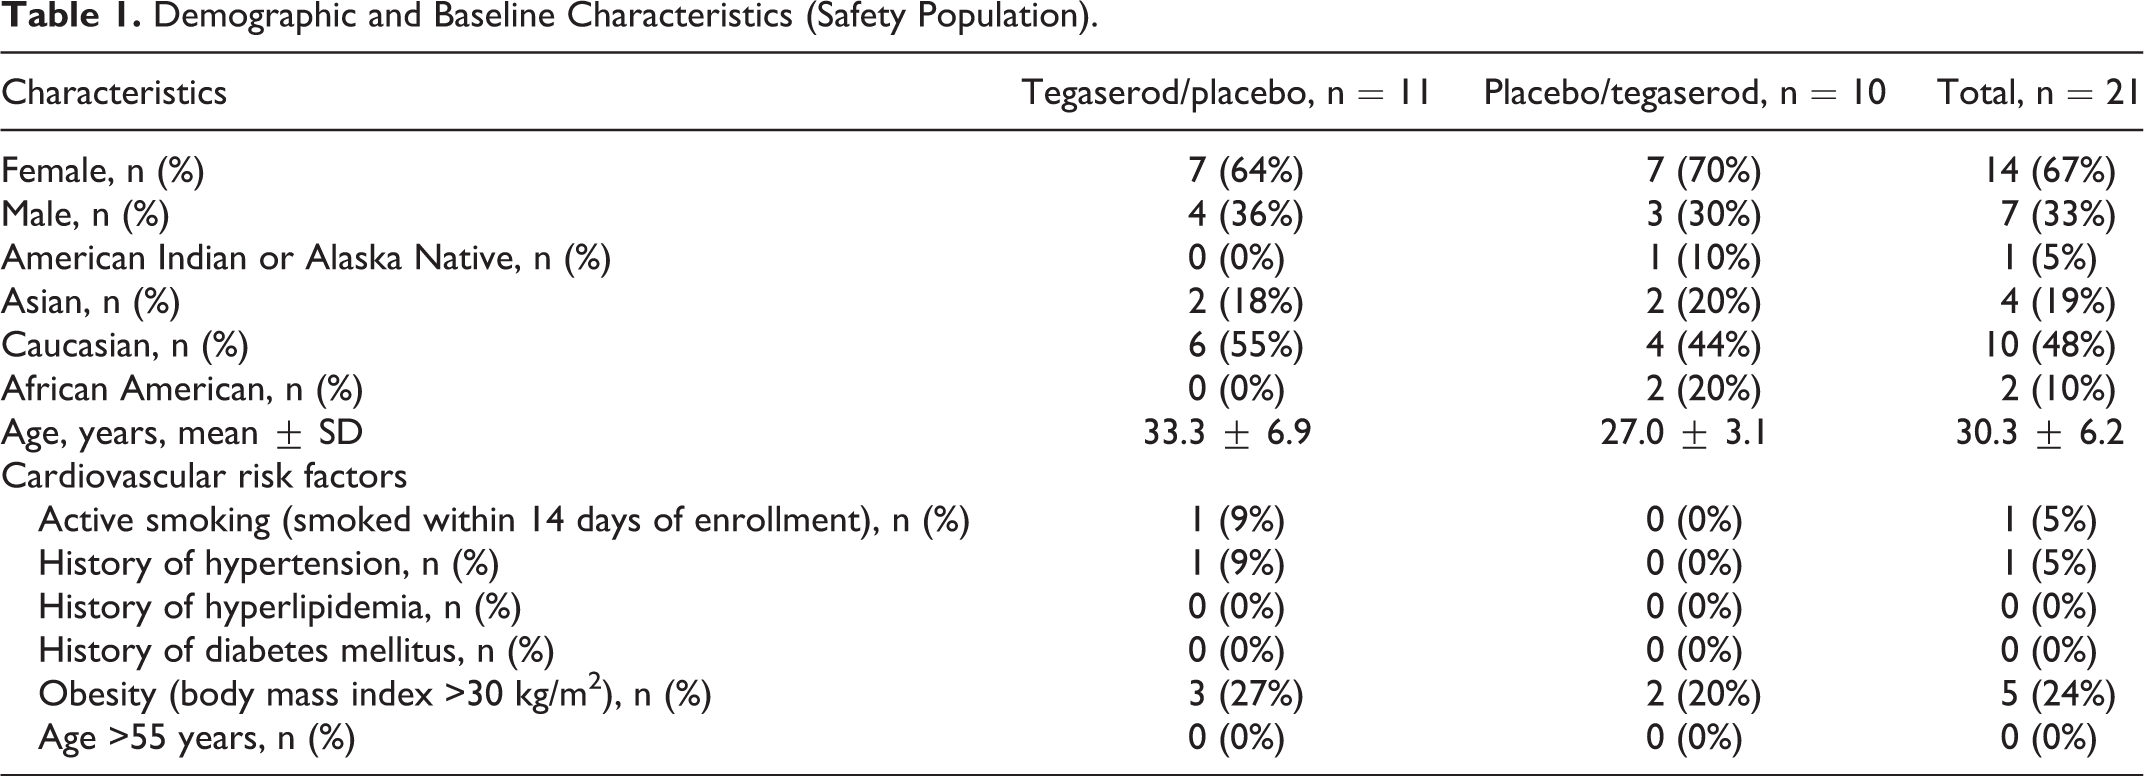
Baseline and demographic characteristics are presented in Table 1. Nearly two-thirds of the patients were female and one-half were Caucasians. Patients were 30.3 ± 6.2 years of age. In total, ∼30% of patients had at least 1 CV risk factor (Table 1). One patient discontinued early due to syncope. The patient received 1 dose of study drug (placebo) and syncope due to a vasovagal episode that occurred 2 hours later at the time of venipuncture. Compliance was 95% ± 7% and 100% ± 7% in phase 1 and 96% ± 9% and 98% ± 5% in tegaserod/placebo and placebo/tegaserod groups, respectively.
Demographic and Baseline Characteristics (Safety Population).
Primary Outcomes
Maximum and final platelet aggregation and platelet P-selectin expression in patients treated with tegaserod and placebo at predose and at 1 hour postdose on days 7 to 9 are presented in Table 2. There were no differences between tegaserod and placebo in change from baseline or percentage change from baseline in platelet aggregation (maximum or final) stimulated by 5-µM ADP or 5-µM serotonin + 1-µM ADP at 1 hour postdose on days 7 to 9 (Table 3).
Maximum and Final Platelet Aggregation and Platelet P-Selectin Expression in Subjected Treated With Tegaserod and Placebo.a
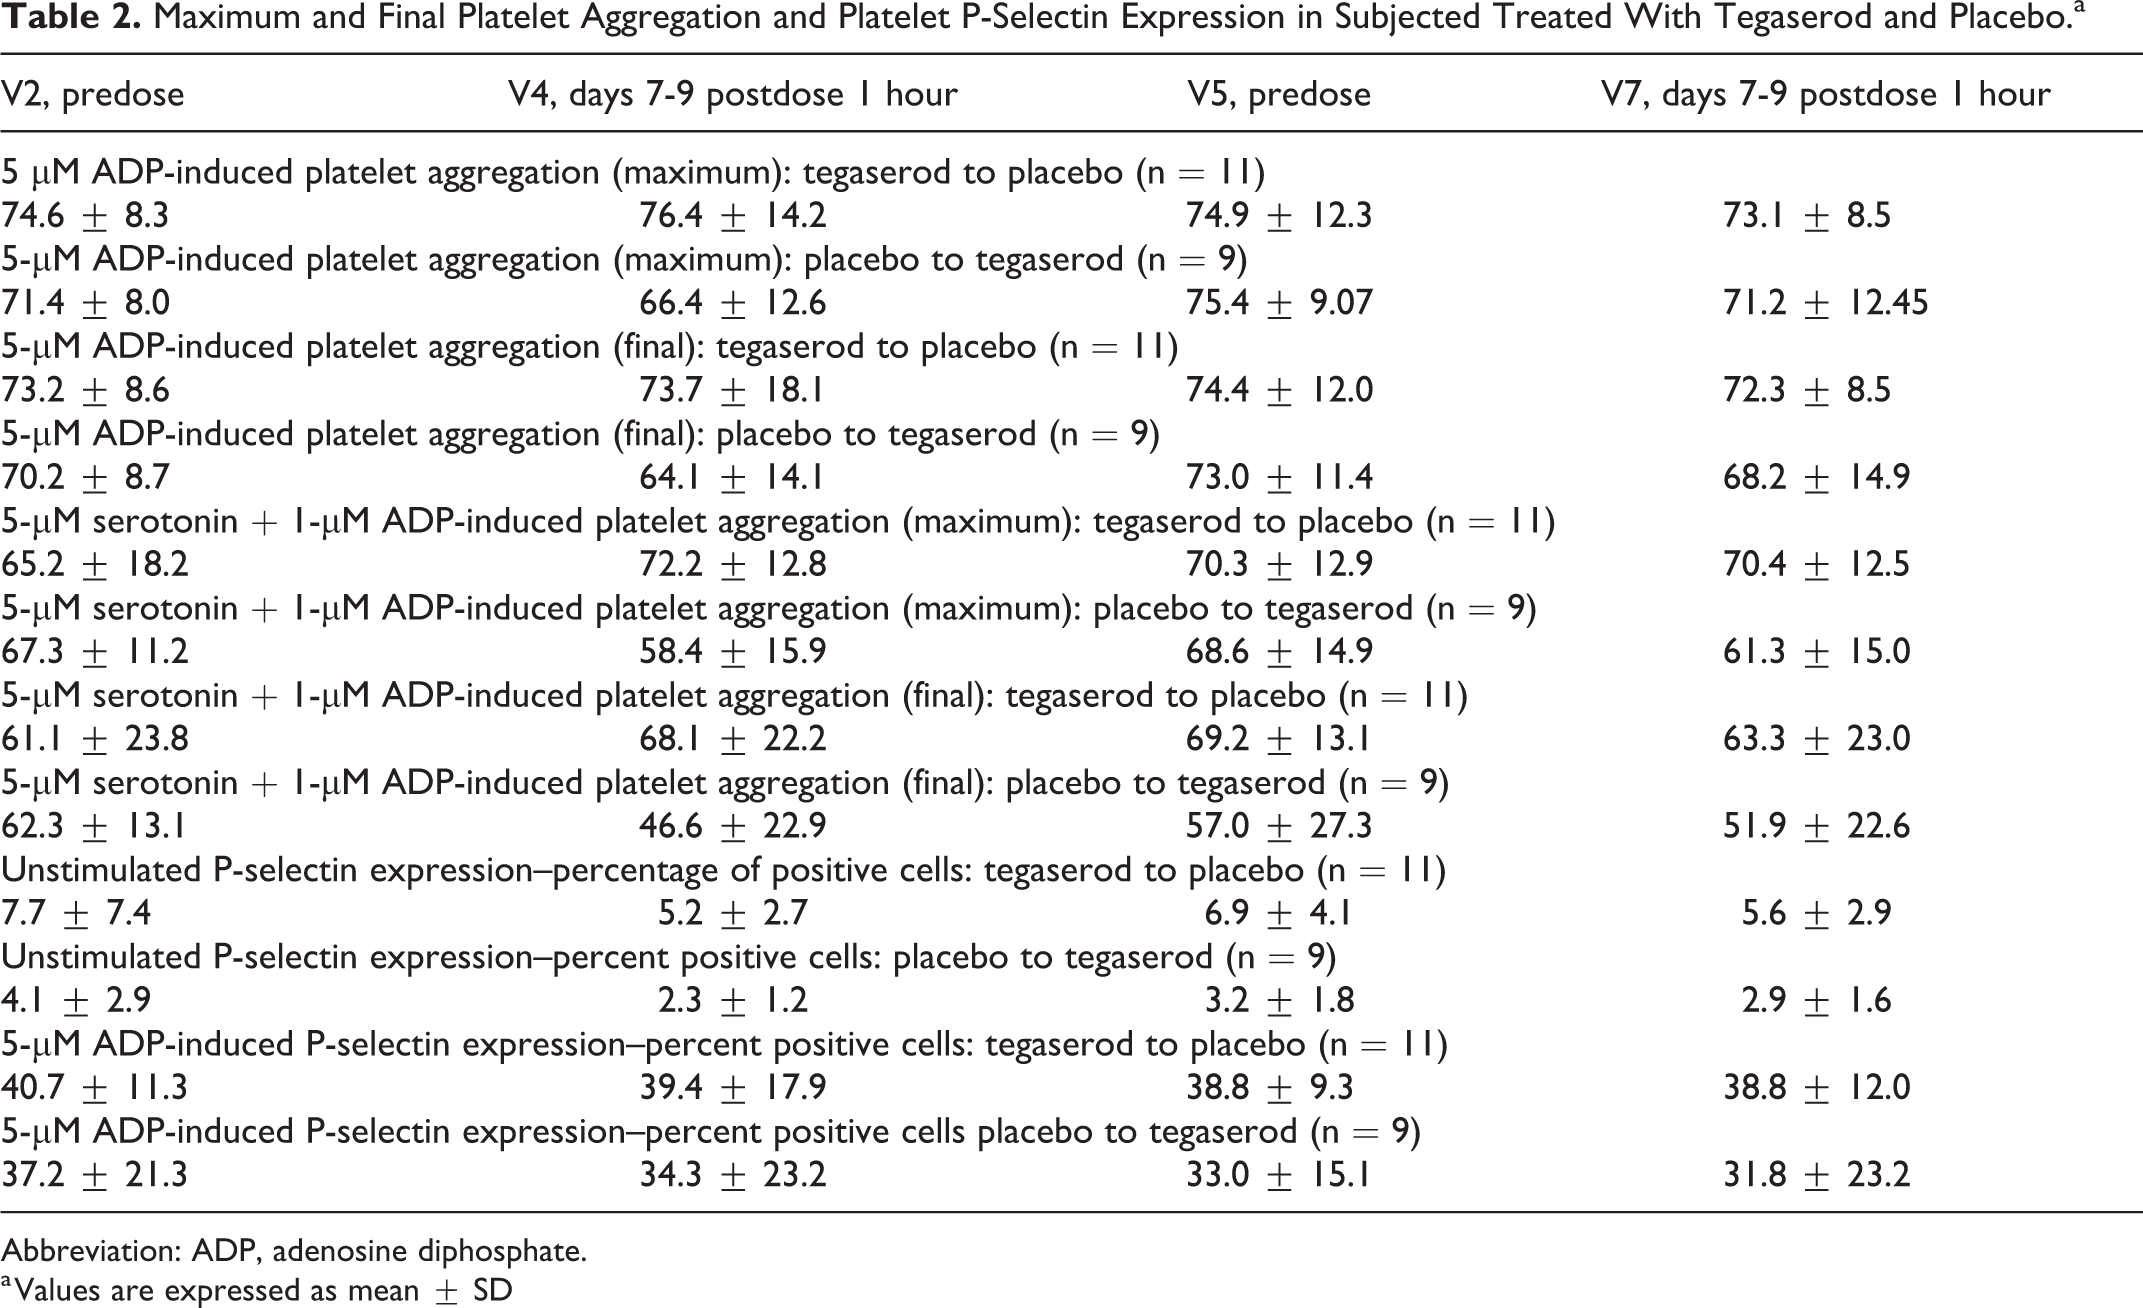
Abbreviation: ADP, adenosine diphosphate.
a Values are expressed as mean ± SD
LS Mean Differences in Platelet Aggregation and P-Selectin Values Between Baseline and 1-Hour Postdose After 7 to 9 Days in Patients Treated With Tegaserod and Placebo.a

Abbreviation: ADP, adenosine diphosphate.
a Values are expressed as mean ± SE.
There were no statistically significant differences between tegaserod and placebo in absolute change from baseline or percentage change from baseline in unstimulated and 5-µM ADP-stimulated platelet P-selectin expression at 1 hour postdose on days 7 to 9 (Table 3).
Platelet Aggregation
A 5-µM ADP-induced maximum and final platelet aggregation are presented graphically by phase in Figure 2. There were no statistically significant differences in maximum and final aggregation induced by 5-µM ADP at any time point when compared to baseline or between groups at any time point in the ITT (Supplement Table 1) and PP population.

A 5-µM ADP-induced maximum and final platelet aggregation in patients treated with tegaserod and placebo. ADP indicates adenosine diphosphate.
The 5-µM serotonin + 1-µM ADP-induced maximum and final platelet aggregation are presented graphically by phase in Figure 3. There were no statistically significant differences in maximum and final aggregation induced by 5-µM serotonin + 1-µM ADP-induced at any time point when compared to baseline or between groups at any time point in the ITT (Supplement Table 2) and PP population.

A 5-µM serotonin + 1-µM ADP-induced maximum and final platelet aggregation in patients treated with tegaserod and placebo. ADP indicates adenosine diphosphate.
Similarly, there were no statistically significant differences in maximum and final aggregation induced by 4 µg/mL collagen (Figure 4) or 10-µM TRAP (Figure 5) at any time point when compared to baseline or between groups at any time point in the ITT (Supplement Tables 3 and 4) and PP population.

A 4-µg/mL collagen-induced maximum and final platelet aggregation in patients treated with tegaserod and placebo.

A 10-µM thrombin receptor-activating peptide (TRAP)–induced maximum and final platelet aggregation in patients treated with tegaserod and placebo.
Expression of Platelet P-Selectin
Unstimulated and 5-µM ADP-stimulated P-selectin expressions are presented graphically by phase in Figure 6. There were no statistically significant differences between tegaserod and placebo except for 1 time point in the ITT (Supplement Table 5) and PP population: 1 hour postdose on day 1 for stimulated P-selectin (V2/V5). At that time point, a decrease in percentage change from baseline in platelet activation was observed with tegaserod, whereas a slight increase in percentage change from baseline was observed with placebo (difference in LS mean [SE] − 13.0 ± 5.6; P = .03).

Unstimulated and 5-µM ADP-stimulated P-selectin expression in patients treated with tegaserod and placebo.
Serum Thromboxane B2
Serum TxB2 values are presented graphically by phase in Figure 7. A statistically significant difference in serum TxB2 values was observed between tegaserod and placebo in change from baseline and at 1 hour postdose on day 7 (difference in LS mean [SE] =15.3 ± 4.55; P = .004) and from baseline and at 2 hours postdose on day 7 (difference in LS mean [SE] = 11.1 ± 5.04; P = .042) but not at other time points; however, the difference between tegaserod and placebo in percentage change from baseline was not statistically significant (P = .13 and .17, respectively; percentage change was the prespecified end point; Supplement Table 6).
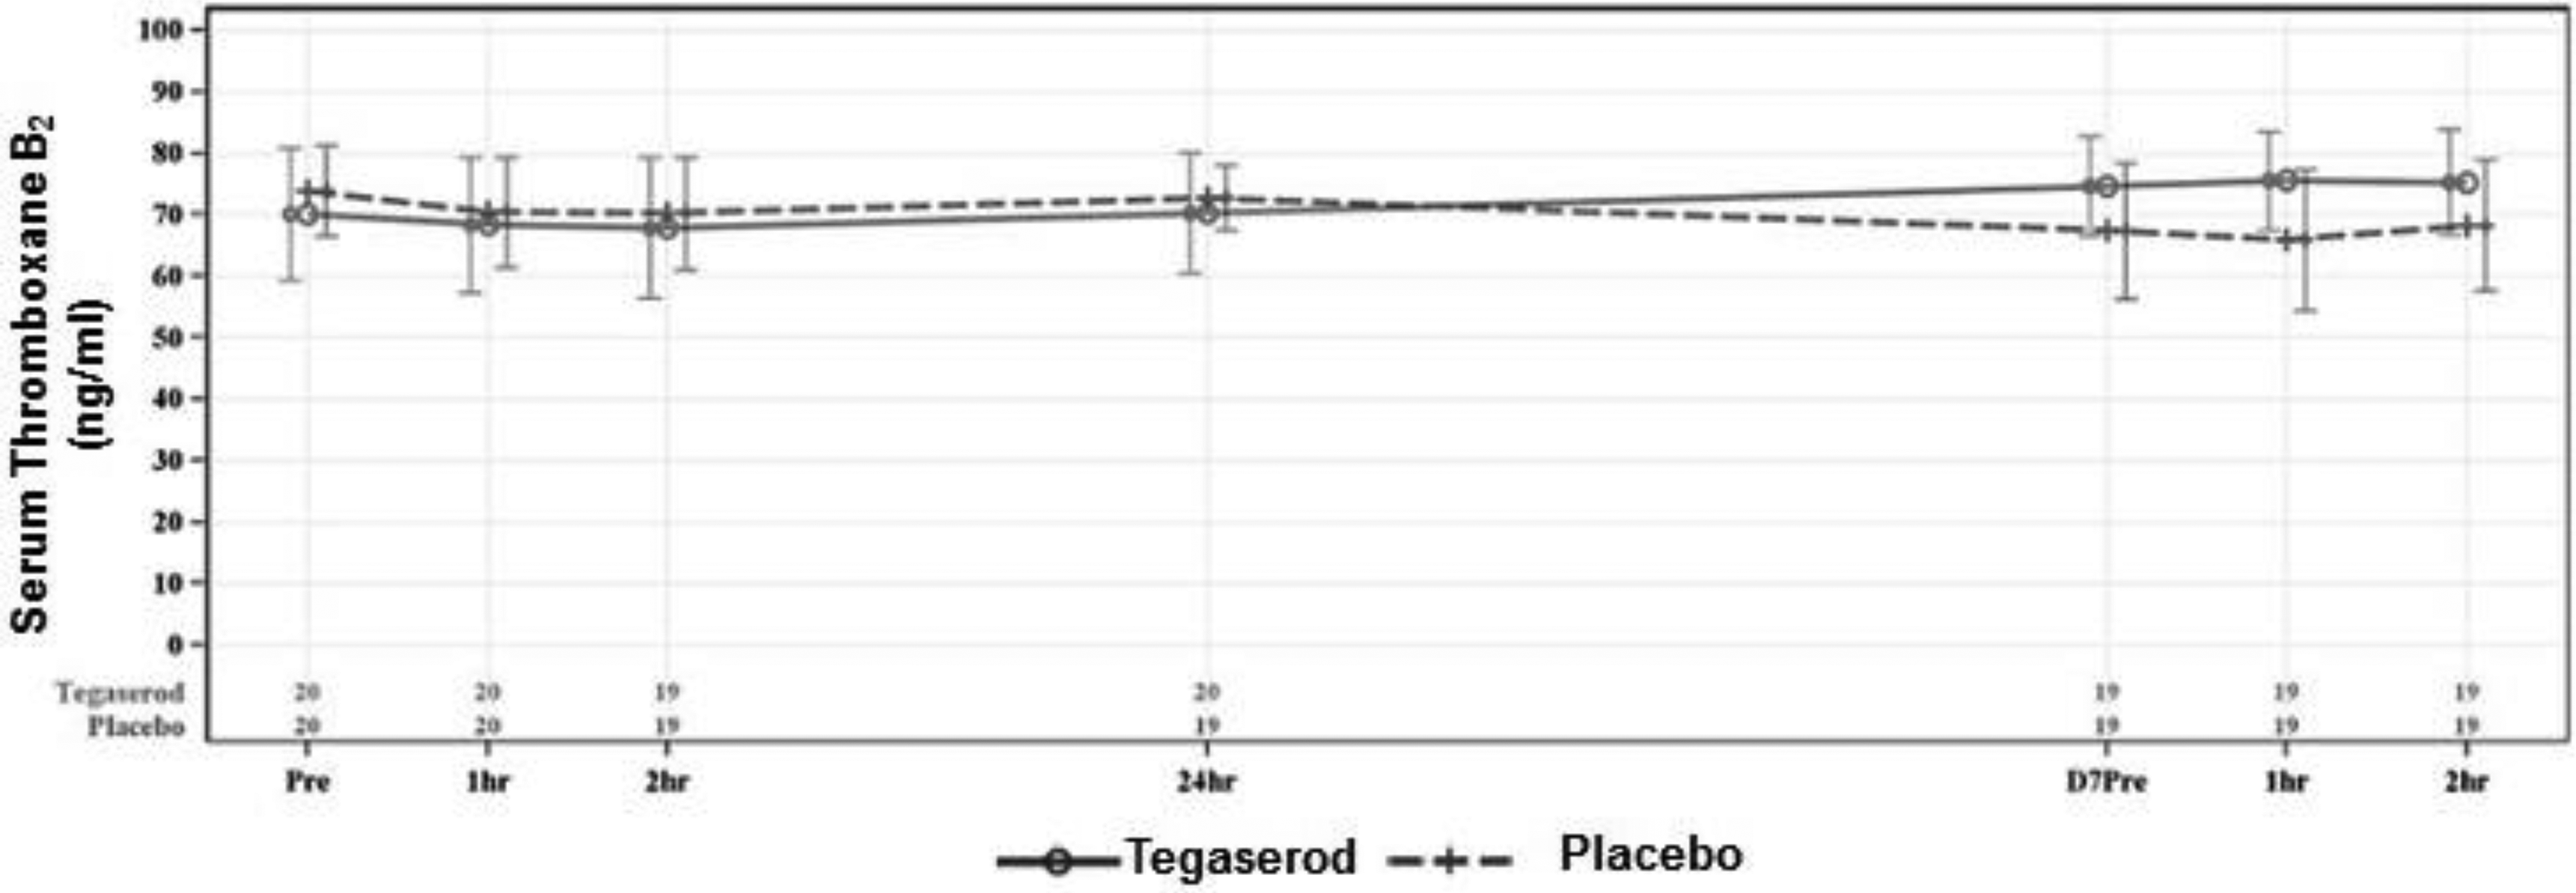
Serum thromboxane B2 levels in patients treated with tegaserod and placebo.
Urinary 11-Dehydro-Thromboxane B2
Urinary 11-dehydro-TxB2 values are presented graphically in Figure 8. There were no statistically significant differences between tegaserod and placebo in change from baseline or percentage change from baseline in urinary 11 dh TxB2 values on days 7 to 9 (Supplement Table 6).
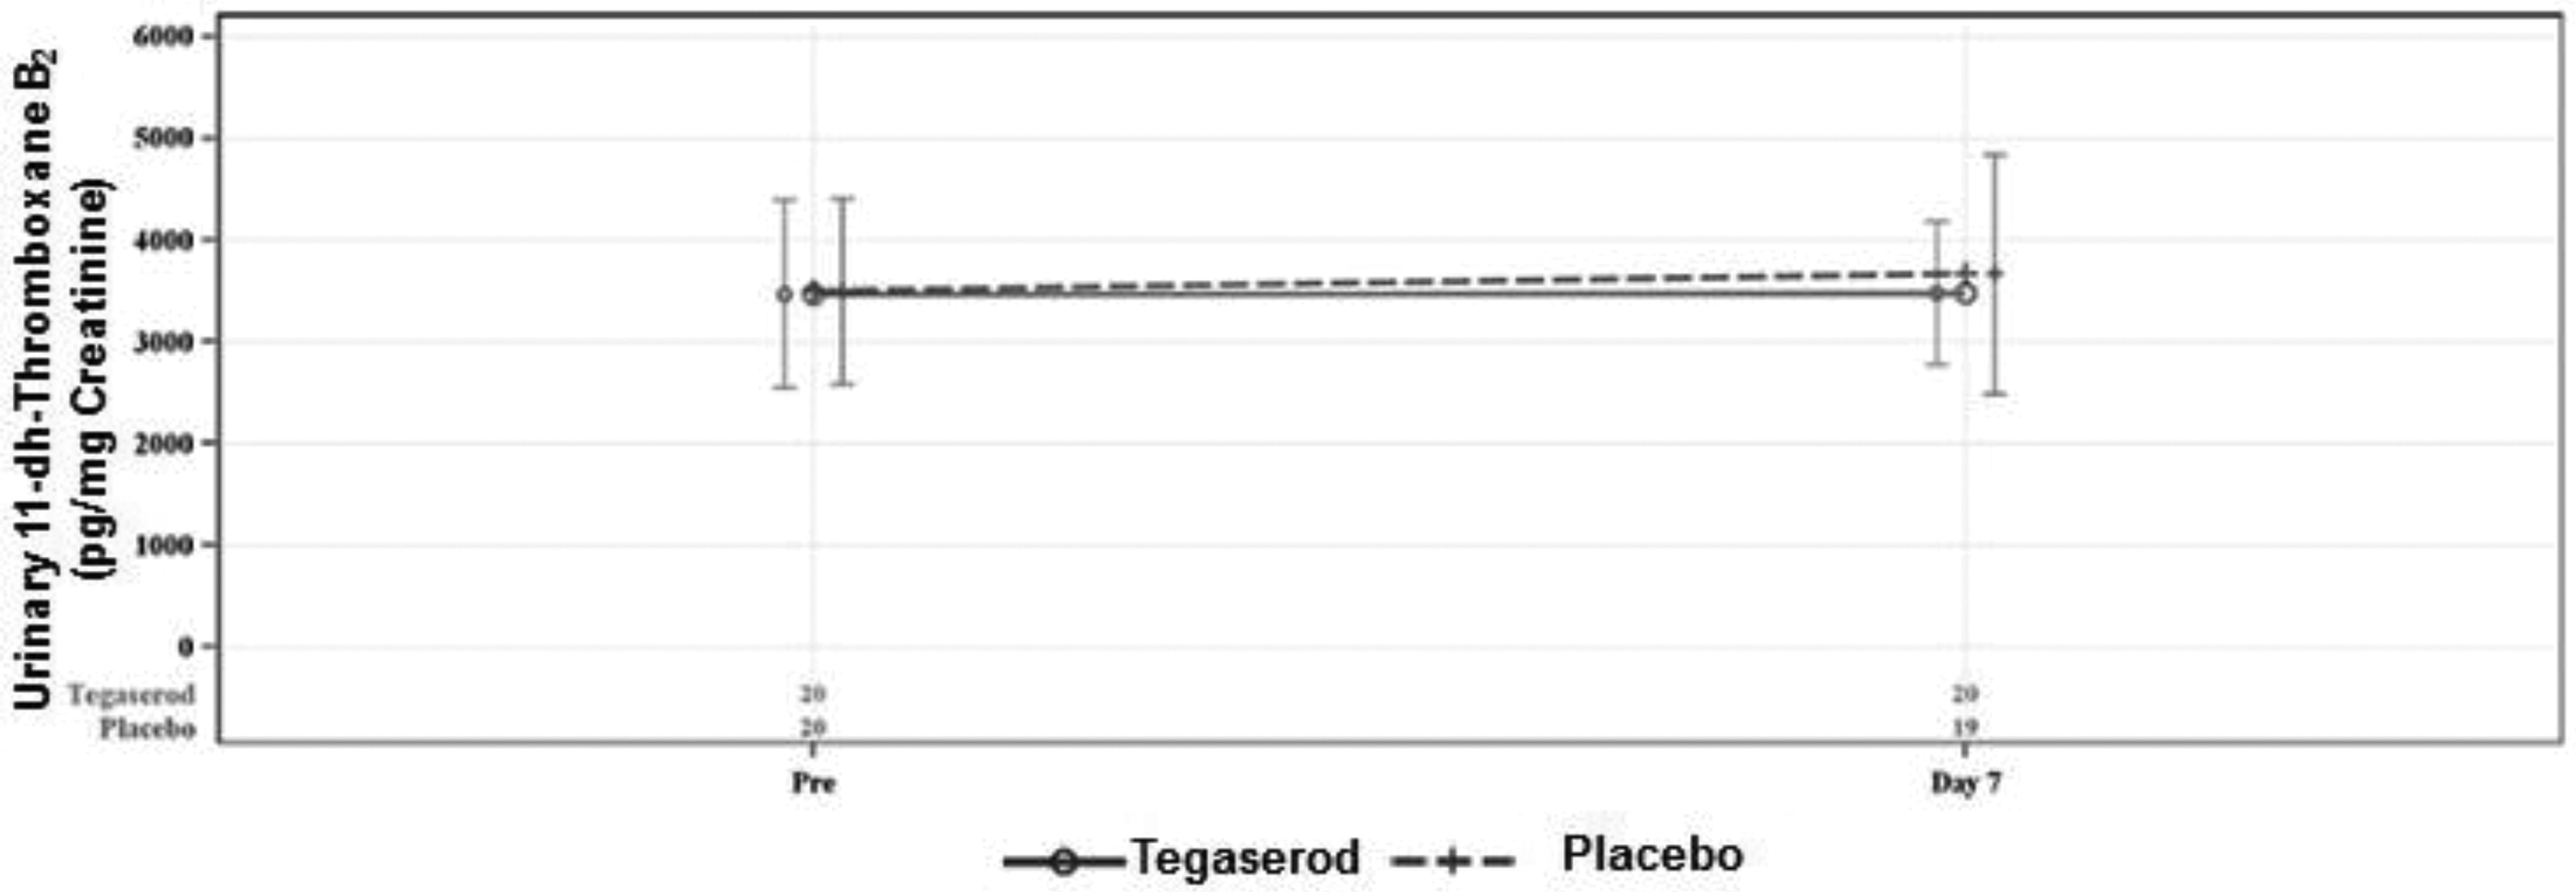
Urinary 11-dehyro thromboxane B2 levels in patients treated with tegaserod and placebo.
Spontaneous Platelet Aggregation
There were no statistically significant differences between tegaserod and placebo in change from baseline or percentage change from baseline in spontaneous platelet aggregation (maximum or final; when the sample was exposed to PBS; Supplement Table 7)
Pharmacokinetics Measurements
Mean tegaserod and M29.0 concentrations at 1 hour and 2 hours postdose were similar to each other, suggesting the peak concentrations generally occurred in the intervening time interval as expected. Mean tegaserod concentrations at matched times were similar on days 1 and 7, consistent with the expected limited accumulation of tegaserod with twice daily repeated dosing.
Mean M29.0 concentrations at matched times were slightly lower on day 7 compared to day 1, although the high coefficients of variation (>75%) and the Box and Whisker plots indicate substantial overlap in the day 1 and day 7 distributions (Figure 9

Tegaserod and M29.0 concentrations in patients treated with tegaserod dash line = median; solid line = average; box = upper and lower quartiles; whiskers = 5% and 95% percentiles; circle = Outlier (>1.5 × interquartile range from Q1 or Q3).
Adverse Events
An overview of TEAEs is presented by treatment in Table 4. Nineteen subjects reported at least 1 TEAE overall. No serious or severe TEAEs were reported. The incidence of patients reporting TEAEs was greater during treatment with tegaserod than with placebo (76.2% vs 24%). One patient had a TEAE leading to discontinuation (syncope in a patient exposed to placebo). As expected, the majority of TEAEs were gastrointestinal events. The most common TEAEs during treatment with tegaserod were diarrhea (76%) and abdominal pain (14.3%). Most events were mild. No serious or severe TEAEs were reported. Mean changes in hematology laboratory from baseline were generally small and similar between phases and treatments (data not shown). Mean changes from baseline in diastolic blood pressure, systolic blood pressure, and heart rate were generally small and similar between phases and treatments (data not shown).
Overview of Adverse Events (Safety Population).
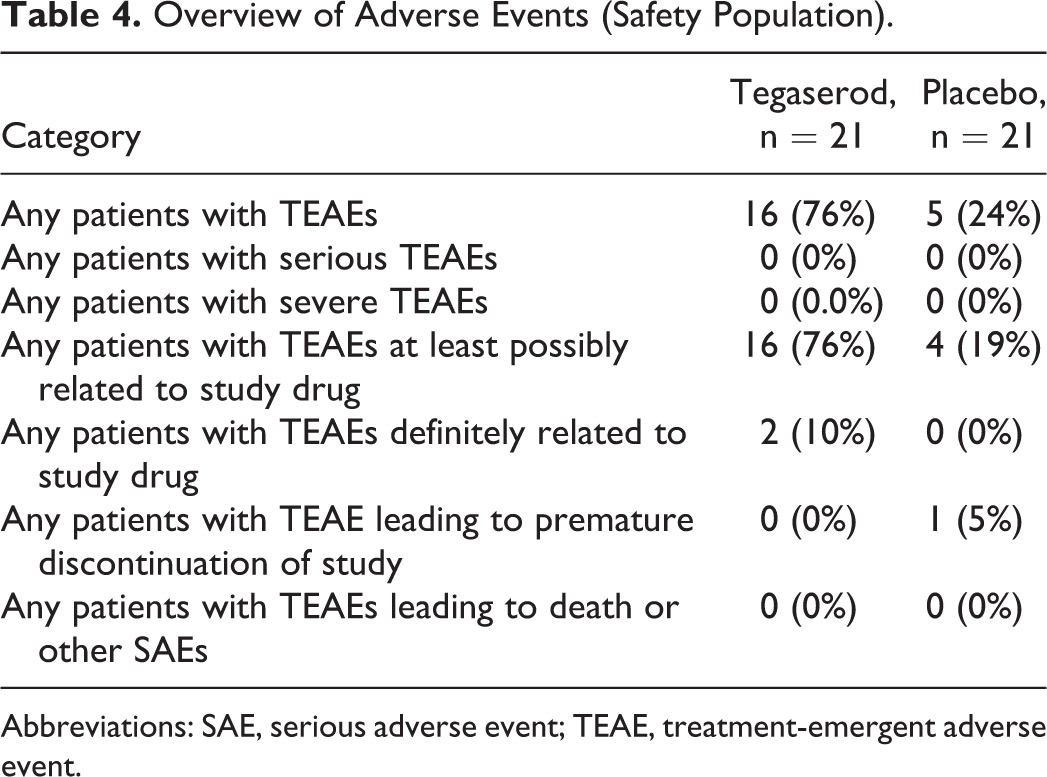
Abbreviations: SAE, serious adverse event; TEAE, treatment-emergent adverse event.
Discussion
This first comprehensive ex vivo pharmacodynamic and PK study clearly demonstrated that tegaserod administration compared to placebo was not associated with an increase in agonist-induced platelet aggregation. There was no significant difference between tegaserod and placebo in percentage change from baseline at any time point in either ADP- or ADP + serotonin-induced platelet aggregation. Similarly, tegaserod compared to placebo was not associated with a significant increase in platelet aggregation induced by collagen or TRAP at any time point. Moreover, there was no evidence of a tegaserod effect on platelet activation; both unstimulated- and ADP-stimulated platelet P-selectin expression levels did not differ from placebo. Finally, there were no significant differences in serum TxB2 and urinary 11-dh TxB2 levels between tegaserod and placebo. There were no new or unexpected findings observed in evaluations of safety or PK parameters.
Following the voluntary withdrawal of tegaserod due to potential CV side effects, in vitro studies were conducted to demonstrate the potential influence of tegaserod or its main metabolite on platelet aggregation. In the first in vitro study, blood samples from 20 healthy volunteers were incubated with different concentrations of tegaserod at room temperature for 1 hour, and agonist-induced platelet aggregation was assessed in PRP samples. The investigators reported a small but statistically significant concentration-dependent effect of tegaserod on ADP-, collagen-, epinephrine-, and serotonin + ADP-induced platelet aggregation. In this study, whole blood was centrifuged at 1200g for 5 minutes (compared to the standard procedure of ∼ 150-200 g for 10 minutes) to recover PRP and the platelet count was adjusted to 350 000/µL with PPP (when compared to the Clinical and Laboratory Standards Institute standard of 200 000-250 000/µL). 7,18 In a subsequent in vitro study, blood samples from 10 healthy controls were centrifuged at both 150g for 10 minutes and 1200g for 5 minutes to recover PRP. Aggregation was performed with PRP at a concentration of 350 000 platelets/µL and also at more standard concentration of 250 000 platelets/μL. Unlike the previous study, preincubation of tegaserod at different concentrations for 1 hour at room temperature was not associated with a significant overall increase in platelet aggregation in PRP samples induced by ADP and ADP + serotonin. The positive control, thrombopoietin, but not tegaserod, demonstrated a statistically significant increase in platelet aggregation. 8 In the third in vitro study of 12 healthy volunteers, preincubation of 100-nM tegaserod with PRP (adjusted to 250 000/µL) at room temperature for 1 hour was not associated with any change in ADP-induced or serotonin + ADP-induced platelet aggregation, whereas thrombopoietin at 500 U/mL was associated with a significant increase in platelet aggregation. 9
The Sponsor (US World Medicals) initiated discussions with the Food and Drug Administration (FDA) regarding the reintroduction of tegaserod in 2016 and the sponsor subsequently conducted an in vitro study to explore the potential influence of M29.0 on platelet aggregation in healthy volunteers. In this study, PRP was adjusted to 250 000 ± 50 000/µL platelets and incubated with vehicle, M29.0 (active metabolite of tegaserod), and thrombopoietin for 15 minutes at room temperature. Subsequently, platelet aggregation was assessed in response to ADP, collagen, epinephrine, TRAP, and serotonin + ADP, EDTA plus saline (vehicle). In addition, platelet factor 4 antigen concentrations in cell-free plasma were analyzed to test whether platelets were activated during isolation. This study showed that M29.0 was associated with an increase in platelet aggregation in response to ADP and serotonin + ADP but not in response to collagen and TRAP. A retrospective review of the data and laboratory procedures identified several limitations to the study. Preincubation results showed very high basal platelet aggregation with vehicle control, minimal additive effects of various platelet agonists, and high platelet factor 4 levels. The study was deemed inconclusive and therefore was unable to demonstrate reliably whether M29.0 affected platelet aggregation (10, data on file).
The current ex vivo study was conducted in discussion with the FDA. In this study, whole blood was centrifuged at 200g for 7 minutes and platelet counts were adjusted to 200 000 to 250 000/µL using PPP if the platelet concentration in the PRP met or exceeded 300 000/µL. In addition, platelet activation was assessed by spontaneous platelet aggregation with PBS (vehicle), serum TxB2, and urinary 11-dh TxB2 levels and most importantly platelet P-selectin expression. In the current study, there were no significant differences in change from baseline at any time point in any agonist-stimulated platelet aggregation during tegaserod administration compared to placebo. Some within-subject variability was observed in final platelet aggregation when tested with 5-µM serotonin + 1-µM ADP agonist at certain time points. This occurred in 5 patients during both tegaserod and placebo treatment phases, suggesting that the observed variation was unrelated to the study drug. The variability may be due to partial reversal of stimulated platelet aggregation with the passage of time beyond the point where the maximum platelet aggregation was observed, that is, variability in the final aggregation. Since the final aggregation levels were at a low range, this level of variability is expected.
With respect to pharmacokinetic evaluation, interpretation of the PK parameters should be done with caution. Samples were not collected with sufficient frequency to fully describe the tegaserod or M29.0 concentration–time profiles. As expected, there was no PK evidence of significant drug accumulation between day 1 and day 7 in terms of mean observed concentrations. The 5-µM ADP, we have used in this study to induce platelet aggregation was chosen because of its ability to sort out thrombotic risk in patients with high-risk CAD on P2Y12 inhibitor therapy. It may have limited our ability to identify the effects of tegaserod on platelet function as measured by turbidimetric aggregation. However, we could not identify any effects of tegaserod on platelet activation using flow cytometry, a more sensitive marker than aggregation to identify effects on platelet physiology. We did not include a positive control to demonstrate enhanced platelet aggregation in addition to 5-µM serotonin plus 1-µM ADP-induced aggregation.
In conclusion, the totality of the evidence from this comprehensive PD study, employing established markers used in prior investigations that have been considered by the FDA to indicate drug-related effects, does not demonstrate any clinically significant influence of tegaserod treatment on platelet function. No new or unexpected findings were observed in evaluations of safety or PK parameters.
Supplemental Material
Supplemental Material, Tegaserod_MS-supplement - An Ex Vivo Study to Evaluate the Effect of Tegaserod on Platelet Activation and Aggregation
Supplemental Material, Tegaserod_MS-supplement for An Ex Vivo Study to Evaluate the Effect of Tegaserod on Platelet Activation and Aggregation by Paul A. Gurbel, Kevin Bliden, Scott D. Barnett, Casey Witt, Heng Zou and Udaya Tantry in Journal of Cardiovascular Pharmacology and Therapeutics
Footnotes
Author Contributions
Paul Gurbel contributed to conceptualization, funding acquisition, investigation, and writing-review and editing. Kevin Bliden contributed to conceptualization, data curation, formal analysis, and roles/writing-original draft. Scott D. Barnett contributed to data acquisition, statistical analysis, and editing. Casey Witt contributed to conceptualization, funding, reviewing, and editing. Heng Zo contributed to data curation, reviewing, and editing. Udaya Tantry contributed to conceptualization, data curation, and writing-review and editing.
Declaration of Conflicting Interests
The author(s) declared the following potential conflicts of interest with respect to the research, authorship, and/or publication of this article: Dr. Gurbel reports grants from National Institue of Health, Bayer, Medicure, Instrumentation Labs, US WorldMeds, Haemonetics, Amgen, Idorsis, Ionis, Janssen, Merck, receiving personal fees from Bayer, Merck, UPToDate, Medicure, US WorldMeds, during the conduct of the study; In addition, Dr. Gurbel has a patent in the area of personalized antiplatelet therapy and interventional cardiology issued. Dr. Tantry reports receiving personal fees from UPToDate and Astra Zeneca. Casey Witt, Heng Zou are employees of WorldMeds, LLC.
Funding
The author(s) disclosed receipt of the following financial support for the research, authorship, and/or publication of this article: This study was funded by US WorldMeds, LLC, Louisville, KY, USA (grant number ZN-1001). Alfasigma LLC, Bedminster, NJ, USA acquired ZELNORMTM (tegaserod) in the USA in July 2019.
Supplemental Material
Supplemental material for this article is available online.
References
Supplementary Material
Please find the following supplemental material available below.
For Open Access articles published under a Creative Commons License, all supplemental material carries the same license as the article it is associated with.
For non-Open Access articles published, all supplemental material carries a non-exclusive license, and permission requests for re-use of supplemental material or any part of supplemental material shall be sent directly to the copyright owner as specified in the copyright notice associated with the article.