
Abstract
Background:
Synthetic forms of glucocorticoids (GCs; eg, prednisone, prednisolone) are anti-inflammatory drugs that are widely used in clinical practice. The role of GCs in cardiovascular diseases, including atherosclerosis, is highly controversial, and their impact on macrophage foam cell formation is still unknown. We investigated the effects of prednisone and prednisolone on macrophage oxidative stress and lipid metabolism.
Methods and Results:
C57BL/6 mice were intraperitoneally injected with prednisone or prednisolone (5 mg/kg) for 4 weeks, followed by lipid metabolism analyses in the aorta and peritoneal macrophages. We also analyzed the effect of serum samples obtained from 9 healthy human volunteers before and after oral administration of prednisone (20 mg for 5 days) on J774A.1 macrophage atherogenicity. Finally, J774A.1 macrophages, human monocyte-derived macrophages, and fibroblasts were incubated with increasing concentrations (0-200 ng/mL) of prednisone or prednisolone, followed by determination of cellular oxidative status, and triglyceride and cholesterol metabolism. Prednisone and prednisolone treatment resulted in a significant reduction in triglyceride and cholesterol accumulation in macrophages, as observed in vivo, ex vivo, and in vitro. These effects were associated with GCs’ inhibitory effect on triglyceride- and cholesterol-biosynthesis rates, through downregulation of diacylglycerol acyltransferase 1 and HMG-CoA reductase expression. Glucocorticoid-induced reduction of cellular lipid accumulation was mediated by the GC receptors on the macrophages, because the GC-receptor antagonist (RU486) abolished these effects. In fibroblasts, unlike macrophages, GCs showed no effects.
Conclusion:
Prednisone and prednisolone exhibit antiatherogenic activity by protecting macrophages from lipid accumulation and foam cell formation.
Introduction
Glucocorticoids (GCs) are a class of endogenous steroid hormones produced by the adrenal glands and controlled by the hypothalamic–pituitary–adrenal axis. 1 One mechanism for their action is to bind to a class of cytosolic steroid hormone receptors termed GC receptors. The formed ligand–receptor complex is a transcription factor involved in anti-inflammatory gene activation or in repression of pro-inflammatory products. 2 Synthetic forms of GCs (eg, prednisone and prednisolone) are widely used in clinical practice to treat patients with inflammatory and autoimmune diseases. Prednisone is an inactive prodrug that is converted in the liver by 11-hydroxylation into the active drug prednisolone. 3,4
Atherosclerosis is an inflammatory disease of the arteries, and macrophages play a key role during early atherogenesis. 5 Macrophages take up modified lipoproteins, such as oxidized low-density lipoproteins (Ox-LDLs), at an enhanced rate, which are then converted into lipid-rich foam cells. 6 Macrophages in the atherosclerotic plaque contain both cholesterol and triglycerides. 7 In addition to lipoprotein uptake, the conversion of macrophages into lipid-rich foam cells can also result from alterations in cellular cholesterol or triglyceride metabolism, for example, enhanced rate of lipid biosynthesis or attenuated lipid efflux from the cells. 8
Since inflammation is involved in the early development of atherosclerotic lesions, and since synthetic GCs possess anti-inflammatory properties, it was hypothesized that this class of drugs might inhibit early atherosclerotic plaque development and therefore lower the incidence of cardiovascular disease (CVD) events. 9 Studies in this field are inconclusive, as some reports have shown that GCs promote the incidence and progression of atherogenesis and CVD, 9 –11 while others show antiatherogenic effects mediated by their anti-inflammatory properties 12 –17 or no additive proatherogenic effect. 18 –20
The GC receptors are expressed in various tissues and cells, including macrophages. 21 Glucocorticoids altered the expression of some pro- and anti-inflammatory genes in macrophages 22 and induced phagocytosis of apoptotic cells. 23 The treatment of GC reduced macrophage accumulation in a model of cholesterol-induced atherosclerosis 24 and prevented neointimal proliferation in a rat model of balloon angioplasty. 25
Since GCs’ effect on macrophage atherogenicity is not yet well established, 26 –28 here we analyzed the effects of prednisone or prednisolone on macrophage oxidative stress and on triglyceride and cholesterol metabolism and elucidated the underlying mechanisms.
Materials and Methods
In Vivo Study in C57BL/6 Mice Treated With Prednisone or Prednisolone
This study was carried out in accordance with the Guide for the Care and Use of Laboratory Animals of the National Institutes of Health. The study protocol was approved by the Committee for Supervision of Animal Experiments of the Technion—Israel Institute of Technology (approval number: IL0860717). Eighteen 7-week-old C57BL/6 male mice were purchased from Envigo, Israel. Mice were bred and housed at the animal care facility of the Rappaport Faculty of Medicine, Technion, and fed with a regular standard chow diet. After 1 week, the mice were randomly divided into 3 treatments groups: placebo, prednisone, or prednisolone. The mice were intraperitoneally injected (5 mg/kg, 3 times weekly) for a period of 4 weeks. On day 28, the mice were sacrificed, and blood samples, aortas, and mouse peritoneal macrophages (MPMs) were obtained.
Mouse Blood Serum Assays
After isoflurane anesthesia, blood samples were collected from the mouse retro-orbital plexus and centrifuged; following serum separation, serum cholesterol, triglycerides, and glucose were measured using commercially available kits. Serum peroxidation was assessed by the lipid peroxide assay. 29
Mouse Aorta Analyses
The aorta was carefully dissected and separated from connective and adherent tissues. It was homogenized using a Polytron Homogenizer (Kinematica AG, Littau, Switzerland) and centrifuged. The supernatant was analyzed for aortic lipid content by lipid extraction (hexane:isopropanol), followed by hexane evaporation and measurement of aortic cholesterol and triglycerides levels (described further on). Aortic lipid peroxidation was measured by lipid peroxide assay. 29 Protein levels were analyzed by Lowry assay. 30
Mouse Peritoneal Macrophage Isolation
Mice were injected with 3 mL of Brewer’s thioglycollate broth (40 g/L) 3 days before sacrifice. Mouse peritoneal macrophages were harvested from the peritoneal fluid of the euthanized mice. The cells were washed with phosphate-buffered saline (PBS), centrifuged, and plated in Dulbecco’s modified Eagle medium (DMEM) containing 1000 U/L penicillin, 100 mg/L streptomycin, and 5% (vol/vol) heat-inactivated fetal calf serum (FCS). After 2 hours, nonadherent cells were washed away and the remaining cells in the culture were 90% macrophages (determined microscopically). After 2 days of incubation, assays for triglyceride and cholesterol metabolism were conducted as described further on.
Ex Vivo Study in Humans Treated With Oral Prednisone
A randomized interventional study was conducted in accordance with the Declaration of the Helsinki Committee (number 0254-17-RMB). Nine healthy male volunteers were recruited at Rambam Health Care Campus. Volunteers were screened for eligibility after signing a written informed consent. Inclusion criteria were healthy male patients and age range 20 to 45 years. Exclusion criteria were cigarette smoking, consumption of more than 2 alcoholic drinks per day, hypertension, diabetes mellitus, body mass index (BMI) >30, dyslipidemia, any cardiac or pulmonary disorders, liver disorders, autoimmune disease, inflammatory bowel disease, or acute infection in the previous 14 days. Patients were instructed to continue with their regular daytime activities and dietary habits. Each recruited patient was asked to fast for 12 hours before each visit (on days 1 and 6).
Blood samples were taken before the treatment (day 1). Volunteers were administered one 20 mg oral prednisone tablet per day, for 5 days. The patients were asked to take the treatment each day in the morning, and another set of blood samples was drawn on day 6, after 12 hours fasting. Serum was separated by centrifugation and kept at −20°C.
Body mass index was measured before and after treatment. Blood samples were analyzed for fasting glucose, electrolyte, C-reactive protein and fasting insulin levels, insulin sensitivity index, and triglyceride and cholesterol levels. Oxidative status, paraoxonase 1 (PON1) activity, and thiol (SH) group levels were also examined.
All 9 recruited participants followed the prednisone treatment instructions and were included in the study. No side effects were reported by the patients. Volunteers were all healthy males, age range 18 to 33 years, nonobese (mean BMI 24.1 [0.4]), and nonsmokers.
Studies in J744A1 Macrophages Incubated With Human Serum
Murine macrophage cell line J774A.1 was purchased from the American Type Culture Collection (Rockville, Maryland) and maintained overnight in humidified air (5% CO2) at 37°C in serum-free DMEM containing 5% FCS and 1% (vol/vol) penicillin–streptomycin–nystatin solution. Then, the cells were incubated for 18 hours with human serum taken before or after prednisone treatment (25 µL/mL medium) and macrophage oxidative status and lipid metabolism were analyzed as described further on.
In Vitro Studies
Direct effect of prednisone and prednisolone on cellular lipid content in human monocyte-derived macrophages
Human monocytes were isolated from the peripheral blood samples of 3 healthy fasting normolipidemic volunteers by density-gradient centrifugation using Ficoll-Paque (15 mL Ficoll:20 mL blood). 31 Cells were washed twice in RPMI-1640 medium and plated. After 2 hours incubation, nonadherent cells were removed and cells were further incubated with RPMI-1640 medium plus 15% (vol/vol) autologous serum. After 5 days in culture, the monocytes differentiated into macrophages. Cells were treated with prednisone or prednisolone (200 ng/mL) for 18 hours, followed by assessment of cellular cholesterol and triglyceride mass.
Direct effect of prednisone and prednisolone on cellular oxidative status and lipid metabolism in J774A.1 macrophages
J774A.1 macrophages were treated with increasing concentrations of prednisone or prednisolone (0, 50,100, and 200 ng/mL) for 18 hours. 4 Cellular toxicity was assessed by determining cell protein content and by the release of lactate dehydrogenase (LDH) into the medium. All assays for triglyceride and cholesterol metabolism, as well as for gene expression, are described further on. To reveal whether the GCs’ effect on macrophages is mediated through their receptors on the cell membrane, J774A.1 macrophages were treated with 25 µM of the GC-receptor antagonist mifepristone (RU486), followed by overnight incubation with 200 ng/mL prednisone or prednisolone. Next, the cells were washed and analyzed for cholesterol and triglyceride metabolism, PON2 activity, and SH group level. All analyses were performed as described in the following.
Direct effect of prednisone and prednisolone on cellular oxidative status and lipid content in mouse embryonic fibroblasts
Mouse embryonic fibroblasts were kindly provided by Prof Ami Aronheim from the Department of Cell Biology and Cancer Science, The B. Rappaport Faculty of Medicine, Technion—Israel Institute of Technology, Haifa. The MEFs were isolated from 15 dpc embryos. 32
To determine the effect of GCs on cell types other than macrophages, MEFs were incubated in DMEM containing 5% FCS and 1% penicillin–streptomycin–nystatin solution, then incubated with prednisone or prednisolone at 200 ng/mL for 18 hours, and lipid peroxidation and content were analyzed.
Oxidative Status Parameters
Lipid peroxide assay in aortas
Aortic lipids were extracted with hexane:isopropanol (3:2 [vol/vol]), and the hexane phase was evaporated under nitrogen. Aortic lipid peroxidation was measured by lipid peroxide assay 29 and was expressed as µmol lipid peroxide/mg protein.
2′,7′-Dichloro-dihydro-fluorescein diacetate assay in cells
Intracellular reactive oxygen species (ROS) generation was determined in 1 × 10⁶ cells using the 2′,7′-dichloro-dihydro-fluorescein diacetate (DCFH-DA) probe. 33 Cells were washed twice in PBS and incubated for 40 minutes with 10 µM DCFH-DA at 37°C in the dark. Then, the cells were washed twice and scraped. Cell fluorescence was determined by flow cytometry. Measurement of cellular fluorescence by fluorescence-activated cell sorter (FACS) was performed at 510 to 540 nm after excitation of the cells at 488 nm with an argon ion laser.
Macrophage PON2 Expression
The PON2 lactonase activity was measured using dihydrocoumarin (DHC). 33 Macrophages were washed twice with PBS, and 1 mM DHC was added to the cells (in 50 mM Tris–HCl, pH 8.0 + 1 mM CaCl2). Nonenzymatic hydrolysis was measured in a cell-free system. Rates of hydrolysis were determined spectrophotometrically after 10 minutes incubation. Nonenzymatic hydrolysis of DHC was subtracted from the total rate of hydrolysis, and 1 unit of lactonase activity was equal to 1 μmol DHC hydrolyzed per minute.
We used the MasterPure RNA purification kit (Thermo Scientific, Waltham, Massachusetts) to extract total RNA from the cells. A Thermo Scientific complementary DNA (cDNA) kit was used to generate cDNA from the total RNA. Quantitative polymerase chain reaction (PCR) was performed with a Rotor-Gene 6000 amplification detection system (Corbett, Mortlake, Australia). The PON2 messenger RNA (mRNA) data were normalized to GAPDH, which was used as an internal standard. Primers and probes were designed by Primer Design (South Hampton, United Kingdom).
Macrophage SH Group Content
After cell sonication, a 25-µL aliquot was mixed with 175 µL of Tris–EDTA buffer, and the absorbance was measured at 412 nm. The DTNB (10 mM) was added, and samples were incubated for 15 minutes and then submitted to absorbance measurements together with a DTNB blank, and total SH groups were calculated. 34
Macrophage Lipid Metabolism
Macrophage triglyceride content
Cell lipids were extracted with hexane:isopropanol (3:2 [vol/vol]). The hexane phase was evaporated under nitrogen. Cellular triglyceride content was determined spectrophotometrically using a Serum Triglyceride Determination Kit (Sigma, St. Louis, Missouri).
Macrophage triglyceride-biosynthesis rate
Macrophages were incubated with [3H]-labeled oleic acid (3.3 μCi/mL; 3 hours, 37°C) in serum-free medium with 0.2% (vol/vol) bovine serum albumin. 35 Cells were then washed 3 times with PBS, and lipids were extracted as described above. The dried lipid residue was dissolved in 100 µL chloroform and loaded onto thin-layer chromatography silica gel plates. Lipids were separated with hexane:ether:acetic acid (130:30:1.5, vol/vol). Triglyceride spots were visualized by iodine vapor, scraped into scintillation vials, and counted for radioactivity by β-counter.
Macrophage cholesterol content
Cell lipids were extracted with hexane: isopropanol (3:2, vol/vol). The hexane phase was evaporated under nitrogen. Cellular cholesterol content was determined spectrophotometrically using the Serum Cholesterol Determination Kit (Roche).
Macrophage cholesterol-biosynthesis rate
Macrophages were incubated with [3H]-labeled acetate for 3 hours at 37°C, followed by cellular lipid extraction, separation, and radioactivity counting of the unesterified cholesterol spots, as described for triglyceride-biosynthesis rate determination.
Macrophage uptake of LDL or Ox-LDL
Low-density lipoprotein was isolated from the plasma of healthy normolipidemic donors (Rambam Hospital, Helsinki Committee number 30572-10-RBM) by discontinuous density-gradient ultracentrifugation 36 and dialyzed against saline (1 mmol/L Na-EDTA).
Prior to oxidation, LDL was dialyzed against EDTA-free buffer, at 4°C, pH 7.4. Low-density lipoprotein (1 mg protein/mL) was incubated with 10 µM CuSO4 for 20 hours at 37°C. The extent of LDL oxidation was determined using thiobarbituric acid reactive substances assay. 37 Either LDL or Ox-LDL was conjugated to fluorescein isothiocyanate (FITC) for cellular lipoprotein uptake studies. 38 J774 A.1 macrophages were incubated with FITC-conjugated LDL or Ox-LDL at a final concentration of 1 mg protein/mL (3 hours, 37°C). Lipoprotein uptake was determined by flow cytometry. Fluorescence was determined by FACS (510-540 nm) after excitation of the cells at 488 nm with an argon ion laser.
High-density lipoprotein-mediated cholesterol efflux from macrophages
High-density lipoprotein was isolated from the plasma of healthy normolipidemic donors (Rambam Hospital Helsinki, Committee number 30572-10-RBM) by discontinuous density-gradient ultracentrifugation. 36 Macrophages were incubated with [3H]-labeled cholesterol (2 µCi/mL) in FCS-free medium for 1 hour at 37°C, followed by 3 cell washes in PBS and further incubation in the presence or absence of HDL (100 µg protein/mL) for 3 hours at 37°C. [3H] label in the cells and medium was quantified by liquid scintillation counting. The HDL-mediated cholesterol efflux was determined by the ratio of [3H] label in the medium/([3H] label in the cells + [3H] label in the medium). 39
Expression of HMG-CoA reductase, diacylglycerol acyltransferase 1, and sterol regulatory element binding protein mRNA
We used the MasterPure RNA purification kit to extract total RNA from the cells. The Thermo Scientific cDNA kit was used to generate cDNA from the total RNA. Quantitative PCR was performed with a Rotor-Gene 6000 amplification detection system. HMG-CoA reductase (HMGCR), diacylglycerol acyltransferase 1 (DGAT1), and sterol regulatory element binding protein 1 (SREBP1) and SREBP2 mRNA data were normalized to GAPDH, which was used as the internal standard. Primers and probes were designed by Primer Design. 40
Statistics
For each study, 3 experiments (each one in triplicate) were performed to achieve statistical significance. For statistical analyses, we used Student t test to compare the control group/cells and those treated with prednisone or prednisolone.
Results
In Vivo Study
Effect of prednisone and prednisolone administration to C57BL/6 mice on their serum biochemical parameters
There was no difference in fasting serum glucose level, oxidative status, or triglyceride level between the treatment groups. A mild (up to 5%), nonsignificant increase in serum cholesterol was observed in the prednisone- and prednisolone-treated mice compared to the control group. A significant increase in serum PON1 activity was observed in the prednisone- and prednisolone-treated mice compared to controls (by up to 27% and 22%, respectively, P < .05). Moreover, a significant (P < .05) increase in serum SH group levels was observed in the prednisone- and prednisolone-treated mice (up to 60% and 113%, respectively) versus control mice (Supplemental Table 1).
Effect of prednisone and prednisolone administration to C57BL/6 mice on lipid accumulation and peroxidation in their aortas
Aortic lipid peroxide level decreased by 20% (P < .05) in the prednisolone-treated mice (Figure 1A). Prednisone and prednisolone treatment attenuated aortic triglyceride content by 20% and 22% (P < .05, Figure 1B), and aortic cholesterol content by 22% and 11% (P > .05, Figure 1C), respectively, as compared to control mice.

Effects of prednisone and prednisolone treatment on mouse aorta oxidative status and lipid metabolism. Aortas from prednisone-, prednisolone-, and placebo (control)-treated mice were assessed for (A) lipid peroxides, (B) cholesterol mass, and (C) triglyceride mass. Results are expressed as mean (standard deviation) of n = 6 aortas for each group. *Significantly different from control aortas (P < .05).
Effect of prednisone and prednisolone administration to C57BL/6 mice on lipid metabolism in their MPM
Treatment with prednisone and prednisolone resulted in a marked attenuation in MPM triglyceride mass, by 30% and 25%, respectively, compared to control MPMs from placebo-treated mice (P < .05, Figure 2A). This was due to a significant decrease in triglyceride-biosynthesis rate in the MPM of the prednisone- and prednisolone-treated mice (by 64% and 53%, respectively, compared to controls, P < .05, Figure 2B), with concurrent downregulation of mRNA expression of DGAT1, the key enzyme catalyzing triglyceride biosynthesis in macrophages (by 21% and 35%, respectively, P < .05, Figure 2C).

Effects of intraperitoneal injections of prednisone and prednisolone on MPM lipid metabolism. MPM were harvested from prednisone-, prednisolone-, or placebo (control)-treated mice and assessed for (A) triglyceride mass, (B) triglyceride-biosynthesis rate, (C) DGAT1 mRNA level, (D) cholesterol mass, (E) cholesterol-biosynthesis rate, (F) HMGCR mRNA level, and (G) SREBP2 mRNA level. Results are expressed as mean (standard deviation) of n = 6 mice for each group. *Significantly different from control macrophages (P < .05). DGAT1 indicates diacylglycerol acyltransferase 1; HMGCR, HMG-CoA reductase; MPM, mouse peritoneal macrophage; mRNA, messenger RNA; SREBP2, sterol regulatory element binding protein 2.
A significant decrease in cholesterol content, by 37% and 42%, was observed in MPM of prednisone- and prednisolone-treated mice, respectively, versus controls (P < .05, Figure 2D). In parallel, cholesterol-biosynthesis rate was reduced in the MPM of the prednisone- and prednisolone-treated mice, by up to 29% and 45%, respectively, versus control MPM (P < .05, Figure 2E). The mRNA expression of HMGCR (the rate-limiting enzyme in cholesterol biosynthesis) was downregulated in prednisone- and prednisolone-treated MPM versus controls by 44% and 47%, respectively (P < .05, Figure 2F). Accordingly, mRNA expression of SREBP2 (a transcription factor and master regulator of HMGCR expression) was significantly decreased in MPM from prednisone- and prednisolone-treated mice, by 53% and 49%, respectively, versus control MPM (P < .05, Figure 2G).
Cellular oxidation as measured by DCFH-DA assay was mildly reduced in MPMs from prednisone- and prednisolone-treated mice compared to the controls (data not shown).
Ex Vivo Study in Humans Treated With Oral Prednisone
Patients’ metabolic parameters and serum properties
No differences were observed in patient body weight, BMI, or fasting glucose, hemoglobin A1C, or serum cholesterol levels during the treatment period. A 28% increase in serum triglyceride level was observed after 5 days of treatment in 6 of the 9 participants (Supplemental Table 2).
Effect of human serum taken before or after prednisone treatment on J774A.1 macrophages lipid metabolism and oxidative status
Incubation of J744A.1 macrophages with human serum obtained after treatment with oral prednisone resulted in a 17% reduction in cellular triglyceride content compared to cells incubated with human serum obtained before prednisone treatment (mean 5.0 [0.1] µg/mg cell protein vs 6.0 [0.2] µg/mg cell protein, P < .05, Figure 3A). This effect was associated with a 15% decrease in triglyceride-biosynthesis rate (mean 11103 [649] cpm/mg cell protein vs 13116 [658] cpm/mg cell protein, P < .05, Figure 3B). Since PON2 has been shown to inhibit macrophage triglyceride-biosynthesis rate, 35 its activity was evaluated. Incubation of J774A.1 macrophages with human serum collected after prednisone treatment resulted in a significant increase in PON2 activity, by up to 46%, compared to macrophages incubated with human serum before prednisone treatment (mean 0.143 [0.010] U/mg cell protein vs 0.098 [0.004] U/mg cell protein, P < .05, Figure 3C). We observed a significant increase in SH groups, by up to 23%, in macrophages incubated with human serum after prednisone treatment compared to those incubated with serum before treatment (2.40 [0.03] mM SH/g protein and 1.96 [0.05] mM SH/g protein, respectively, P < .05, Figure 3D).

Effect of human serum (taken before and after prednisone treatment) on cellular oxidation and lipid metabolism of J774A.1 cultured macrophages. J774A.1 macrophages were incubated for 18 hours with human serum (25 μL/mL) either before or after prednisone treatment and assessed for (A) triglyceride mass, (B) triglyceride-biosynthesis rate, (C) PON2 activity, (D) SH group content, (E) cholesterol mass, and (F) cholesterol-biosynthesis rate. Results are expressed as mean (standard deviation) of n = 9 patients. *Significantly different from control macrophages (P < .05). PON2 indicates paraoxonase 2.
J774A.1 macrophages incubated with human serum obtained after prednisone treatment showed a significant reduction in cholesterol mass, by up to 12%, as compared to macrophages incubated with serum before treatment (mean 10.7 [0.4] µg/mg cell protein vs 12.0 [0.3] µg/mg cell protein, P < .05, Figure 3E). Incubating J774A.1 macrophages with human serum collected after prednisone treatment resulted in a significant decrease in cholesterol-biosynthesis rate (mean 1442 [38] cpm/mg cell protein vs 1745 [44] cpm/mg cell protein in controls, P < .05, Figure 3F).
Direct Effect of Prednisone and Prednisolone on Macrophages In Vitro
Direct effect of prednisone and prednisolone on human monocyte-derived macrophage lipid content
Human monocyte-derived macrophage (HMDM) from 3 patients were incubated with 200 ng/mL of prednisone or prednisolone. Mean cellular triglyceride mass was significantly reduced in these cells, by 17% and 21%, respectively, as compared to controls (P < .05, Figure 4A). Similarly, we observed a 23% and 29% reduction in macrophage cholesterol mass in the prednisone- and prednisolone-treated cells versus controls (P < .05, Figure 4B).

Effects of prednisone and prednisolone on human monocyte-derived macrophage (HMDM) triglyceride and cholesterol metabolism. HMDMs from 3 healthy patients were incubated for 18 hours with 200 ng/mL prednisone or prednisolone and assessed for (A) triglyceride mass and (B) cholesterol mass. Results are expressed as mean (standard deviation) of 3 different experiments. *Significantly different from control macrophages (P < .05).
Direct effect of prednisone and prednisolone on J774A.1 macrophage oxidative status and lipid metabolism
J744A.1 macrophages were incubated with increasing concentrations (0, 50, 100, and 200 ng/mL) of prednisone or prednisolone for 18 hours, and cellular viability was assessed using measurements of cellular protein content and of LDH release to the incubation medium. These GC concentrations had no significant effects on J774A.1 macrophage viability (data not shown).
Incubation of J774A.1 macrophages with increasing concentrations (0-200 ng/mL) of prednisone or prednisolone resulted in a significant (P < .05) dose-dependent reduction in cellular triglyceride content, by up to 12% and 25%, respectively (Figure 5A). This effect was abolished by the addition of the GC-receptor antagonist mifepristone (RU486, 25 µM). Prednisone- and prednisolone-treated macrophages showed a significant (P < .05) decrease in triglyceride-biosynthesis rate, by 24% and 34% on using 100ng/mL of the drugs, respectively, compared to control cells, while 200 ng/mL decreased it by 20% and 30%, respectively (Figure 5B). Since the hydrolase/lactonase PON2 has been shown to decrease triglyceride-biosynthesis rate in macrophages, 35 PON2 mRNA and activity were evaluated. Incubation of the cells with 50 or 200 ng/mL of prednisone, but mainly with prednisolone, resulted in a significant increase in PON2 mRNA levels (Figure 5D) as compared to control cells, by up to 35% (P < .05) and 77% (P < .001), respectively. In parallel, there was a significant increment in macrophage PON2 lactonase activity, up to 78% (P < .01) and 67% (P < .01), respectively, compared to control cells (Figure 5E).

Effects of prednisone and prednisolone on J774A.1 macrophage triglyceride metabolism:concentration study. J774A.1 macrophages were incubated with no addition (control cells) for 18 hours with (50, 100, and 200 ng/mL) of prednisone or prednisolone and assessed for (A) triglyceride mass, (B) triglyceridebiosynthesis rate, (C) PON2 mRNA level, (D) PON2 activity, and (E) SH group content. Results are expressed as mean (standard deviation) of 3 different experiments. *Significantly different from control macrophages (P < .05). mRNA indicates messenger RNA; PON1, paraoxonase 1; PON2, paraoxonase 2.
Only 200 ng/mL of prednisone or prednisolone resulted in a small (9% and 19%, respectively) decrease in cellular ROS generation, as measured by the DCFH-DA assay (205 [13] and 183 [15], respectively, vs 227 [10] arbitrary units, by flow cytometry DCFH-DA assay). Finally, in prednisone- and prednisolone-treated macrophages, we observed higher SH group levels than in the control cells, by up to 13% or 30%, respectively (P < .05, Figure 5F).
A dose-dependent attenuating effect was observed when assessing cellular cholesterol mass. Prednisone or prednisolone at concentrations (50, 10, and 200 ng/mL) decreased macrophage cholesterol content by up to 18% (P < .05) and 22% (P < .01), respectively, compared to control cells (Figure 6A). This effect was abolished by the addition of RU486 (25 µM). We examined the possible association between the prednisone- and prednisolone-induced decrement in macrophage cholesterol content and attenuated cholesterol-biosynthesis rate, reduced LDL or Ox-LDL uptake, or increased HDL-mediated cholesterol efflux from the cells.
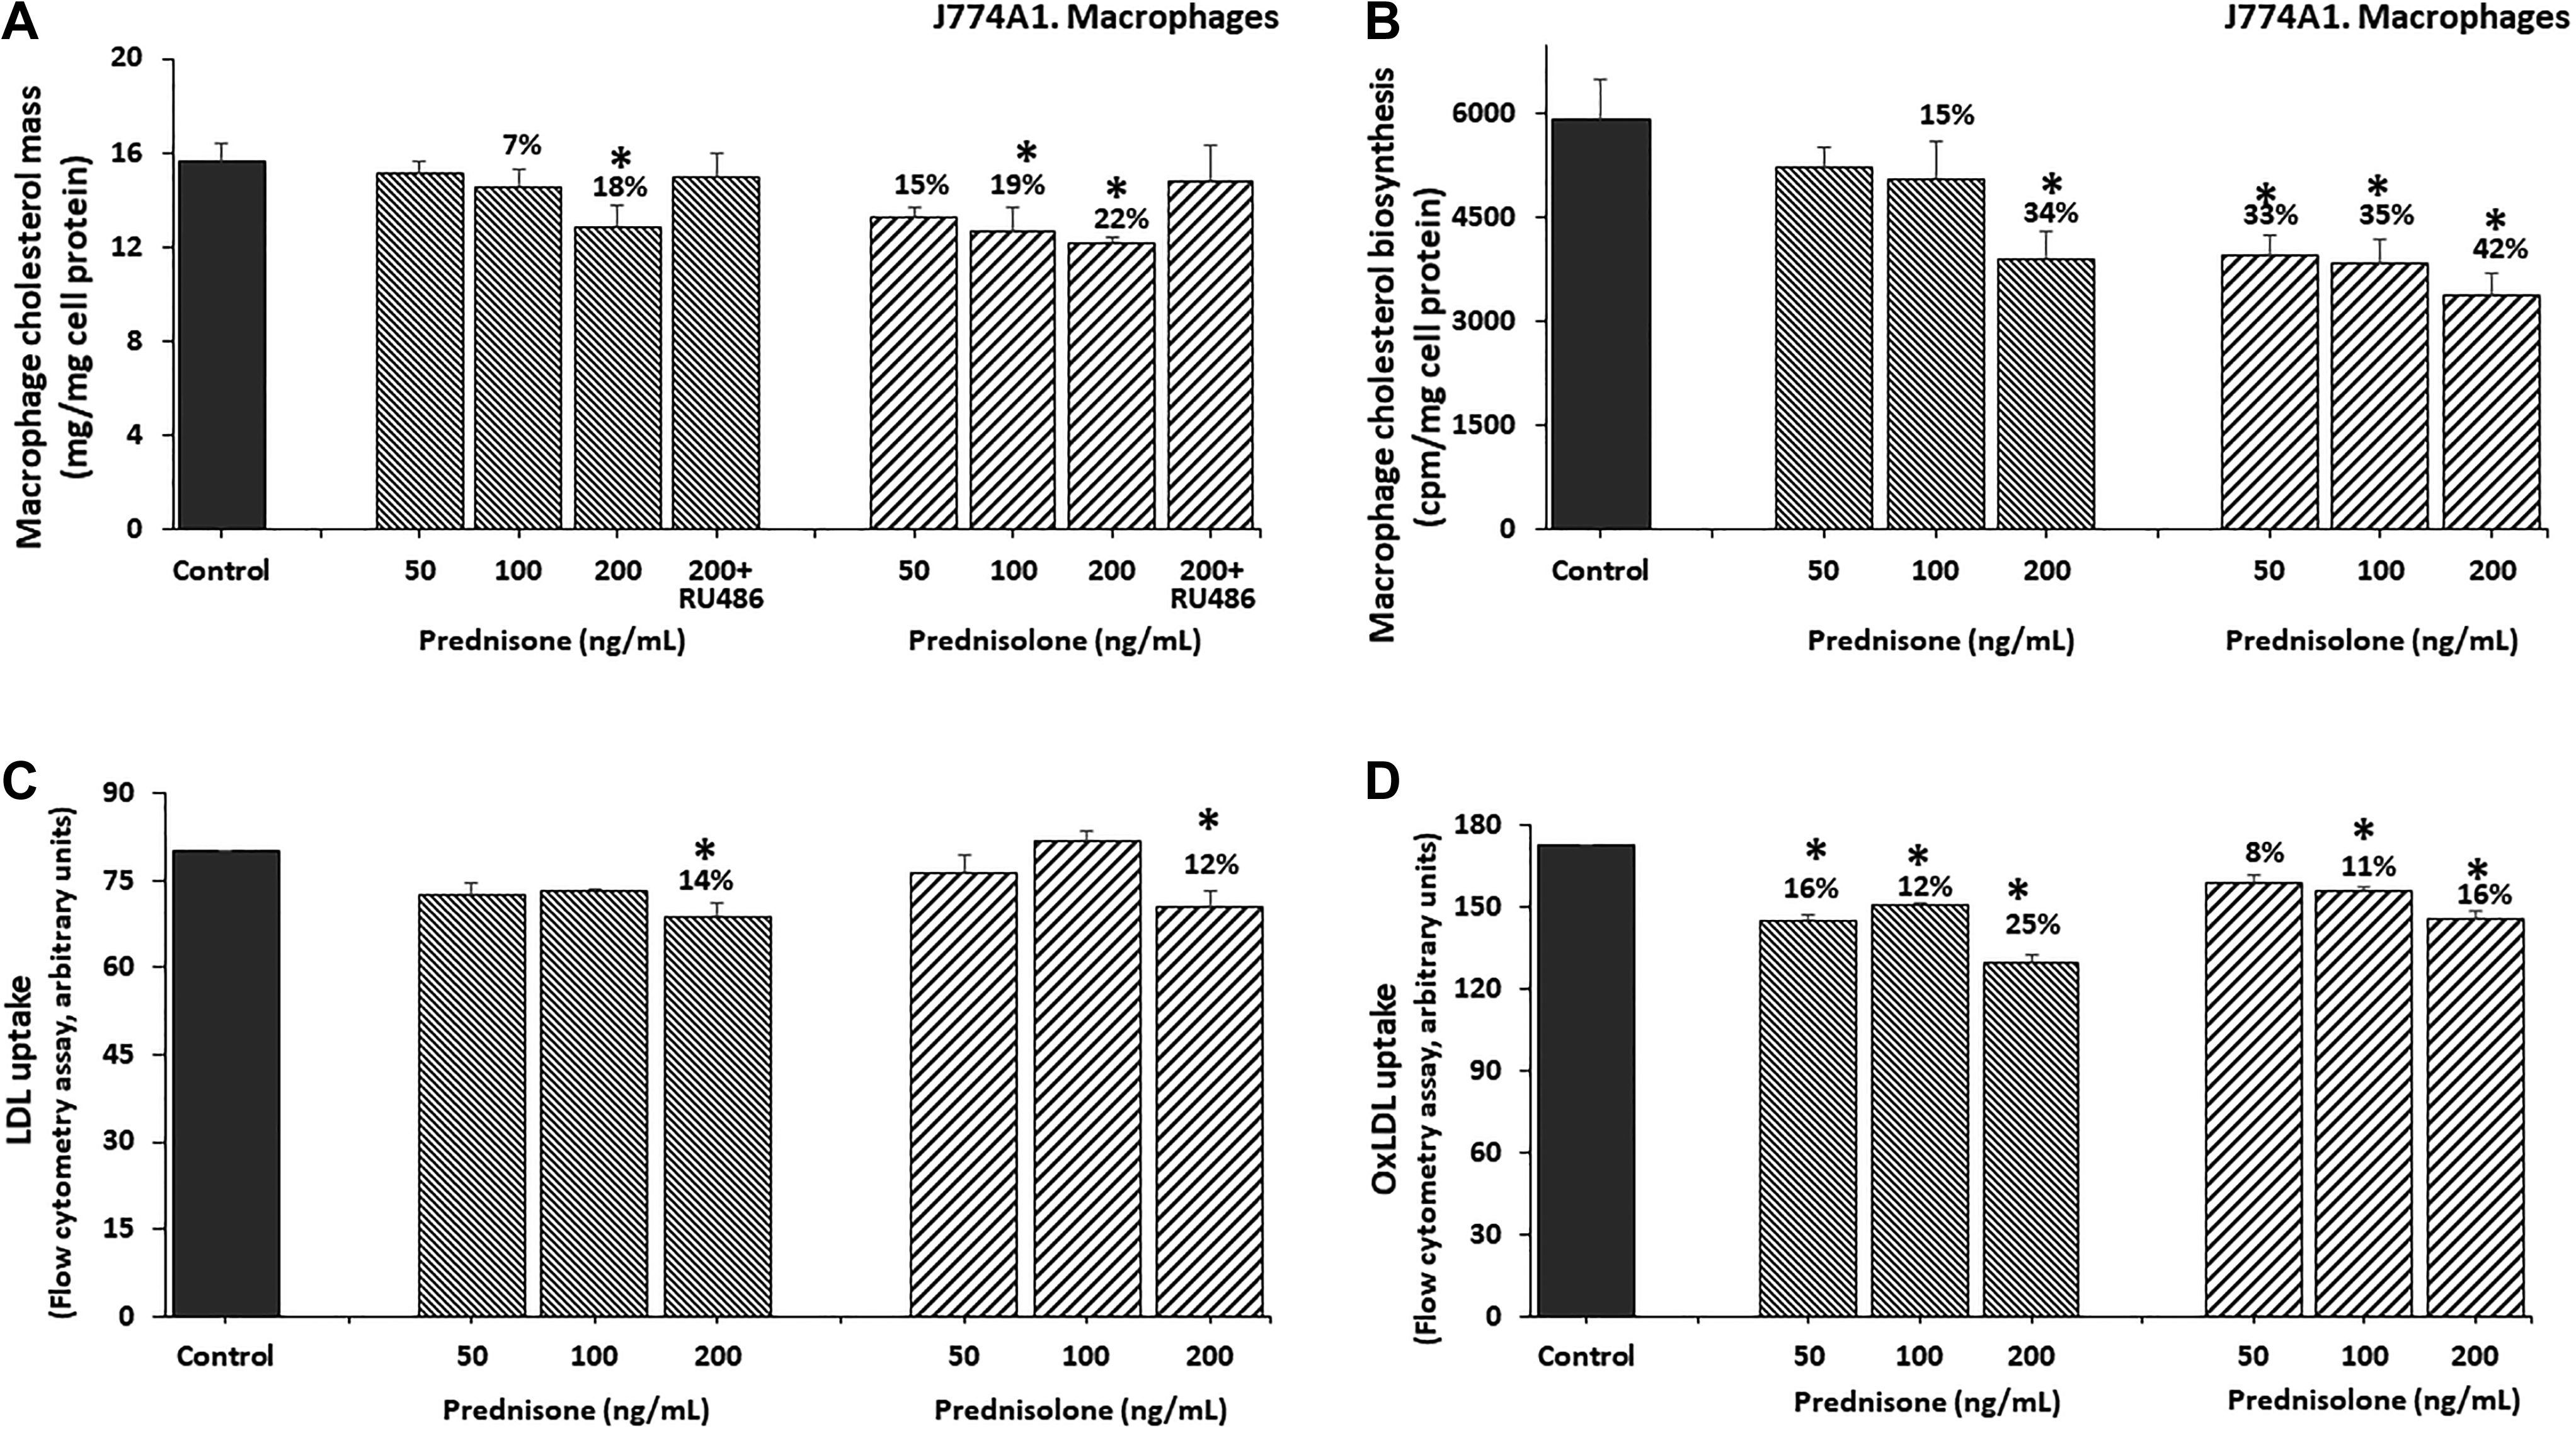
Effects of prednisone and prednisolone on J774A.1 macrophage cholesterol metabolism:concentration study. J774A.1 macrophages were incubated for 18 hours with no addition (control cells) or with prednisone or prednisolone (50, 100, and 200 ng/mL) and assessed for (A) cholesterol mass, (B) cholesterol-biosynthesis rate, (C) LDL uptake, and (D) Ox-LDL uptake. Results are expressed as mean (standard deviation) of 3 different experiments. *Significantly different from control macrophages (P < .05). LDL indicates low-density lipoproteins; Ox-LDL, oxidized low-density lipoprotein.
Upon incubating the cells with prednisone or prednisolone (50, 100, or 200 ng/mL), we observed a significant dose-dependent decrease in cellular cholesterol-biosynthesis rate by up to 34% (P < .001) and 42% (P < .001), respectively, compared to control cells (Figure 6B).
We next determined the extent of LDL or Ox-LDL uptake by the cells. Macrophage exposure to prednisone and prednisolone (50, 100, or 200 ng/ mL) led to decreased LDL uptake by up to 14% (P < .05) and 12% (P < .05), respectively (Figure 6C), and more prominently in Ox-LDL uptake by the cells by up to 25% (P < .001) and 16% (P < .05), respectively, compared to control cells (Figure 6D). The HDL-mediated cholesterol efflux from cells was minimally and nonsignificantly increased in J774A.1 macrophages treated with 200 ng/ mL of prednisone or prednisolone by 14% compared to controls (24 [1] and 26 [3] vs 22.6 [0.2%], respectively).
Since HMGCR is the rate-limiting enzyme in cholesterol biosynthesis, and DGAT1 is the rate-limiting enzyme in triglyceride biosynthesis, we next analyzed the effects of prednisone or prednisolone (50 or 200 ng/mL) in vitro on J774A.1 HMGCR or DGAT1 mRNA expression. We also performed time study analyzing these genes expression after short time (4 hours) or long time (18 hours) exposure of the cells to the drugs (Figure 7). Prednisone 50 or 200 ng/mL decreased HMGCR mRNA levels after 4 hours by 14% or 18% (Figure 7A) and significantly after 18 hours by 36% or 40%, respectively, as compared to control cells (Figure 7B, P < .01). Prednisolone 50 or 200 ng/mL decreased HMGCR mRNA levels significantly after 4 hours by 29% or 37% (Figure 7A) and after 18 hours by 33% or 41%, respectively, as compared to control cells (Figure 7B, P < .01).

Effects of prednisone and prednisolone on J774A.1 macrophage on HMGCR or DGAT1 mRNA expression:time study. J774A.1 macrophages were incubated for 4 hours (A and C), or 18 hours (B or D) with no addition (control cells) or with prednisone or prednisolone (50 and 200 ng/mL), and assessed for HMGCR mRNA (A, B), or DGAT1 mRNA (C, D). Results are expressed as mean (standard deviation) of 3 different experiments. *Significantly different from control macrophages (P < .01). DGAT1 indicates diacylglycerol acyltransferase 1; HMGCR, HMG-CoA reductase; mRNA, messenger RNA.
Cellular DGAT1 mRNA levels were lower by 31% or 34% after 4 hours (P < .01) and by 10% or 23% after 18 hours incubation of the cells with 50 or 200 ng/mL of prednisone, respectively, as compared to control cells (Figure 7C and D). Prednisolone (50 or 200 ng/mL) significantly reduced DGAT1 mRNA levels after 4 hours by 35% or 50% (P < .01), whereas after 18 hours, it was reduced by only 13% or 32%, respectively, as compared to control cells.
Effect of prednisone and prednisolone on MEF lipid oxidation and accumulation
We did not observe any effect on cellular lipid peroxidation or accumulation after incubating MEF with prednisone or prednisolone (up to 200 ng/mL) compared to the control cells (Supplemental Figure 1). These results indicated the unique antiatherogenic effect of GCs on macrophages compared to other cell types.
Discussion
We have demonstrated in the current study that prednisone and prednisolone attenuate macrophage atherogenicity. The key findings of this study are (1) prednisone and prednisolone reduced macrophage triglyceride and mainly cholesterol accumulation through an inhibitory effect on their biosynthesis rates; and (2) these GCs effects were mediated their receptors on the macrophage.
Both GC drugs, prednisone and prednisolone, are widely used in clinical practice to treat patients with inflammatory diseases due to their immunosuppressive and anti-inflammatory features. The effectiveness of this class of medications is limited by their numerous adverse effects, including, but are not limited to, dyslipidemia, hypertension, insulin resistance, and glucose intolerance, all of which are well-known risk factors for CVD 41 that become more relevant with long-term exposure. However, it is still controversial whether GC drugs’ net effect (also in the short term) is antiatherogenic or proatherogenic. 9 –20,42 Previous studies have failed to reach any conclusions, and few studies that analyzed the effect of GCs on macrophages (key cells contributing to the atherosclerotic process) have reported conflicting data. 43 –46
Macrophage foam cells are characterized by elevated levels of oxidative stress and by accumulation of triglycerides and cholesterol. 47 In this study, we used 3 macrophage model systems: J774A.1 macrophages that were incubated with human serum derived from healthy patients before and after treatment with oral prednisone, or directly incubated with increasing concentrations (0-200 ng/mL) of the GCs; HMDMs that were directly incubated with GCs; and MPM derived from C57BL/6 mice injected with prednisone or prednisolone. All 3 macrophage types form foam cells similar to those observed in atherosclerotic lesions. The doses of prednisone or prednisolone were chosen according to their serum levels in healthy adults after administration. 4,48 Neither prednisone nor prednisolone at concentrations of up to 200 ng/mL had any significant effect on macrophage viability, as determined by both protein content and cellular LDH levels.
In the current study, prednisone and prednisolone treatment resulted in a decrease in cellular triglyceride content. This could be related to the GCs’ significant inhibitory effect on triglyceride-biosynthesis rate, mediated by downregulation of the rate-limiting enzyme DGAT1 expression that was more pronounced after short time (4 hours) incubation. The decrement in cellular triglyceride mass could also result from the significant GC-induced increment in PON2 expression (mRNA and lactonase activity). We have previously shown that PON2 inhibits microsomal DGAT1 activity, 35 and thus a significant increase in triglyceride content of MPM from PON2-knockout mice was noted, which was abolished by PON2 transfection into the cells. 49 Paraoxonase 2 is an intracellular enzyme that has anti-inflammatory and antioxidant properties. 50 To our knowledge, only one study in the literature has reported the effect of GCs on PON2, showing an increase in PON2 transcription in dexamethasone-treated NIH3T3 cells. 51
The conversion of macrophages into lipid-rich foam cells is also a result of elevation in cellular cholesterol content and alteration in cellular cholesterol metabolism, for example, enhanced rate of cholesterol biosynthesis and/or elevation in LDL/Ox-LDL uptake. 8,52,53 Prednisone, and its active metabolite prednisolone, had a significant dose-dependent attenuating effect on macrophage cholesterol content. This effect could be related to a decrement in the cellular uptake of LDL, or more so, Ox-LDL, and/or more importantly, to prednisone and prednisolone’s remarkable inhibition of cholesterol-biosynthesis rate, in accordance with the downregulated mRNA expression of HMGCR, the rate-limiting enzyme in cholesterol biosynthesis. 54 Prednisolone significantly decreased HMGCR expression already after 4 hours incubation with the cells, whereas prednisone demonstrated the maximal effect after 18 hours. The effects of GCs on HMGCR are not well established. In rat hepatocytes and cultured liver cells, 55 –58 GC-dependent induction of HMGCR was shown, whereas dexamethasone reduced HMGCR activity in rat pancreatic cells. 59 Moreover, we have demonstrated in MPM reduction in SREBP2 expression, in parallel to the observed decreased expression of macrophage HMGCR. SREBP2 is a transcription factor and master regulator that controlled the expression of numerous genes involved in cholesterol homeostasis, including HMGCR expression. 60 No previous studies have been conducted on GCs’ effect on HMGCR in macrophages or on their effect on SREBP2.
Using the GC-receptor antagonist mifepristone (RU486), we clearly demonstrated that the effects of prednisone or prednisolone on triglyceride and cholesterol metabolism are mediated via the receptors for GC on the cells.
Finally, GC treatment resulted in a trend toward decreased macrophage oxidative status, with significant upregulation of antioxidants, cellular SH groups and PON2. On the other hand, prednisone treatment does not have any significant antioxidant effect in patients with inactive systemic lupus erythematosus disease, 61 whereas dexamethasone-treated hepatocytes show reduced lipid peroxidation and a higher level of protein-SH groups. 62
In conclusion, our novel findings demonstrate the inhibitory effects of GCs on lipid-biosynthesis rate in macrophages, which may protect them from foam cell formation and the development of atherosclerosis. Figure 8 summarizes the antiatherogenic effects of prednisone and prednisolone on macrophages.

Antiatherogenic effects of prednisone or prednisolone on macrophage foam cell formation.
Supplemental Material
Supplemental Material, supp._figures - Prednisone and Its Active Metabolite Prednisolone Attenuate Lipid Accumulation in Macrophages
Supplemental Material, supp._figures for Prednisone and Its Active Metabolite Prednisolone Attenuate Lipid Accumulation in Macrophages by Helana Jeries, Nina Volkova, Claudia Grajeda-Iglesias, Mahmoud Najjar, Mira Rosenblat, Michael Aviram and Tony Hayek in Journal of Cardiovascular Pharmacology and Therapeutics
Supplemental Material
Supplemental Material, Supp._tables - Prednisone and Its Active Metabolite Prednisolone Attenuate Lipid Accumulation in Macrophages
Supplemental Material, Supp._tables for Prednisone and Its Active Metabolite Prednisolone Attenuate Lipid Accumulation in Macrophages by Helana Jeries, Nina Volkova, Claudia Grajeda-Iglesias, Mahmoud Najjar, Mira Rosenblat, Michael Aviram and Tony Hayek in Journal of Cardiovascular Pharmacology and Therapeutics
Footnotes
Acknowledgments
The authors thank Mareil Kaplan and Aviva Lazarovitz for their valuable assistance.
Authors contribution
H.J., M.A., and T.H. contributed to conception or design; acquisition, analysis, or interpretation; drafted the manuscript. N.V. contributed to conception or design; acquisition, analysis, or interpretation. C.G-.I. and M.N. contributed to acquisition, analysis, or interpretation. M.R. contributed to acquisition, analysis, or interpretation; drafted the manuscript. All authors critically revised the manuscript; gave final approval; agrees to be accountable for all aspects of work ensuring integrity and accuracy.
Declaration of Conflicting Interests
The author(s) declared no potential conflicts of interest with respect to the research, authorship, and/or publication of this article.
Funding
The author(s) received no financial support for the research, authorship, and/or publication of this article.
Supplemental Material
Supplemental material for this article is available online.
References
Supplementary Material
Please find the following supplemental material available below.
For Open Access articles published under a Creative Commons License, all supplemental material carries the same license as the article it is associated with.
For non-Open Access articles published, all supplemental material carries a non-exclusive license, and permission requests for re-use of supplemental material or any part of supplemental material shall be sent directly to the copyright owner as specified in the copyright notice associated with the article.