
Abstract
Introduction:
The 2013 pooled cohort equations (PCE) may misestimate cardiovascular event (CVE) risk, particularly for black patients. Alternatives to the original PCE (O-PCE) to assess potential statin benefit for primary prevention—a revised PCE (R-PCE) and US Preventive Services Task Force (USPSTF) algorithms—have not been compared in contemporary US patients in routine office-based practice.
Methods:
We performed retrospective, cross-sectional analysis of a nationally representative, US sample of office visits made from 2011 to 2014. Sampling criteria matched those used for PCE development: aged 40 to 79 years, black or white race, no cardiovascular disease. Original PCE, R-PCE, and USPSTF algorithms were applied to biometric and demographic data. Outcomes included estimated 10-year CVE risk, percentage exceeding each algorithm’s statin-treatment threshold (
Results:
In 12 556 visits (representing 285 330 123 nationwide), 10.8% of patients were black, 27.1% had diabetes, and 15.7% were current smokers. Replacing O-PCE with R-PCE decreased mean (95% confidence interval [CI]) estimated CVE risk from 12.4% (12.0%-12.7%) to 8.5% (8.2%-8.8%). Significant (P < 0.05) racial disparity in the rate of CVE risk
Conclusions:
Use of an alternative to O-PCE may reduce racial disparity in estimated CVE risk and may facilitate shared decision-making about primary prevention.
Introduction
For adults without established atherosclerotic cardiovascular disease (ASCVD) who are seen in office-based ambulatory care, risk calculators, which estimate the probability of experiencing a major cardiovascular event (CVE) over a follow-up period of up to 10 years, are an important tool in assessing the potential benefits of statin pharmacotherapy.
1
-4
Because of several studies showing that calculator-estimated CVE risks exceed actual event rates, it has been suggested that these tools, including the Systematic Coronary Risk Evaluation (SCORE) and QRISK in Europe
5,6
and the pooled cohort equation (PCE) estimator in the United States,
7
-11
may overestimate risk,
12
-16
sometimes more than 4-fold in “real-world” patient cohorts.
17
Concerns about the accuracy of the original PCE (O-PCE), a 10-year CVE risk calculator recommended by American College of Cardiology/American Heart Association (ACC/AHA) guidelines published from 2013 to 2019,
7
-11
have arisen partly because cohorts analyzed in its development were formed as early as 1948 and may not represent contemporary health promotion and treatment.
3,4,12,13
Additionally, concerns about the validity of the statistical methods used in fitting the O-PCE—specifically violation of technical assumptions and model “overfitting” that affected risk estimation for black individuals because of small subgroup sizes—have been raised.
13
These concerns were supported by an analysis documenting large estimation disparities for black and white adults who had comparable cardiovascular risk factors.
13
A proposed revised PCE (R-PCE) tool, developed using an updated model-fitting technique and cohort pool, reduced these disparities and resulted in an estimated 11.8 million fewer US adults recommended for statin therapy based on a 10-year CVE-risk threshold of
The risk threshold for primary prevention statin treatment in adults aged 40 to 75 years has also been questioned. In addition to statin treatment for all patients with low-density lipoprotein cholesterol (LDL-C) of
Updated ACC/AHA guidelines published in 2018 and 2019 addressed both risk estimation and treatment threshold by adopting a personalized approach to statin treatment decisions. 10,11,18 Specifically, the new guidelines affirmed the O-PCE as “well calibrated near decision thresholds” for the US population overall, 10 while recommending consideration of family and personal risk factors in persons with estimated risk of 7.5% to 20%. 11,18
Potentially lost in this debate is consideration of whether use of competing models would make a difference in routine clinical practice. Both ACC/AHA and USPSTF recommendations emphasize that risk calculations should inform, but not replace, shared provider–patient decision-making including consideration of patient preferences and of drug interactions or adverse events. 4,7,11 These factors may override risk-calculation recommendations. Moreover, because of “healthy volunteer bias,” 19,20 PCE-cohort data, derived from prospective studies with follow-up periods of up to several decades, 8,13 may not represent the characteristics of patients in routine care. Although some studies have compared the O-PCE with the USPSTF or other risk calculators in US, European, or other samples, 14 -16,21 -24 no study of contemporary US patients in routine clinical practice has, to the knowledge of these authors, compared the O-PCE, R-PCE, and USPSTF algorithms. The present study was conducted to compare estimated 10-year CVE risk and rates of guideline-concordant statin prescribing for primary prevention in black compared with white adults who met criteria for inclusion in the O-PCE and R-PCE calibration cohorts but were seen in routine office-based ambulatory care during a contemporary study period. Black versus white patients were compared in all analyses because mitigation of erroneous racial disparity in CVE risk estimation was a key objective of R-PCE development. 13
Methods
The study was a retrospective analysis of publicly available data obtained through the National Ambulatory Medical Care Survey (NAMCS), a nationally representative, cross-sectional assessment of care provided in office visits made to nonfederally employed US physicians, excluding contacts for administrative purposes (eg, prescription refills), by telephone, or to physicians not providing direct ambulatory care (eg, radiologists, pathologists). 25 The survey, which is conducted annually by the National Center for Health Statistics (NCHS), employs a multistage, stratified, and cluster-randomized design to select physicians, including family practice, internal medicine, and multiple specialty types. 25,26 From each physician, the NCHS randomly samples 1 week of 52, then a random sample of office visits within the chosen week. 25 NAMCS data are commonly used in analyses of the content and quality of US health care, 27 including studies of racial disparity 28,29 and of cardiovascular disease and risk factors. 30,31
Data downloaded for the present study were collected by the NCHS from 2011 to 2014. During that time period, rates of participation, defined as providing data for at least one visit, ranged from 37% to 54%. 26,32 -34 Weights that account for the multistage sampling design and for nonresponse are included in the data set so that users can produce national estimates with minimal nonresponse bias. 25,35
Data Collection
For each sampled office visit, data are abstracted from medical records using laptop-based, automated tools. 26 Collected data include demographic information; diagnoses made during the visit (up to 3 until 2013, up to 5 in 2014) in International Classification of Diseases (ICD)-9 format; biometric data including systolic blood pressure (SBP); most recent results of selected laboratory tests performed in the previous 12 months; health-related behaviors, including smoking status; and a selected list of clinically important medical conditions that may have been diagnosed prior to the extant visit. 26 Medical condition indicators accessed for the present study included cerebrovascular disease (CEBVD), congestive heart failure (CHF), coronary artery disease (CAD) or ischemic heart disease (IHD), diabetes, hyperlipidemia, and hypertension. 26 Also recorded is a complete medication list, with indicators of whether each drug was newly prescribed or continued. Specific medications are identified using generic drug codes provided by Lexicon Plus, a proprietary database licensed to the NCHS by Cerner Multum. 26
Sample Inclusion and Exclusion Criteria
Sampling criteria for visits matched those used in the calibration analyses for the O-PCE and R-PCE tools. 8,13 Specifically, the sample included visits made by adults aged 40 to 79 years who were of black or white race and had no diagnosis of atrial fibrillation (ICD-9 code = 427.3×), or medical condition code for CEBVD, CHF, or CAD/IHD. Also excluded were visit records that did not include a record of all data elements needed for the risk calculations, including high-density lipoprotein cholesterol (HDL-C), total cholesterol (TC), SBP, or smoking status. Patients who were already being treated with statins at the time of the visit were not excluded from the sample because they were included in the cohorts used to develop the O-PCE and the R-PCE. 8,13 Similarly, although patients aged 76 to 79 years are not covered by the ACC/AHA statin treatment algorithm, 7,11 they were included in the present study sample because of their inclusion in the O-PCE and R-PCE derivation cohorts. 8,13
Statistical Analyses
Original PCE and R-PCE scores are calculated as mathematically weighted combinations of demographic factors (age, sex, race), biometrics (HDL-C, TC, SBP), and other clinical risk factors (current smoking, diabetes). Both calculators predict risk of an incident ASCVD event: nonfatal myocardial infarction, fatal or nonfatal stroke, or death from coronary heart disease. 8,13 Because some calculations require assessment of whether SBP was treated or untreated, each visit was classified based on whether the patient was prescribed an antihypertensive medication (angiotensin-converting enzyme inhibitor, angiotensin-2 receptor blocker, β-blocker, calcium channel blocker, diuretic, combination antihypertensive, or systemic minoxidil) that was not newly prescribed. For patients who were antihypertensive-naive at the visit (ie, no antihypertensive drugs recorded or all antihypertensive drugs were newly prescribed), SBP was defined as untreated.
Both the O-PCE and R-PCE were coded into SPSS (IBM SPSS version 25.0, Armonk, New York), and results were verified against hypothetical test cases documented in published reports.
8,9,13
Algorithms were then applied to the data recorded for each office visit to develop estimated risk scores. Patients were classified into statin-benefit groups (ie, risk was sufficiently high to indicate potential benefit from treatment) using 3 methods: threshold of
Calculations, including the percentage of patients meeting the statin treatment threshold and the percentage prescribed new or continued statin treatment, were performed for the sample overall and for each race group. Two sensitivity analyses were performed to assess the effects of minor discrepancies between PCE cohort pools and ACC/AHA guidelines: (1) patients aged 76 to 79 years were excluded from the O-PCE- and R-PCE-based calculations to account for their exclusion from the ACC/AHA statin treatment algorithm
7,11
despite inclusion in the PCE cohorts
8,13
; and (2) patients with either LDL-C of
Between-group statistical tests, planned a priori, compared black and white patients using Pearson χ2 analyses for categorical variables and independent-sample t tests for continuous variables. Results were calculated both as point estimates and as 95% confidence intervals (CIs). The SPSS Complex Samples procedure was used for these analyses, with weights for strata and clusters provided in the NAMCS records.
26
All estimates presented herein meet NCHS standards for statistical reliability, including nonweighted case counts of
Results
Of 116 408 sampled office visits made from 2011 to 2014 by adults aged 40 to 79 years, 111 534 were made by patients of black or white race; of those, 100 586 were made by patients without established ASCVD or atrial fibrillation (Figure 1). After including only office visits in which all PCE data elements were recorded, 12 556 visits, representing 285 330 123 visits nationwide over the 4-year study period, remained in the sample (Table 1). Of those, 10.8% were made by black adults and 56.2% by women. The prevalence rate of diabetes was 27.1% (25.5%-28.7%); 15.7% (14.7%-16.9%) were current smokers; and 41.1% (39.0%-43.2%) were treated with

Sample selection flowchart, unweighted counts of physician office visits made by US adults aged 40 to 79 years without cardiovascular disease, 2011 to 2014. Excluded patients with atrial fibrillation, CAD, IHD, CEBVD, or CHF. Exclusion for atrial fibrillation was based on diagnosis code. Exclusion for all other diagnoses were based on medical condition indicators in the NAMCS file: CAD, CEBVD, CHF, and IHD. ASCVD indicates atherosclerotic cardiovascular disease; CAD, coronary artery disease; CEBVD, cerebrovascular disease; CHF, congestive heart failure; HDL, high-density lipoprotein; IHD, ischemic heart disease; NAMCS, National Ambulatory Medical Care Survey; SBP, systolic blood pressure.
Patient Characteristics, Office Visits Made by US Adults Aged 40 to 79 Years Without Cardiovascular Disease,a 2011 to 2014.
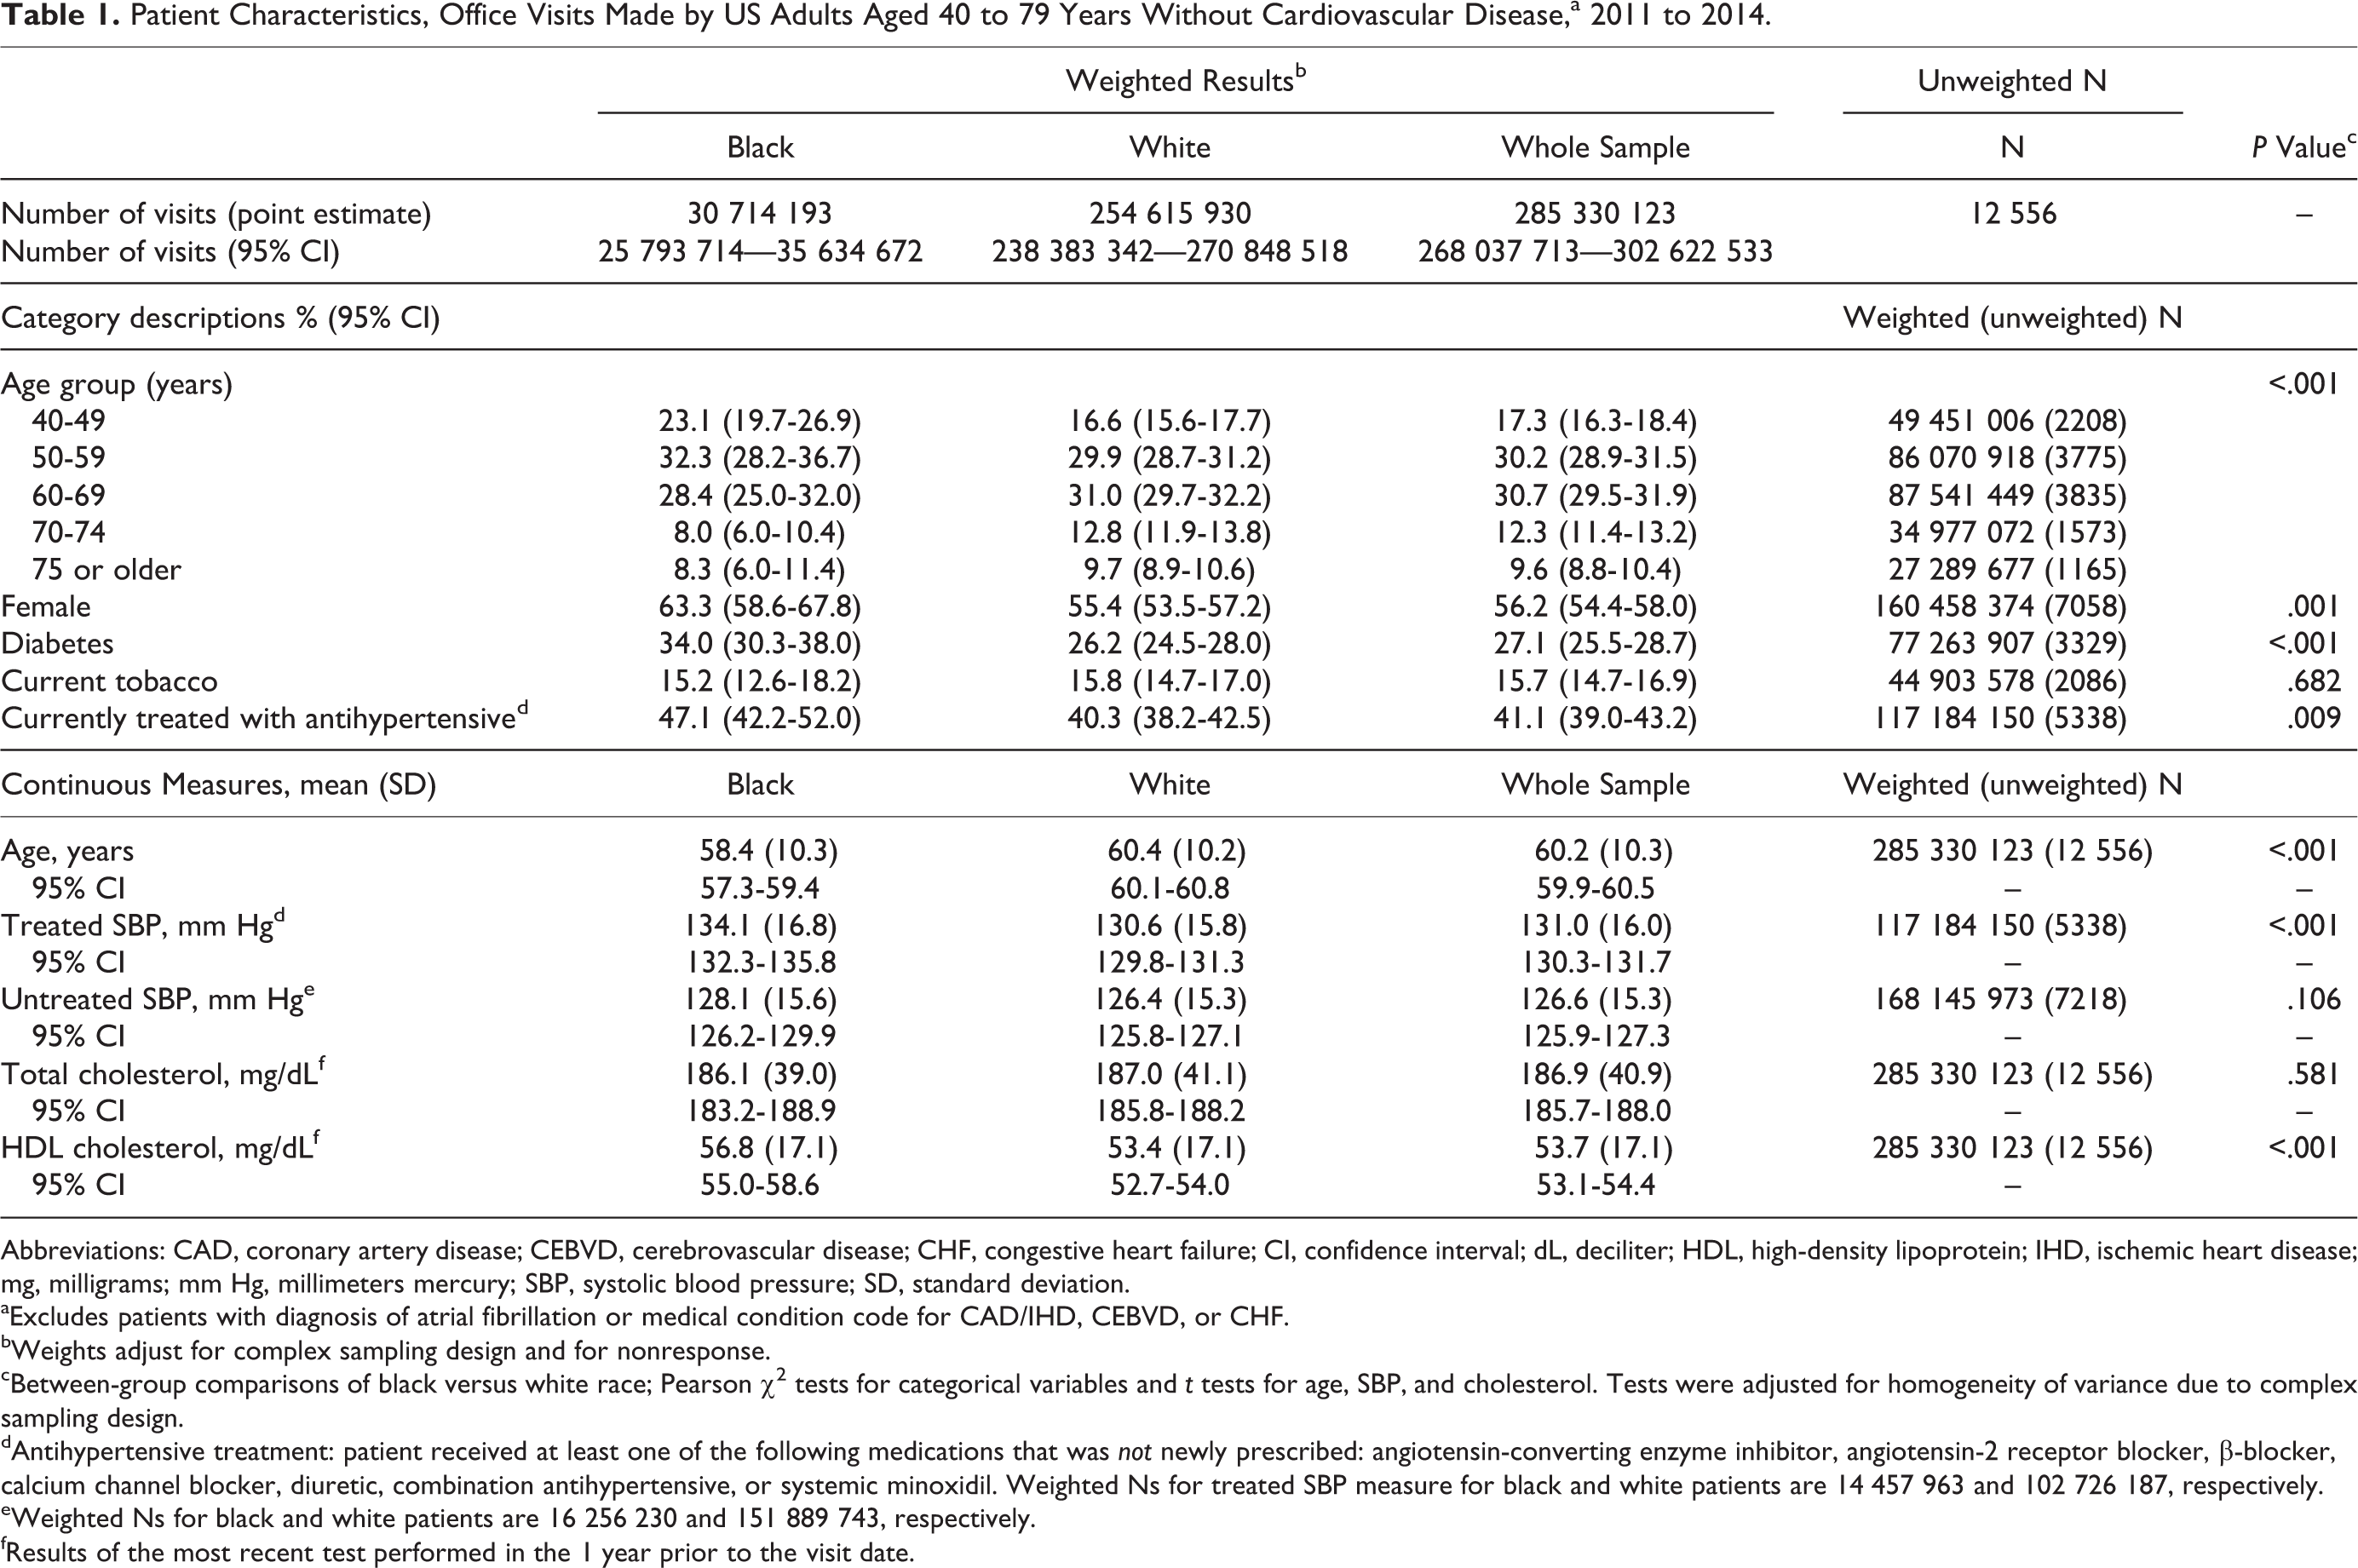
Abbreviations: CAD, coronary artery disease; CEBVD, cerebrovascular disease; CHF, congestive heart failure; CI, confidence interval; dL, deciliter; HDL, high-density lipoprotein; IHD, ischemic heart disease; mg, milligrams; mm Hg, millimeters mercury; SBP, systolic blood pressure; SD, standard deviation.
aExcludes patients with diagnosis of atrial fibrillation or medical condition code for CAD/IHD, CEBVD, or CHF.
bWeights adjust for complex sampling design and for nonresponse.
cBetween-group comparisons of black versus white race; Pearson χ2 tests for categorical variables and t tests for age, SBP, and cholesterol. Tests were adjusted for homogeneity of variance due to complex sampling design.
dAntihypertensive treatment: patient received at least one of the following medications that was not newly prescribed: angiotensin-converting enzyme inhibitor, angiotensin-2 receptor blocker, β-blocker, calcium channel blocker, diuretic, combination antihypertensive, or systemic minoxidil. Weighted Ns for treated SBP measure for black and white patients are 14 457 963 and 102 726 187, respectively.
eWeighted Ns for black and white patients are 16 256 230 and 151 889 743, respectively.
fResults of the most recent test performed in the 1 year prior to the visit date.
For the sample overall, use of the R-PCE instead of the O-PCE decreased mean (95% CI) calculated event risk by 31.4%, from 12.4% (12.0%-12.7%) to 8.5% (8.2%-8.8%); the percentage of patients in a potential statin-benefit group (ie, PCE-estimated risk of
Estimated Risk of ASCVD Event,a Office Visits Made by US Adults Aged 40 to 79 Years Without Cardiovascular Disease,b 2011 to 2014.

Abbreviations: ASCVD, atherosclerotic cardiovascular disease; CAD, coronary artery disease; CEBVD, cerebrovascular disease; CHD, coronary heart disease; CHF, congestive heart failure; CI, confidence interval; IHD, ischemic heart disease; NA, not applicable because the USPSTF recommendations were based on the original PCEs; PCE, pooled cohort equation; SD, standard deviation; USPSTF, US Preventive Services Task Force.
aDefined as CHD death, nonfatal myocardial infarction, or fatal or nonfatal stroke.
bExcludes patients with diagnosis of atrial fibrillation or medical condition code for CAD/IHD, CEBVD, or CHF.
cBetween-group comparisons of black versus white race; Pearson χ2 tests for risk category variables and t test for risk percentage. Tests were adjusted for homogeneity of variance due to complex sampling design.
dRisk factors include dyslipidemia, diabetes, hypertension, or current tobacco smoking. Row indicates original PCE plus one or more risk factors, which is the USPSTF statin treatment threshold criterion.
In the sample overall, statins were newly prescribed or continued for approximately equal percentages of potential statin-benefit patients regardless of estimation method: 41.0% (38.6%-43.4%) of those with O-PCE
Statin Prescribing Rates, Office Visits Made by US Adults Aged 40 to 79 Years Without Cardiovascular Disease,a 2011 to 2014.

Abbreviations: CAD, coronary artery disease; CEBVD, cerebrovascular disease; CHF, congestive heart failure; CI, confidence interval; IHD, ischemic heart disease; PCE, pooled cohort equation; USPSTF, US Preventive Services Task Force.
aExcludes patients with diagnosis of atrial fibrillation or medical condition code for CAD/IHD, CEBVD, or CHF.
bBetween-group comparison of black versus white race; Pearson χ2 tests. Tests were adjusted for homogeneity of variance due to complex sampling design.

Statin prescriptions by benefit group, physician office visits made by US adults aged 40 to 79 years without cardiovascular disease, 2011 to 2014. Excludes patients with atrial fibrillation, CAD, IHD, CEBVD, or CHF. Exclusion for atrial fibrillation was based on diagnosis code. Exclusion for all other diagnoses were based on medical condition indicators in the NAMCS file: CAD, CEBVD, CHF, and IHD. CAD indicates coronary artery disease; CEBVD, cerebrovascular disease; CHF, congestive heart failure; IHD, ischemic heart disease; O-PCE, original pooled cohort equation; R-PCE, revised pooled cohort equation; S-NP, statin not prescribed; S-P, statin prescribed; USPSTF, US Preventive Services Taskforce.
Sensitivity analyses limited to patients aged 40 to 75 years produced similar results (e-Table 2). Results were also similar when the statin-benefit group was expanded to include patients with LDL-C
Discussion
In the first US population-based study to compare O-PCE, R-PCE, and USPSTF algorithms in contemporary primary prevention, we found that using the R-PCE instead of the O-PCE reduced mean estimated risk by 31% and the percentage of patients with risk
Although generally consistent with findings of the R-PCE calibration study that O-PCE estimates exceeded those produced with R-PCE by approximately 20%, 13 the present study found larger differences in the estimates produced using the 2 tools. This discrepancy may be attributable in part to the time periods in which the patients in the respective studies were sampled. Patient cohorts used to develop R-PCE dated back to as early as 1971, although most were formed in the 1980s and 2 in the year 2000. 13 Changes in rates of obesity-related disease, medication use, and tobacco use since that time period 36 are consistent with the clinical differences between the R-PCE sample 13 and the present study sample, respectively: mean TC of 209 mg/dL and 187 mg/dL; smoking rates of 22% and 16%; and diabetes prevalence of 10% and 27%. Additionally, some of the cohorts used in O-PCE and R-PCE development predated the widespread use of statins. 8
From a policy perspective, these changes in risk profile over time highlight the importance of the observation, made both by ACC/AHA and R-PCE developers, that equations derived from study participant cohorts formed decades ago may need regular updating to reflect current risk-factor and disease-treatment profiles. 10,13 It is possible that a similar pattern would be observed if other calculators, such as SCORE, were applied to contemporary patient populations. For example, in one large cohort study that assessed the accuracy of multiple risk calculators, participants were recruited from 1963 to 2003. 14 This possibility should be investigated in future research.
Consistent with the goal of the R-PCE developers to reduce inappropriate variation in risk estimation between black and white individuals with comparable risk factors, 13 we found that racial disparities in both statin-benefit estimates and statin treatment rates were statistically significant using the O-PCE, but not the R-PCE or USPSTF guidance. From a public health perspective, the interpretation of this finding is not entirely clear. It has been suggested that increasing the statin-treatment threshold could lead to undertreatment of younger patients who might benefit from statin therapy 21 or could increase racial disparity due to disproportionate reductions in statin use by individuals who are black. 24 However, the R-PCE calibration study found that use of the revised technique greatly reduced instability in risk estimates for black persons, whose risk ratio relative to white persons with otherwise comparable risk factors varied from <70% to >250% using the O-PCE. 13 Thus, the relative absence of racial disparity observed in the present study may represent an improvement in targeting of drug therapy to patients who can benefit from it.
If so, clinicians may wish to consider use of the R-PCE in lieu of the O-PCE in patients who desire conservative ASCVD risk management. A disadvantage of the R-PCE is that it is not, at present, commercially available, although it is well-documented
13
and can be developed for spreadsheet or electronic health record (EHR) application. Given the 90% concordance between R-PCE and USPSTF recommendations based on O-PCE, an alternative for clinicians whose EHR systems automatically calculate O-PCE is to adopt the USPSTF recommendation of O-PCE of
This approach may also have merit in patient-centric management of statin nonadherence, a common phenomenon in clinical practice. 37 Specifically, given the accumulation of evidence that O-PCE may overestimate event risks, 3,4,13,17 use of the R-PCE or USPSTF recommendations may be helpful in targeting adherence-promotion efforts to patients who are most likely to benefit from statin therapy. Such an approach would be consistent with guidelines that emphasize the important role played by preferences and risk factors of individual patients in determining statin treatment initiation and intensity. 4,7,11
Limitations
Important limitations of the present study should be noted. Foremost, the study did not measure CVE rates, and the degree to which different models forecast future events in our study sample is not known. Second, the study sample was limited to patients for whom all data elements used in the PCE calculations, including laboratory values, were recorded in the visit record. It is possible that the patients represented in the sample differ systematically from all US adults seen in primary care. However, because O-PCE and R-PCE algorithms require laboratory test values, the study sample represents those patients who had the medical record data necessary for calculation of risk, which was the subject of the study. Moreover, any selection bias due to this limitation would be expected to affect all 3 calculation methods, as we applied different mathematical algorithms to a single sample.
Third, to facilitate replication and comparison with results obtained in the cohort samples used to develop the O-PCE and R-PCE, 8,13 the present study sample included some patients, such as those with diabetes, for whom the ACC/AHA guidelines recommend statin use regardless of estimated risk. 7,11 Sensitivity analyses suggested that results were similar even after accounting for this methodological decision. For the same reason, analyses were limited to individuals who are black or white, and results may be not be generalizable to those of other races. This approach is consistent with current ACC/AHA guidelines, which suggest applying risk calculations for white persons to all those of nonblack race but recommend that physicians take particular ethnic risk factors (eg, South Asian ethnicity) into account in making treatment decisions. 11
Fourth, the degree to which patients substituted lifestyle interventions, such as dietary or exercise modifications, for statin treatment—either upon medical advice or on their own—was also not measured in this research. Some patients may already have been using such lifestyle modifications prior to the extant sampled visit, helping to explain the relatively low level of statin use among those at elevated risk levels. Similarly, social determinants of health might affect either CVE risk or statin use, and current ACC/AHA primary prevention guidelines recommend considering them in making treatment decisions. 11 However, these data are not available in the NAMCS.
Two additional minor limitations related to NAMCS drug data should also be noted. The NAMCS record does not indicate drug dosage and therefore cannot be used to assess the intensity of statin therapy. Additionally, because the NAMCS records only drugs initiated or continued at the visit, the SBP of a patient using a single antihypertensive medication that was terminated by the physician and, therefore not included on the NAMCS record, would have been misclassified as untreated. However, this possibility seems unlikely, as termination of antihypertensive treatment is atypical in routine care. 38
Conclusions
In a large sample of adults seen in routine primary prevention of ASCVD, the PCE recommended by current ACC/AHA guidelines produced higher overall estimated CVE risk, and greater racial disparity in estimates of risk and of guideline-concordant statin prescribing, than did either of 2 competing models. Findings suggest potential for use of these newer tools in patient-centric CVE risk management and shared decision-making discussions, as well as the value of regularly updating risk-estimation tools for contemporary populations.
Supplemental Material
Supplemental Material, etable_file-Guideline-Concordant_Statin_Prescribing - Estimated Cardiovascular Risk and Guideline-Concordant Primary Prevention With Statins: Retrospective Cross-Sectional Analyses of US Ambulatory Visits Using Competing Algorithms
Supplemental Material, etable_file-Guideline-Concordant_Statin_Prescribing for Estimated Cardiovascular Risk and Guideline-Concordant Primary Prevention With Statins: Retrospective Cross-Sectional Analyses of US Ambulatory Visits Using Competing Algorithms by Kathleen A. Fairman, David Romanet, Nicole K. Early and Kellie J. Goodlet in Journal of Cardiovascular Pharmacology and Therapeutics
Footnotes
Authors’ Note
Author Contribution
All authors contributed to concept and design of this study. Kathleen A. Fairman and David Romanet analyzed the data. Kathleen A. Fairman drafted the manuscript. All authors contributed to critically revising the manuscript. All authors gave final approval and agree to be accountable for all aspects of work ensuring integrity and accuracy.
Declaration of Conflicting Interests
The author(s) declared no potential conflicts of interest with respect to the research, authorship, and/or publication of this article.
Funding
The author(s) disclosed receipt of the following financial support for the research, authorship, and/or publication of this article: This research was supported by Midwestern University College of Pharmacy-Glendale. The research received no specific grant from any funding agency in the public, commercial, or not-for-profit sectors.
Supplemental Material
Supplemental material for this article is available online.
References
Supplementary Material
Please find the following supplemental material available below.
For Open Access articles published under a Creative Commons License, all supplemental material carries the same license as the article it is associated with.
For non-Open Access articles published, all supplemental material carries a non-exclusive license, and permission requests for re-use of supplemental material or any part of supplemental material shall be sent directly to the copyright owner as specified in the copyright notice associated with the article.