
Abstract
Introduction:
The Langendorff perfused isolated mouse heart model is commonly used to assess the efficacy of cardioprotective therapies, although the duration of ischemia and reperfusion vary considerably between different laboratories. We aimed to provide a thorough characterization of the model with different durations of ischemia and reperfusion by means of 2 different end points—infarct size (IS) using triphenyltetrazolium staining and lactate dehydrogenase (LDH) release.
Methods:
C57/BL6 mice hearts were retrograde perfused on a Langendorff apparatus and allocated into 9 groups in a 3 × 3 factorial design—3 ischemic durations (25, 35, and 45 minutes) matched by 3 reperfusion durations (60, 120, and 180 minutes). A protocol of ischemic preconditioning (IPC) was applied to investigate IS and LDH kinetics with different ischemic durations.
Results:
Infarct size progressively increased with the duration of both ischemia and reperfusion and was found to be independently associated with both determinants. In terms of LDH release kinetics, a peak was observed within the first 10 to 15 minutes of reperfusion and steadily declined thereafter, although a second smaller peak was observed in the 25-minute ischemia group. Only LDH peak release was associated with the ischemia length, with area under the curve (AUC) failing to follow ischemic duration. Interestingly, while IPC reduced IS in all ischemic durations investigated, a significant attenuation of LDH AUC was only observed in the 25-minute index ischemia group. Only a moderately positive correlation was observed between IS and LDH peak (R = .547, P = .006) and AUC (R = .664, P < .001).
Conclusion:
Myocardial IS measured by triphenyltetrazolium staining depends on both the duration of ischemia and the length of the reperfusion period. The LDH assessment may not be the most reliable tool to assess IS and/or to examine cardioprotective effectiveness at various times of ischemia.
Introduction
The Langendorff isolated perfused mouse heart is an invaluable tool in cardiovascular research, particularly for assessing the cardioprotective efficacy of novel therapies. 1 Although technically challenging, the mouse Langendorff model has become particularly popular due to the availability of genetic engineering techniques that allow the overexpression or disruption of specific gene products, providing a powerful tool to elucidate the role of signaling pathways involved in ischemia–reperfusion (IR) injury.
Thorough characterization and validation of this ex vivo model of IR injury is an essential but frequently neglected step prior to important conclusions being drawn from the data they generate. Although the ex vivo model has excellent interoperator reproducibility provided consistent ischemia and reperfusion times are applied, 1,2 it is worth noting that different lengths of the ischemia and reperfusion periods vary considerably between different laboratories. 3 –5 Such discrepancies emphasize the need to better characterize the perfused murine model, even more considering that such methodological details have rarely been published. 6,7
Although the impact of the ischemia duration on final infarct size (IS) is well described, little is known about the optimal duration of the reperfusion period. A small number of studies have attempted to characterize the effects of ischemia and reperfusion length as independent variables in the isolated mouse heart model, 6,8,9 concentrating on either varying the length of ischemia or the length of reperfusion. Even less studies have monitored the injury wavefront with surrogate biomarkers, such as lactate dehydrogenase (LDH), which, compared to infarct staining, offers the advantage of tracking the injury at several time points within the same heart.
We developed a factorial design model of IR injury using 2 end points in order to provide a step-by-step description of the Langendorff perfused isolated mouse heart model with the following aims: (1) to determine whether the final IS is dependent on both the duration of ischemia and the length of the reperfusion period; (2) to describe the LDH release pattern after 180 minutes of reperfusion as well as the area under the curve (AUC) and its peak; (3) to describe the impact of ischemic preconditioning (IPC) on IS and LDH release after 180 minutes of reperfusion; and (4) to determine the correlation between both end points, that is, IS and LDH release.
Materials and Methods
All procedures were performed in The Hatter Cardiovascular Institute, University College London, in strict accordance with the Home Office (United Kingdom) Guidance on Research and Testing using animals and the Animals (Scientific Procedures) Act of 1986.
Animals
Animals used were male C57/BL6 mice (9-12 weeks, 24-28 g weight), all of them obtained pathogen free from 1 supplier and housed under identical conditions.
Study Protocol
A total of 65 animals were used, although 8 were excluded before randomization as they accomplished predefined exclusion criteria. Before starting the study protocol, 57 animals were allocated according to a randomized complete block design.
The study was divided into 3 consecutive parts, as illustrated in Figure 1:
Effect of ischemia and reperfusion length on IS (Figure 1A). Thirty-six mice were divided into 9 groups in a 3 × 3 factorial design, including 3 categories of ischemic length (25, 35, and 45 minutes) and 3 periods of reperfusion length (60, 120, and 180 minutes), each group containing 4 mice. The LDH release during reperfusion were measured in coronary effluent aliquots sampled at selected time points in mice that underwent 180 minutes of reperfusion (n = 12), in order to determine the release pattern, AUC, and peak of LDH.
Effect of ischemia length on IS and release kinetics of LDH on preconditioned hearts (Figure 1B). Twelve mice were subjected to IPC at different ischemic periods lasting for 25, 35 or 45 minutes (n = 4 per group). The IPC consisted of 4 cycles of 5 minutes of global ischemia and 5 minutes of reperfusion prior to index the ischemia.
Infarct size and LDH assessment in negative and positive controls (Figure 1C). A negative control (n = 3) was performed in order to assess the final IS and the surrogate LDH release under no ischemic insult and maximum length of reperfusion (180 minutes). Two positive controls were allocated into 2 groups (60 and 180 minutes of reperfusion, n = 3 per group), in order to assess the effect of reperfusion length on final IS after a maximal prolonged ischemic insult (90 minutes), designed to mediate 100% IS and maximal LDH release.

Study design. Overview of the study including subgroups and experimental protocols. The black cross indicates that LDH samples were collected. A black box represents a period of ischemia and a white box represents a period of perfusion with Krebs-Henseleit buffer at 80 mm Hg. IPC indicates ischemic preconditioning; LDH, lactate dehydrogenase.
The sample size for groups 1 and 2 was determined for IS as primary outcome (expressed as a percentage of the global myocardium at risk), based on previous results from our laboratory. 10,11
Langendorff Isolated Perfused Mouse Heart
Mice were given terminal anesthesia and anticoagulation with an intraperitoneal injection of 60 mg/kg sodium pentobarbitone and 100 IU heparin, respectively. Hearts were then harvested and immediately submerged in ice-cold modified Krebs-Henseleit buffer (see subsequently for composition). Hearts were then swiftly cannulated with a 21-gauge cannula and the heart retrogradely perfused on a murine Langendorff perfusion apparatus at 80 mm Hg pressure.
Heart isolation and Langendorff perfusion were carried out with filtered modified Krebs-Henseleit buffer (composed of 118 mmol/L NaCl, 25 mmol/L NaHCO3, 11 mmol/L glucose, 4.7 mmol/L KCl, 1.22 mmol/L MgSO4.7H20, 1.21 mmol/L KH2PO4, and 1.84 mmol/L CaCl2.2H20) aerated with a mixture of O2 (95%) and CO2 (5%) in order to maintain pH at 7.42 ± 0.3, as described previously. 12
Predefined exclusion criteria were as follows: (1) If the time between cessation of blood circulation and the start of perfusion in the Langendorff mode was greater than 4 minutes; (2) if the temperature was above or below the 37°C ± 0.5°C range; and (3) if the isolated hearts had a buffer flow rate of less than 1 mL/min or more than 6.5 mL/min on the Langendorff preparation during the stabilization period. After observing for exclusion criteria in an initial stabilization period of 20 minutes, the hearts were subjected to the experimental protocols, as illustrated in Figure 1.
Myocardial IS
After global normothermic ischemia, IS was determined by injecting 5 mL of 2,3,5-triphenyltetrazolium chloride (TTC) in phosphate-buffered saline through the aortic cannula and incubating the heart for 10 minutes at 37°C in order to demarcate the infarcted (white) versus viable (red) tissue. 13 After the incubation, the heart was weighed and then frozen overnight at −20°C. Following this, it was sectioned perpendicular to the long axis, and the slices transferred into 10% neutral formalin buffer for 1 hour.
Images were taken and coded in order to blind the analyzer. Planimetry analysis using Image J version 1.47 (NIH, Bethesda, MD) was carried out to accurately quantify the percentage of IS in each heart as a proportion of the total heart volume.
Release of LDH
Lactate dehydrogenase, an unbound intracellular enzyme localized in the cytosol and released to the extracellular compartment by sarcolemmal membrane damage, is commonly used as a surrogate marker of cellular injury in cardiovascular research. 14 –16 The LDH was measured for dynamic monitoring of cellular damage with the experiments lasting 180 minutes of reperfusion.
Coronary effluent samples were collected at 5, 10, and 15 minutes from start of reperfusion, and then every 15 minutes until minute 180—a total of 14 samples were collected per heart. The flow rate was measured each time a LDH sample was collected. The samples were stored on ice until the end of each experiment. Lactate activity in the perfusate was then determined by means of a commercially available assay kit (CytoTox 96 Non-Radioactive Cytotoxicity Assay; Promega, United Kingdom).
The measured concentration was corrected for coronary flow and heart weight, according to previous studies. 6,7,15 Thus, it was calculated as the product of effluent concentrations (pg × mL−1) × coronary flow (mL × min−1 × g−1; LDH concentration × coronary effluent/weight) and consequently expressed as pg × g−1 × min−1. The supplementary table provide the crude data on the basis of which the adjusted LDH was calculated.
Factorial Study Design
A complete factorial design was used in order to assess the effect of 2 factors (the independent variables), known as ischemia and reperfusion length and each one represented by 3 equally spaced categories (25, 35, and 45 minutes and 60, 120, and 180 minutes, respectively), into the final IS measured by TTC staining (dependent variable). The observations were summarized in a 2-way table (Table 1), where each entry is the mean of all observations, and all combination of categories are represented equally (n = 4). Such a harmonic design allowed us
17
:
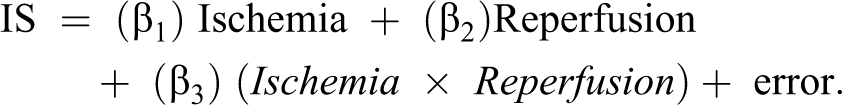
To estimate the separate effects on IS between different categories of one of the factors, but within the same category of the other factor, that is—to compare the IS between different ischemia length within the 60 minutes of reperfusion length. These effects are represented by the pallid gray boxes in the table. To estimate the main effect of each one of the factors, represented by the row and column averages shown in the margin of the table (highlighted in dark gray). We define the main effect of ischemia (averaged over the 3 categories of reperfusion), as the difference that can be observed with the row averages at the right of the table and vice versa with reperfusion (column averages at the bottom). In other words, we estimate whether the effects of the 2 factors are additive and they are interacting independent of one another. To enable the interaction between both factors to be explored. The 2-factor interaction ischemia ×reperfusion determines whether the effect of ischemia is the same for all categories of reperfusion, that is, whether the change in increasing ischemia length is constant along the different reperfusion durations and vice versa. Of note, the prespecified sample was underpowered for this purpose. To estimate the overall significance of a model (black box of the table), formed by the 2 main effects and their interaction. The overall model is a simple equation, summarized as:
Effect of Ischemia and Reperfusion Length on Myocardial Infarct Size (%).a

aEach of the relevant numbers in the reperfusion to ischemia 2-way table corresponds to the mean percentage infarct size (IS) of 4 animals. Data are expressed as mean ± standard error of the mean (SEM). The pallid gray entries illustrate the separate effects, while the dark gray represents the main effects, and the black color illustrates the mean IS of all the animals and the P value of the overall model.
The final output of the equation is the amount of IS determined by the parameters included in the equation. Although this might seem very attractive, the extrapolation of such results should be taken cautiously, since we only considered ischemia duration and reperfusion length as determinants of IS, while in the clinical setting, other factors play an important role—that is, presence of collaterals.
To summarize, although the degree of symmetry of our design offers a hierarchical model of multiple comparisons, we aimed to study the separate and main effects rather than the interaction effect and the model as a whole.
Statistical Analyses
All values are presented at mean ± standard error of the mean. Normal distribution was assessed by means of the Kolmogorov-Smirnov test. Linear trend test was used for comparisons on IS between groups (%) as well as to compare AUC and peak of LDH between groups. The interaction and the overall effect of the model were assessed by means of a general linear model. The Student t test was used to compare IS (%) between control and IPC groups in the cohort of 180 minutes of reperfusion. Association between IS and peak or AUC LDH were analyzed by the Pearson correlation coefficient test. A P value <.05 was considered significant. IBM SPSS Statistics software, v.20.0 (IBM Corp Armonk, New York) was used for the main statistical analysis. STATA software, version 13.1 (Stata Corp, College Station, Texas) was used to generate the randomization sequence and to calculate and compare the AUC between the groups. GraphPad Prism version 6.00 (GraphPad Software, La Jolla California) was used to perform the graphics. The results were reported according to the Animal Research: Reporting of In Vivo Experiments (ARRIVE) guidelines for reporting animal research. 18
Results
Effect of Ischemia and Reperfusion Length on IS Measured by TTC Staining
All the results obtained by the 3 × 3 factorial study are summarized in Table 1. In summary: The impact of ischemic and reperfusion duration, as illustrated by the pallid grey entries in the table, show how there is a trend toward an increased IS when the ischemia and reperfusion lengths are progressively prolonged. Table 1 reflects the consistency of the results in each of the 6 comparisons, showing how IS increased from the top-left of the table to the bottom-right. Figure 2 graphically illustrates the same trend. The main effect of each one of the factors, represented by the row and column averages shown in the margin of the table (highlighted in dark gray): The length of ischemia has an impact on the final IS independent of the length of reperfusion. In the same way, the length of reperfusion also has a systematic impact on the final IS in each of the ischemia duration groups. In other words, IS increases significantly with the duration of ischemia, independent of reperfusion length and vice versa. No interaction was observed between ischemia and reperfusion (P = .773), meaning that the effect of ischemia and reperfusion lengths have an increasing but proportional impact in all categories as the length is increased, although the observed power to assess this interaction was 13.8%. Finally, the overall model, including ischemia length, reperfusion duration, and their interaction significantly explain the IS (P = .001).
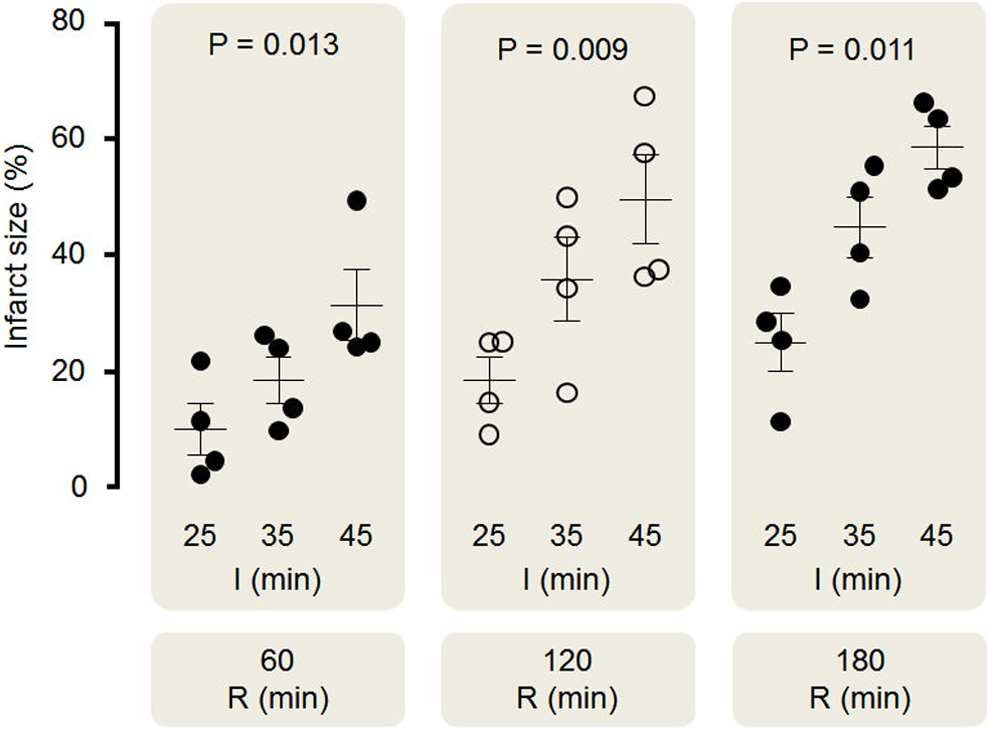
Effect of ischemia and reperfusion length on myocardial infarct size (%). Scatter dot blots: black lines represent mean ± SEM for infarct size (%) and circles represent individual animal data. Infarct size consistently increased with increasing durations of ischemia and reperfusion in control hearts. I indicates ischemia; R, reperfusion; SEM, standard error of the mean.
Release of LDH after 180 Minutes of Reperfusion
Release of LDH during reperfusion was measured in mice that underwent 180 minutes of reperfusion (n = 12). Figure 3 shows the LDH pattern release for each group of ischemia length as well as the AUC and the peak comparison between groups.
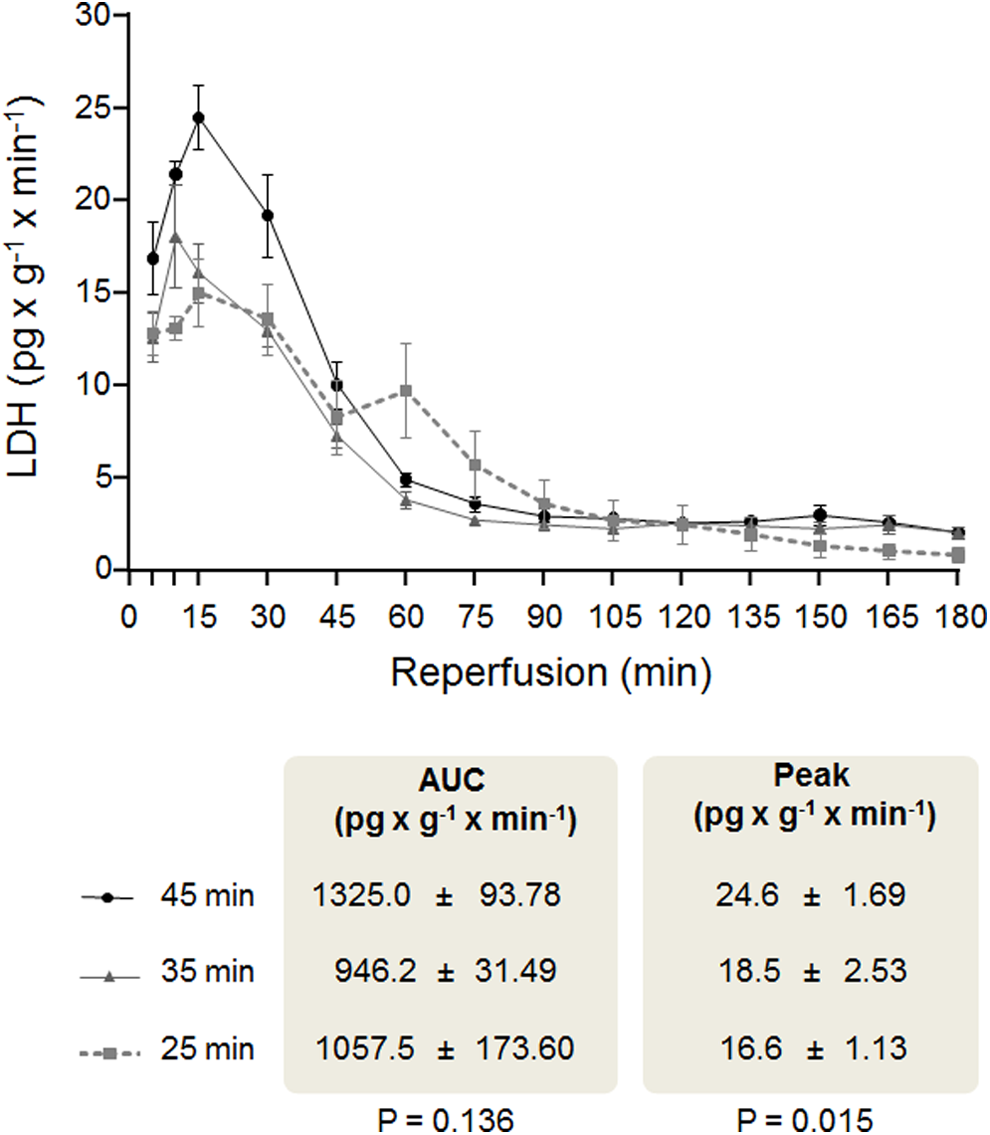
The LDH release during reperfusion in hearts under 180 minutes of reperfusion. Comparison between LDH release in hearts that underwent different ischemia lengths and 180 minutes of reperfusion. Each point represents 4 animals and is plotted with their mean and SEM. The AUC and peak between groups were compared by mean of a linear trend test. AUC indicates area under the curve; LDH, lactate dehydrogenase; SEM, standard error of the mean.
A progressive increase in LDH occurred during the first 10 to 15 minutes of reperfusion, followed by a progressive decline after reaching this peak. A consistent second LDH peak was observed at 60 minutes of reperfusion but only in the group of 25 minutes of ischemia. At 90 minutes of reperfusion, a plateau release phase was observed in all groups.
Unlike IS measured by TTC staining, the AUC of the LDH did not differ significantly between groups. Nevertheless, the peak of the LDH was associated with the ischemia length, meaning the greater the ischemic duration, the greater the peak of LDH release.
Effect of IPC on IS and Release Kinetics of LDH
Twelve mice were subjected to IPC at different ischemic periods lasting for 25, 35, or 45 minutes (n = 4 per group), all of them underwent 180 minutes of reperfusion (Figure 4). Ischemic preconditioning resulted in reduction in IS in all ischemic duration groups: 25-minute ischemia (25.2 ± 4.90 vs 11.9 ± 1.99, P = .045); 35-minute ischemia (44.9 ± 5.15 vs 25.6 ± 6.91, P = .066); and 45-minute ischemia (56.7 ± 3.63 vs 38.5 ± 3.09, P = .006).

Effect of ischemia length and ischemic preconditioning on myocardial infarct size. Infarct size was increased with increasing durations of ischemia in both control and preconditioned hearts, although IPC systematically showed a lower infarct size at all ischemia lengths. I indicates ischemia; IPC, ischemic preconditioning, R, reperfusion.
Pattern of LDH release, AUC, and peak of LDH were compared in control and IPC hearts that underwent 180 minutes of reperfusion, as shown in Figure 5. Noteworthy, IPC significantly attenuated the AUC in the 25-minute index ischemia group, while in this group, the peak showed a reduction toward significance in the IPC group compared to control. The AUC and peak of LDH release were not different in statistical terms after IPC in both groups of 35 and 45 minutes of ischemia.

The LDH release during reperfusion in control and IPC hearts under 180 minutes of reperfusion. Comparison between LDH release in control and preconditioned hearts, allocated in different groups of ischemia lengths. Each point represents 4 animals and is plotted with their mean and SEM. The AUC and peak between groups were compared by a t test in each group. AUC indicates area under the curve; IPC, ischemic preconditioning; LDH, lactate dehydrogenase; SEM, standard error of the mean.
Correlation Analysis Between LDH Assessment With Myocardial IS
In all mice that underwent 180 minutes of reperfusion (n = 24), a correlation was used in order to evaluate the strength of the association between the IS measured by TTC staining and the AUC and peak of LDH.
Figure 6 shows the correlation between the AUC of LDH release and myocardial IS. Although the association was statistical significant (R = .664, P < .001), the strength of the correlation was moderate. The relation between the LDH peak and myocardial IS was even weaker (r = .547, P = .006).

Correlation analysis between LDH AUC and peak with myocardial infarct size. The scatter plot (n = 24) shows a positive correlation between the AUC of LDH release and myocardial IS, while a weaker association was found between LDH peak and IS. AUC indicates area under the curve; LDH, lactate dehydrogenase; IS, infarct size.
Infarct Size and LDH Assessment in Negative and Positive Controls
Negative controls without index ischemia (n = 3), but after 4 hours and 45 minutes of Langendorff perfusion, presented an IS of 3.1% ± 0.51%, with a small and constant release of LDH (AUC of 12.67 ± 0.67 and peak of 0.5 ± 0.16 pg × g−1 × min−1). These data are consistent with the anticipated slow deterioration of an isolated-perfused organ system but demonstrate that perfusion alone does not represent a significant contribution to the final IS.
Positive controls that underwent 90 minutes of index ischemia were allocated into 2 groups: Mice under 60 minutes of reperfusion presented an IS of 58.9% ± 3.85%, while in mice with 180 minutes of reperfusion, IS was 92.6% ± 1.59%.
The postischemic enzyme leakage calculated in these mice was lower than any of the 25, 35, or 45 minutes of ischemia index control groups (AUC = 938.3 ±3 7.26; peak 16.7 ± 2.80 pg × g−1 × min−1). Despite the absolute LDH release concentration being relatively high (see Supplementary Table), the coronary flow was further impaired, affecting the final result of the concentration adjusted by the coronary flow.
Perhaps somewhat paradoxically, postischemic AUC enzyme leakage was not increased in the positive control after 90 minutes of ischemia. This might be explained as an artifact of the formula to calculate the LDH concentration: The longer the ischemic duration, the lower the coronary flow rate during reperfusion. This was particularly prominent following 90 minutes of ischemia, raising the possibility that LDH washout might be impaired following 90 minutes of infarction, and the formula to adjust the LDH was highly affected by this denominator, reflecting an underestimated value when the flow rate is extremely low.
Discussion
Main Findings
In the present study, we describe important methodological aspects of the mouse ex vivo model of IR injury and provide evidence that: The percentage of myocardial IS measured by TTC staining depends both on duration of ischemia and on reperfusion lengths. After 180 minutes of reperfusion, there was no difference in the LDH release pattern or the AUC, although the peak of LDH was significantly different between the groups. After 180 minutes of ischemia, IPC showed protection at different ischemic lengths compared to control hearts in terms of IS, although there were no differences in the LDH release pattern. Only the 25-minute preconditioned hearts showed a reduction in the AUC and peak compared to their controls. The AUC and peak of LDH have a positive correlation with myocardial IS, although it was not strong enough to being used as an accurate surrogate biomarker.
Effect of Ischemia and Reperfusion Length on IS Measured by TTC Staining
To our knowledge, this is the first systematic study with a 3 × 3 factorial design showing a mutual impact of ischemia and reperfusion length on myocardial IS in mice ex vivo. Only 1 previous study used a similar factorial design in order to study the interdependency of ischemia and reperfusion in an in vivo mouse model. 19 Compared to 1 factor at a time approach of previous studies, 6,9,15,20 the factorial design presents the advantage of giving greater perspective in order to thoroughly analyze the impact of each different periods of ischemia and reperfusion.
Infarct size, measured by TTC staining, is independently associated with the durations of both ischemia and reperfusion. The fact that increasing the ischemia index increases the IS is well known, and it is considered the main determinant of the IS in the clinical setting. 21 –24 More controversial is the finding that myocardial IS increases with prolonged periods of reperfusion. Some authors reported that 1 hour of reperfusion in a rat model was sufficient to demark infarct zones with no additional infarction occurring with longer periods of reperfusion. 20,25 Nevertheless, the majority of studies in different species published previously are in accordance with our finding. 15,26 Of note, a plateau on IS was not reached, suggesting that even 180 minutes was not the maximum IS achievable. However, it should also be noted that other limitations are present with longer reperfusion periods in the Langendorff model, and therefore the cut off of 180 minutes was chosen as optimal in this model. Noteworthy, some interventions that effect reperfusion, such anti-inflammatory agents, might require longer reperfusion periods in order to accurately assess the size of the evolving myocardial infarction, thus stressing the limitation of the Langendorff model in this particular setting.
This issue inevitably leads us to discuss the optimal duration of ischemia and reperfusion in experimental protocols. Our results in Table 1 show how that the differences between protocols are consistent, linear, and quite equidistant, suggesting that any ischemia/reperfusion duration protocol can be appropriate depending upon the hypotheses one wishes to interrogate. To mimic the clinical scenario, where infarcts are typically comparatively small (around 20%-30% of total LV mass 27 ), the use of an experimental infarction protocol that results in an equivalent injury might be appropriate to test an already experimentally demonstrated cardioprotective therapy, while a protocol leading to larger infarcts, with a greater chance to reduce IS, might be useful to test a completely novel therapy in the experimental setting. In any case, within 180 minutes of reperfusion, IPC was shown to be cardioprotective in both 25 and 45 minutes of ischemia and a trend toward significance in the 35 minutes of ischemia, which might become significant if the sample size was increased. The demonstration of the effectiveness of IPC in the experimental groups tested in our study means that it is possible to apply different index ischemic protocols to the cardioprotective intervention being investigated. However, it should be noted that Murry et al demonstrated that the IPC effect is abrogated after prolonged ischemia in dogs. 28
This study was not designed to establish the presence of an interaction between ischemia and reperfusion, and the results cannot be interpreted in this way since the observed power is too small. However, no extensive interaction is suspected since the absolute change in IS between different ischemia and reperfusion lengths are quite parallel and constant.
Release of LDH After 180 Minutes of Reperfusion
We evaluated the enhanced leakage of LDH following IR injury, showing the pattern, AUC, and peak after different ischemia lengths and following IPC. The pattern of the LDH release presented an early peak at 10 to 15 minutes of reperfusion, followed by a progressive declining release until a plateau phase is reached at 90 minutes of reperfusion. This result contradicts a recent study by Botkers group showing a biphasic pattern of LDH release in rats, with the second phase modifiable by IPC. 15 Although we did not reproduce the same results in mice, our findings in the 35- and 45-minute index ischemia groups are in agreement their studies in mice (Prof Hans Erik Bøtker, MD; June 9, 2015; Email). We might speculate that this difference may purely be a species effect with the mouse having less coronary flow than the rat, therefore the increased washout period of LDH might blunt the second smaller peak of LDH release. In contrast to the monophasic pattern of LDH following either 35 or 45 minute of ischemia, a consistent biphasic LDH release pattern was observed following 25 minutes of global ischemia in mouse, observed at 60 minutes. Therefore, it appears that the biphasic LDH release pattern, seen so clearly in the rat, is only observed in mouse heart following less injurious ischemic insult durations. Why this might be the case is unclear but may be an important observation when considering the use of AUC LDH as a surrogate for histological-based cell death assays.
In contrast to the AUC of LDH release, the peak of the LDH release curve was associated with the duration of ischemia. The optimum sampling time point for peak LDH release in the evaluation of myocardial IR injury has recently been proposed to be 60 minutes. 20 Our data are in concurrence with this: The LDH release time course revealed a peak that occurred predominantly between 60 and 90 minutes in both controls and IPC-treated hearts.
Curiously, despite IPC significantly attenuating IS as determined by TTC, we did not find a significant reduction in either AUC or peak of LDH following more prolonged (35 or 45 minute) ischemic lengths. Only following the less injurious 25-minute ischemic insult, we observed a significant attenuation of LDH AUC with IPC, while the LDH peak fell just short of statistical significance. Our observations are again consistent with previous reports demonstrating that enzyme efflux tends to match IS outcome following short ischemic periods but not following more injurious ischemic insults. 6
Assessment of LDH and Myocardial IS Correlation: Is LDH a Good Surrogate Marker of IS?
Development of models with various end points of injury may result in a more comprehensive characterization of the myocardial insult, enabling more meaningful conclusions to be drawn from experimental studies. Tetrazolium staining is the most popular method to assess IS as well as to test the efficacy of cardioprotective therapies. Other surrogate end points have been used such as enzyme release, recovery of postischemic function, and assessment of arrhythmias.
In our study, the LDH AUC demonstrated a better correlation than the LDH peak as a surrogate of myocardial IS but only in experiments with a less injurious ischemic duration. Moreover, the strength of the correlation was not enough to be comparable to an unequivocal end point such as TTC staining, making LDH assessment unsuitable to be used as a biomarker to test cardioprotective therapies. From a technical point of view, the moderate correlation between IS and LDH AUC or peak could be explained as (1) the considerable variability and large standard errors in absolute LDH concentration; (2) the dependence on factors such coronary flow effluent; and (3) the fact that main LDH release occurs within the first 90 minutes of reperfusion, making subsequent sample collection largely superfluous.
Our data therefore highlight a number of challenges when it comes to measuring IS in the mouse heart. In our hands, we found that IS was proportional to the duration of reperfusion. These data suggest that there is either evidence of ongoing and accumulative “wave of reperfusion injury” in this model or, more likely, there is a problem with the methods being used to determine the IS. Given that the release of LDH appears to have largely abated after 90 minutes of reperfusion supports the latter explanation, TTC staining relies on the ability of dehydrogenase enzymes and cofactors in the tissue to react with tetrazolium salts to form a formazan pigment 13 and needs a sufficient period of washout. Following an ischemic insult of 90 minutes, our results show a greater IS after 180 minutes of reperfusion length, compared to the IS after 60 minutes of reperfusion, suggesting that the positively stained tissue is probably not healthy and may die later or that the washout did not take place yet or was not sufficient and as such gave a false-positive result, although a “no-reflow” phenomenon 29 cannot be excluded. In agreement with the literature, 26 we can affirm that the longer the reperfusion period after an ischemic insult, the more reliable the method becomes for discriminating between dead and viable tissue.
Study Limitations
We used an isolated unloaded, ventricular empty mice heart model. Whether the same release pattern applied to other animal species and other models is unknown. The high heart rate of the mouse should be taken into account because it might have an impact on the washout and the subsequent TTC staining and LDH release.
We did not use functional assessment in order to assess the effect of ischemia and reperfusion length, avoiding potential manipulation injury. This might be considered as a limitation, since many groups use an intraventricular balloon in such studies. However, it has been shown that an intraventricular balloon can influence salvage pathways. 30 Following the same rationale of avoiding any additional stress, we did not record heart rhythm, and consequently we did not apply any heart rate exclusion criteria. Finally, although the no-reflow phenomenon has been well reported in isolated heart models in which hearts are perfused only with crystalloid buffer, 29,31 we did not did not study this effect in our isolated mouse perfused model and cannot dismiss the fact that TTC staining might not be reached in some no-reflow areas.
Conclusion
We report a thorough characterization of the Langendorff isolated perfused mouse heart following IR injury. Myocardial IS measured by triphenyltetrazolium staining depends on both the duration of ischemia and the length of the reperfusion period. Thus, the longer the reperfusion length, the greater the IS, even after a prolonged ischemic insult. Moreover, LDH assessment may not be the most reliable tool to assess IS and/or to examine cardioprotective effectiveness at various times of ischemia.
Footnotes
Authorship Contribution
Rossello, X contributed to conception and design, acquisition, analysis, and interpretation, drafted the manuscript, critically revised the manuscript, gave final approval, and agreed to be accountable for all aspects of work ensuring integrity and accuracy. Hall, A and Bell, R critically revised manuscript, gave final approval, and agrees to be accountable for all aspects of work ensuring integrity and accuracy. Yellon, DM contributed to design and interpretation, drafted the manuscript, critically revised the manuscript, gave final approval, and agreed to be accountable for all aspects of work ensuring integrity and accuracy.
Authors’ Note
The work reported was done at The Hatter Cardiovascular Institute, University College London.
Declaration of Conflicting Interests
The author(s) declared no potential conflicts of interest with respect to the research, authorship, and/or publication of this article.
Funding
The author(s) disclosed receipt of the following financial support for the research, authorship, and/or publication of this article: This work was partly founded by research grants from the European Society of Cardiology and the Spanish Society of Cardiology. This work was undertaken at UCLH/UCL who received a proportion of funding from the Department of Health’s NIHR Biomedical Research Centres funding scheme of which DM Yellon is a Senior Investigator.
References
Supplementary Material
Please find the following supplemental material available below.
For Open Access articles published under a Creative Commons License, all supplemental material carries the same license as the article it is associated with.
For non-Open Access articles published, all supplemental material carries a non-exclusive license, and permission requests for re-use of supplemental material or any part of supplemental material shall be sent directly to the copyright owner as specified in the copyright notice associated with the article.