
Abstract
Purpose:
To determine steady state milrinone concentrations in patients with stage D heart failure (HF) with and without renal dysfunction
Methods:
We retrospectively identified patients with stage D HF at a single medical center on continuous milrinone infusion at the time of plasma collection for entry into a research registry database. Milrinone was prescribed and titrated to improve hemodynamic and clinical status by a cardiologist. Plasma samples were obtained at steady state milrinone concentrations. Patients were stratified by creatinine clearance (CrCl) into 4 groups: group 1 (CrCl >60 mL/min), group 2 (CrCl 60-30 mL/min), group 3 (CrCl <30 mL/min), and group 4 (intermittent hemodialysis). Retrospective chart review was performed to quantify the postmilrinone hemodynamic changes by cardiac catheterization and electrophysiologic changes by implantable cardiac defibrillator (ICD) interrogation.
Results:
A total of 29 patients were identified: group 1 (n = 14), group 2 (n = 10), group 3 (n = 3), and group 4 (n = 2). The mean infusion rate (0.391 ± 0.08 µg/kg/min) did not differ between groups (P = 0.14). The mean milrinone concentration was 451± 243 ng/mL in group 1, 591 ± 293 ng/mL in group 2, 1575 ± 962 ng/mL in group 3, and 6252 ± 4409 ng/mL in group 4 (P<0.05 compared to groups 1). There was no difference in postmilrinone hemodynamic improvements between the groups (P=0.41). The ICD interrogation revealed limited comparisons, but 6 of the 8 postmilrinone ventricular tachycardia episodes requiring defibrillation occurred in group 4 patients.
Conclusion:
Patients with stage D HF having severe renal dysfunction have elevated milrinone concentrations. Future studies of milrinone concentrations are warranted to investigate the potential risk of life-threatening arrhythmias and potential dosing regimens in renal dysfunction.
Introduction
Improved heart failure (HF) management has resulted in an increasing number of patients surviving to experience stage D HF, potentially requiring chronic inotropic therapy as a bridge to heart transplantation or ventricular assist device. 1 –7 In the Acute Decompensated Heart Failure National Registry (ADHERE), milrinone was prescribed in 32% of the patients requiring inotropic therapy. 8 By inhibiting type 3 phosphodiesterase, milrinone increases cyclic adenosine monophosphate (AMP) and intracellular calcium, displaying both inotropic and vasodilator properties. 9,10 Milrinone exhibits a sigmoidal relationship between the plasma concentrations and the percentage of cardiac index (CI) improvement across the concentrations of 100 to 300 ng/mL, with little additional hemodynamic benefit above 500 ng/mL. 10,11
Accumulation of milrinone in renal dysfunction is expected, given 80% to 90% of milrinone is renally excreted. Previous pharmacokinetic studies in renal dysfunction were too brief to quantify steady state milrinone plasma concentrations. 12,13 As milrinone concentrations are not measured in clinical practice, product information recommends a lower initial infusion rate for renal dysfunction with adjustment to hemodynamic and clinical response. 10 The HF databases report more than 1 in 4 patients on inotropes have a serum creatinine (SCr) >2 mg/dL. 8,14,15 Despite this high incidence, little data currently exist on steady state plasma milrinone concentrations in renal dysfunction and the possible consequences of chronically elevated plasma concentrations. Milrinone has been associated with hypotension and increased atrial and ventricular arrhythmias, 16 –20 with a correlation between arrhythmia incidence and plasma concentration hypothesized. 19,21 Thus, we sought to determine whether elevated plasma milrinone concentrations would be present in patients with stage D HF on chronic milrinone infusions with renal dysfunction compared to patients with normal renal function.
Methods
The Vanderbilt Heart and Vascular Institute’s Main Heart Registry collects patient data and stores a plasma sample at −80°C after patient consent. After institutional review board approval, patients with stage D HF enrolled in the Heart Registry, who were receiving continuous milrinone infusions at the time of enrollment, were identified. Patients were stratified into 4 groups based on creatinine clearance (CrCl): group 1 (CrCl >60 mL/min), group 2 (CrCl 60-30 mL/min), group 3 (CrCl <30 mL/min), and group 4 (intermittent hemodialysis) using the SCr at the time of plasma collection for calculation of CrCl using the Cockcroft-Gault equation. All pharmacotherapy decisions, including milrinone infusion rate and defibrillator implantation, programming, and interrogation decisions were made at the discretion of each patient’s attending cardiologist. Milrinone plasma concentrations were measured from the frozen plasma sample. To ensure milrinone plasma concentrations were at steady state, group 1 patients were excluded if the infusion rate was altered less than 12 hours before plasma collection based on a half-life of 2.4 hours. 10 Patients in group 2 were excluded if the infusion rate was changed 24 hours before plasma collection, and groups 3 and 4 patients could not have an infusion rate change in the previous 100 hours. 21,22
A retrospective review of the electronic medical record was performed to record baseline characteristics, hemodynamic measurements, and electrophysiologic parameters. Investigators were blinded to renal function grouping. The group 4 patient (4A) receiving Monday/Wednesday/Friday hemodialysis had a plasma sample drawn just before hemodialysis using a Fresenius Optiflux F180 dialyzer (Fresenius Medical Care, Waltham, MA) with a Centrisol Part A dialysate (Medivators, Minneapolis, MN) over 3.5 hours to remove 2.4 L. Two posthemodialysis plasma samples were then drawn immediately after dialysis and 24 hours later. Only the sample drawn 24 hours after hemodialysis was used in statistical analyses. The group 4 patient (4B) receiving daily hemodialysis had a plasma sample drawn after the third consecutive day of hemodialysis using a F180 dialyzer over 4 hours to remove 3.1 L.
Hemodynamic and Electrophysiologic Evaluations
Hemodynamic parameters, including CI, pulmonary capillary wedge pressure (PCWP), pulmonary vascular resistance (PVR), pulmonary artery pressure, and pulmonary artery oxygen saturation, were assessed during right heart catheterization before milrinone initiation and compared to a repeat catheterization after milrinone was at steady state. Cardiac output was measured by thermodilution and the Fick method, and the CI was calculated by body surface area. Electrophysiologic changes were quantified by retrospective chart review of the implantable cardiac defibrillator (ICD) interrogations. The ICD reports of arrhythmia burden before milrinone initiation were compared to postmilrinone ICD reports. The ICD reports were evaluated for atrial arrhythmias, episodes of nonsustained ventricular tachycardia (NSVT), episodes of ventricular tachycardia (VT) or ventricular fibrillation, number of antitachycardia pacing episodes, number of defibrillations delivered, and quantification of premature ventricular complexes (PVCs) as available in the report.
Pharmacokinetic Analyses
Sample analyses were carried out using a Waters Acquity Ultra Performance Liquid Chromatography system coupled with tandem mass spectrometry using a triple-stage quadrupole mass spectrometer (TSQ Quantum Ultra by Thermo-Fisher, Waltham, MA). The internal standard used was 4-methyl-2-oxo-6-phenyl-1,2-dihydro-3-pyridinecarbonitrile (MOPDC). A binary mobile phase of 0.2% (v/v) HCOOH and 2 mmol/L perfluoropentanoic acid in water (A) and in 5% water/95% acetonitrile (B) was used for all chromatographic separations on an Acquity HSS C18 column (2.1 × 150 mm2, 1.7 µm). Tandem mass spectrometric quantitation was based on multiple reaction monitoring in positive ion mode.
Calibration curves were constructed by plotting peak area ratios (milrinone/MOPDC) against milrinone concentrations for a series of 4 plasma standards (27-540 ng/mL). A weighting factor of 1/Ct 2 was applied in the linear least-squares regression analysis to maintain homogeneity of variance across the concentration range. Two concentration levels were processed and injected in triplicate to calculate the percentage of relative standard deviation (%RSD; 9.3% at 540 ng/mL and 20.2% at 54 ng/mL).
Statistical Analyses
Statistical analyses were performed using SPSS (IBM SPSS Statistics for Windows, Version 20.0; IBM Corp, Armonk, New York). Continuous variables are presented as mean ± standard deviation. One-way repeated measure analysis of variance with Bonferroni correction was used to compare the difference in means of each group compared to group 1. Chi-square analysis was used for nominal data, collapsing groups 3 and 4 into a single group.
Results
Patient Baseline Characteristics
A total of 37 patients were prescribed milrinone at the time of entry into Vanderbilt Heart and Vascular Institute’s Main Heart Registry. Six patients were excluded because milrinone was not at steady state at the time of plasma collection. Additionally, 2 patients were excluded because of irrevocable errors during sample preparation. The characteristics of the 29 patients included in analyses are shown in Table 1. After stratification by kidney function, there were 14 patients in group 1, 10 in group 2, 3 patients in group 3, and 2 patients in group 4.
Demographics of Patients With Stage D Heart Failure Stratified by Renal Dysfunction.a

Abbreviations: ACEI, angiotensin-converting enzyme inhibitor; ARB, angiotensin receptor blocker; CrCl, creatinine clearance; ICD, implantable cardiac defibrillator; SCr, serum creatinine; SD, standard deviation; VT, ventricular tachycardia; VF, ventricular fibrillation.
aData reported as mean ± SD or n (%).
bVentricular tachycardia/ventricular fibrillation episode prior to milrinone initiation.
c P < 0.05 compared to all other groups.
dCreatinine clearance calculated by the Cockcroft-Gault equation.
e P < 0.05 compared to all other groups except group 3 or 4 as applicable.
fAngiotensin-converting enzyme inhibitor or angiotensin II receptor blocker.
Milrinone Concentration and Clearance
Mean milrinone infusion rates, steady state concentrations, and plasma clearance of each group are listed in Table 2. There was no difference in the mean initial milrinone infusion rate between the groups (P >0.5). In all, 20% of patients required infusion rate increases (group 1: n = 1, group 2: n = 3, group 3: n = 2, and group 4: n = 0) before the final infusion rate was selected. All milrinone concentrations were at steady state, with a mean time of 44 ± 71 days since initiation or infusion rate change. There was no difference in the mean infusion rate between the groups (P=0.14) at the time of steady state plasma collection. The mean milrinone concentration for each group was 451± 243 ng/mL in group 1, 591 ± 293 ng/mL in group 2, 1575 ± 962 ng/mL in group 3, and 6252 ± 4409 ng/mL in group 4 (P < 0.05 vs group 1). The group 4 patient (4A) with serial plasma sampling around intermittent thrice-weekly hemodialysis had a prehemodialysis milrinone concentration of 11 528 ng/mL, more than 20 times the upper limit of the therapeutic index. The milrinone concentration dropped 45% to 5285 ng/mL immediately after hemodialysis and rose to 9396 ng/mL within 24 hours after hemodialysis.
Milrinone Plasma Concentrations and Clearance.a
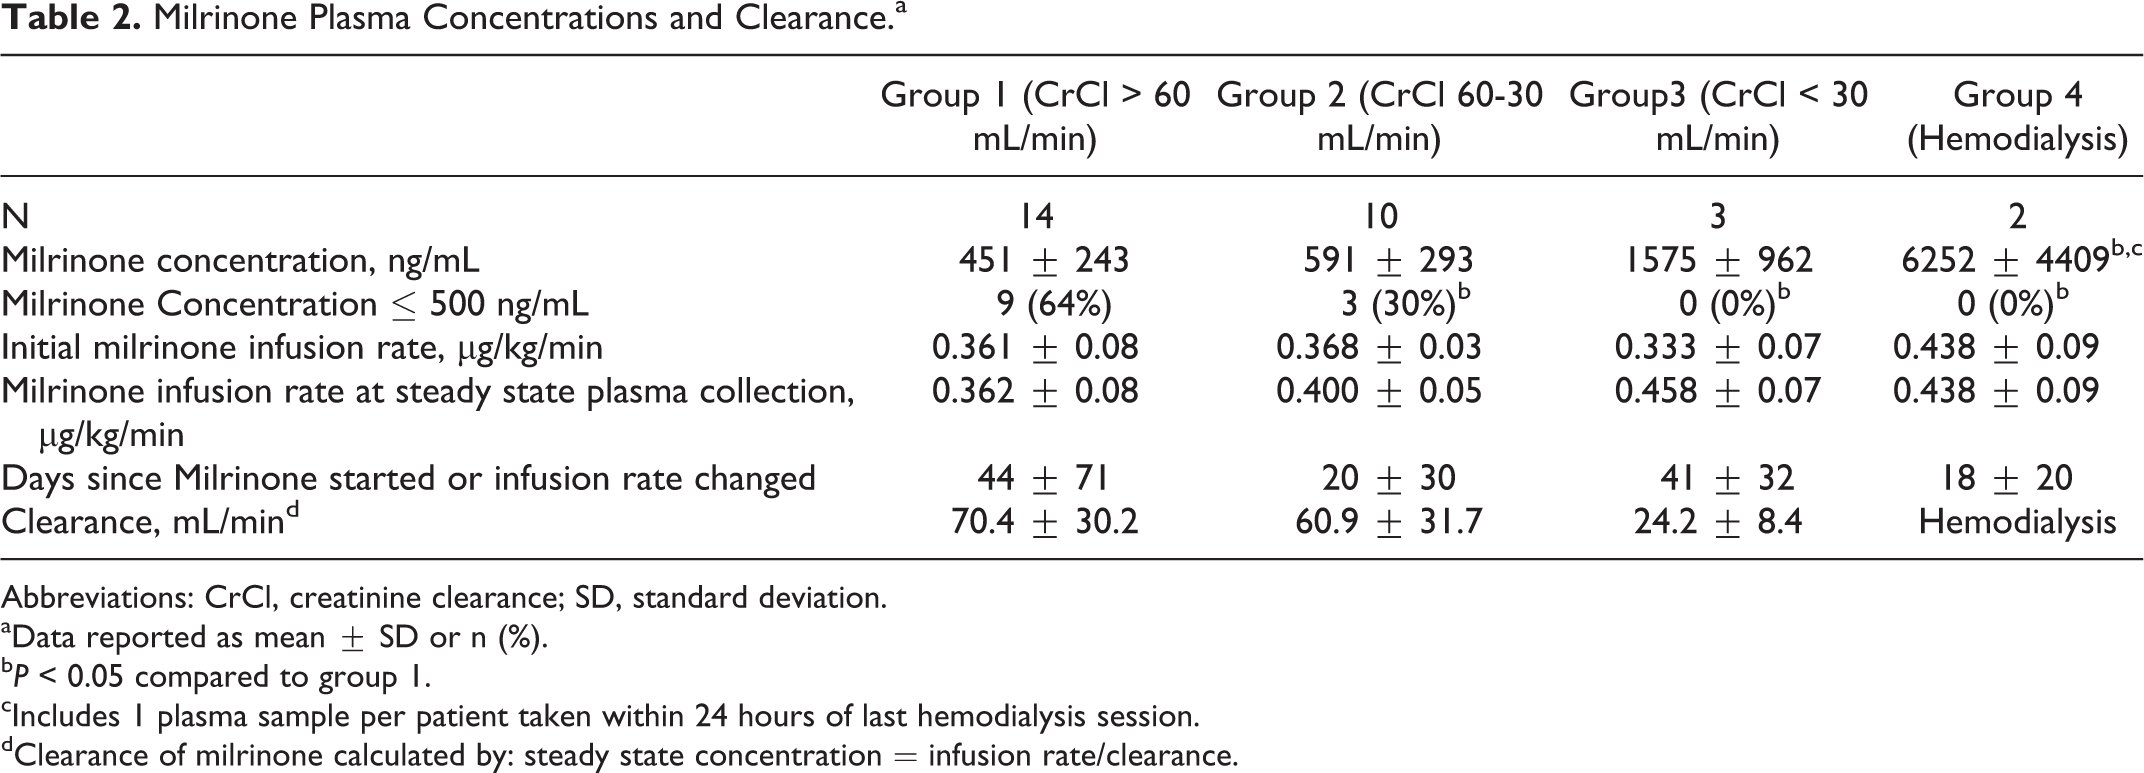
Abbreviations: CrCl, creatinine clearance; SD, standard deviation.
aData reported as mean ± SD or n (%).
b P < 0.05 compared to group 1.
cIncludes 1 plasma sample per patient taken within 24 hours of last hemodialysis session.
dClearance of milrinone calculated by: steady state concentration = infusion rate/clearance.
Hemodynamic Changes
Cardiac catheterization was performed to compare hemodynamic parameters before and after milrinone initiation in 28 patients (Table 3). Changes in renal function, and thus milrinone clearance, were clinically negligible between the time of plasma collection and time of cardiac catheterization (mean SCr difference 0.01 ± 0.43 mg/dL). There were no differences for any group compared to group 1 for the mean increases in CI by Fick calculation (P=0.2), mean decrease in PVR (P=0.9), mean decease in PCWP (P=0.4), or mean decrease in mean arterial pressure (MAP; P=0.4). In all, 5 patients in group 1, 1 patient in group 2, 1 patient in group 3, and no patients in group 4 required discontinuation or reduction in their oral HF medication for hypotension after initiation of milrinone. However, few patients in groups 3 and 4 were on these therapies at baseline (Table 1).
Hemodynamic Changes With Milrinone Initiation.a

Abbreviations: CrCl, creatinine clearance; CI, cardiac index; PCWP, pulmonary capillary wedge pressure; PVR, pulmonary vascular resistance; SD, standard deviation.
aData reported as mean ± SD. P > 0.05 for all comparisons of mean differences from baseline in each Group compared to Group 1.
bPulmonary vascular resistance = (mean pulmonary artery pressure − pulmonary capillary wedge pressure)/cardiac output.
Electrophysiologic Changes
Only 27% of our study group had premilrinone and postmilrinone ICD interrogations for comparison. However, given the high variations in interrogation date ranges and documentation, no valid comparisons could be made. Both the patients in group 4 had postmilrinone ICD interrogations but no baseline for comparison. Patient 4A experienced 180 episodes of NSVT and 6 episodes of VT that were terminated by defibrillation over a 120-day period on milrinone. Patient 4B experienced 3 episodes of VT that were terminated with antitachycardia pacing over the 20-day period following milrinone initiation.
Patient Outcomes
At the time of publication, 11 group 1 patients, 6 group 2 patients, 3 group 3 patients, and 1 group 4 patient had received a heart transplantation or destination left ventricular assist device. Two deaths occurred in our cohort. Both were group 2 patients who died of HF-related causes (cardiac arrest and pump failure). The remaining patients are alive, either listed for heart transplantation (n = 4) or on palliative milrinone (n = 2).
Discussion
Our study is the first, to our knowledge, to investigate the relationship between kidney function and milrinone plasma concentrations in chronic inotrope-dependent, patients with stage D HF. In our study, patients with a CrCl >30 mL/min had a mean milrinone concentration near the upper limit of the therapeutic index (500 ng/mL). In contrast, patients with a CrCl ≤ 30mL/min had milrinone concentrations approximately 3-fold higher. Hemodialysis patients experienced milrinone concentrations 10 to 20 times the upper therapeutic index and fluctuated widely around hemodialysis sessions.
Steady state milrinone concentrations are reported between 96 and 200 ng/mL in patients with stage D HF having normal renal function. 23 In our cohort, we found higher steady state milrinone concentrations compared to previous studies of milrinone in renal dysfunction. However, previous trials of patients with renal dysfunction only evaluated single doses or 18 hours infusions of milrinone, which are too brief to quantify steady state concentrations. 12,13 Hasei and colleagues reported a mean milrinone concentration of 83.3 ± 30.1ng/mL after 48 hours of continuous milrinone infusion in patients with cardiac surgery with moderate renal function. 21 However, the milrinone infusion rate was fixed at 0.2 µg/kg/min, and only 1 patient had a CrCl < 30 mL/min. Our findings are more consistent with case reports of milrinone in continuous venovenous hemofiltration who reported mean steady state concentrations of 845 ± 135ng/mL. 22,24
Milrinone infusion rates were similar in all the 4 groups, illustrating the practice pattern of employing 1-size inotrope dosing in the real-world setting. Patients with HF having renal dysfunction may be more likely to receive higher infusion rates as a means to improve kidney function through increased cardiac output. In all, 28% of the patients prescribed milrinone in the ADHERE had a SCr greater then 2 mg/dL. 8 Despite decreased renal elimination, the mean infusion rate in the 2021 registry patients prescribed milrinone was 0.54 µg/kg/min, which is similar to our experience. We found this approach resulted in markedly elevated plasma concentrations in severe renal dysfunction without additional hemodynamic benefit.
The lack of hemodynamic benefit with elevated milrinone plasma concentrations in our trial is in agreement with previous studies demonstrating a sigmoidal relationship between milrinone plasma concentration and hemodynamic benefit. In these trials, milrinone plasma concentrations between 140 and 167 ng/mL produced a 50% increase in CI, with a flattening of the concentration–response curve above 500 ng/mL. 11,25 Downregulation of the β-adrenergic receptor density secondary to constant stimulation from increased sympathetic tone results in decreased basal cyclic AMP formation. 26 Ascending concentrations of milrinone do not provide additional hemodynamic benefit likely because of reduced cyclic AMP production and saturation of phosphodiesterase enzyme activity. 27,28 This theory is supported by reports of augmenting the inotropic response from phosphodiesterase inhibitors with the addition of adenylate cyclase activators. 27
We were unable to meaningfully compare the influence of milrinone concentrations on cardiac arrhythmias, given the retrospective nature of our study. However, both group 4 patients experienced episodes of VT necessitating ICD intervention after milrinone initiation. Milrinone increased ventricular ectopy and arrhythmias compared to placebo in previous clinical trials. 20,29 Higher incidences of arrhythmias have also been reported with rapid infusion rates, suggesting an increased risk with supratherapeutic concentrations. 19 Six patients receiving milrinone during continuous venovenous hemofiltration (mean milrinone concentration 845 ± 135 ng/mL) in a recent case series died of ventricular arrhythmias within 30 days of milrinone initiation, although uncertainty exists if milrinone increased this risk above severe HF alone. 22 The inotropic action of milrinone is mediated by increasing intracellular calcium in cardiac myocytes. Calcium reuptake into the sarcoplasmic reticulum during diastole is an ATP-dependent step, increasing myocardial oxygen demand. 30 Alterations in calcium reuptake by the sarcoplasmic reticulum have been recently identified as a mechanism of ventricular arrhythmia. 31 Arrhythmic risk might be increased through intracellular calcium mishandeling in a concentration-dependent manner with milrinone, as has been suggested with digoxin, although this seems discordant with the theory of milrinone’s sigmoidal relationship to inotropy. 32,33
Our study has several limitations. First, we assumed the patient’s SCr for grouping represented stable kidney function. The SCr was similar at the time of cardiac catheterization, indicating stable kidney function, but we cannot exclude acute, transient fluctuations. Second, we used a novel series of methods to measure plasma milrinone concentration. Although this method has not been previously used, our %RSD for analysis of known concentrations was acceptable. Additionally, we quantified large differences in milrinone concentrations between groups, making any small errors insignificant for our purposes. Third, our assessment of hemodynamic changes was retrospective. Patients may have received additional HF therapies that could affect postmilrinone hemodynamics. Finally, the small number of patients in our groups limits the power of our conclusions, although a trend of increasing milrinone concentrations with decreasing renal function was clearly seen.
In conclusion, patients with severe renal dysfunction (CrCl <30mL/min) and patients receiving renal replacement therapies have markedly elevated milrinone plasma concentrations compared to patients with normal renal function. Future research is needed to evaluate the potential arrhythmic risk of elevated milrinone concentrations and the expected dosing requirements in patients with stage D HF requiring chronic inotropic therapy as a bridge to more definitive HF therapies.
Footnotes
Authors’ Note
The content is solely the responsibility of the authors and does not necessarily represent the official views of the National Institutes of Health.
Declaration of Conflicting Interests
The author(s) declared no potential conflicts of interest with respect to the research, authorship, and/or publication of this article.
Funding
The author(s) disclosed receipt of the following financial support for the research, authorship, and/or publication of this article: Research reported in this publication was supported by the National Center for Advancing Translational Sciences of the National Institute of Health under Award Number UL1 TR000445.