
Abstract
Background:
A low n-3 to n-6 polyunsaturated fatty acids (PUFAs) ratio is reported to be associated with cardiovascular events. However, the effects of statins on this ratio have not been fully examined.
Methods:
A total of 101 patients with coronary artery disease, who were not receiving lipid-lowering therapy were randomly assigned to receive either 4 mg/day of pitavastatin or 20 mg/day of pravastatin. Serum PUFA levels were measured at baseline and 8 months after treatment with statins.
Results:
Pitavastatin was used to treat 51 patients and the remaining 50 patients were treated using pravastatin. A significant positive correlation was observed between the percent change in low-density lipoprotein cholesterol and that in dihomogamma-linolenic acid (r = .376, P = .007), arachidonic acid (AA; r = .316, P = .02), eicosapentaenoic acid (EPA; r = .408, P = .003), or docosahexaenoic acid (DHA; r = .270, P = .056) in the pitavastatin group. However, these correlations were not observed in the pravastatin group. The DHA/AA ratio decreased significantly in the pitavastatin group only (from 0.96 to 0.83, P = .0002) and the DHA/AA ratio was significantly lower in the pitavastatin group at 8 months (0.83 vs 0.96, P = .03). The EPA/AA ratio did not show significant changes in either group.
Conclusions:
Pitavastatin decreased the serum DHA/AA ratio, whereas pravastatin had no effect on this ratio. Neither pitavastatin nor pravastatin had an effect on the serum EPA/AA ratio in patients with coronary artery disease.
Introduction
Several studies have reported that consumption of fish and fish oil with a high concentration of n-3 polyunsaturated fatty acids (PUFAs) is associated with a low risk of cardiovascular disease (CVD).1,2 Among the n-3 PUFAs, eicosapentaenoic acid (EPA) and docosahexaenoic acid (DHA) play important roles in preventing CVD.3,4 A large randomized control trial, the JELIS trial, 3 showed that pure EPA administration along with statin therapy decreased the incidence of coronary events by 19%. Furthermore, a high serum n-3 to n-6 PUFAs ratio was associated with a lower incidence of future cardiovascular events.5,6
Numerous clinical trials have shown that statins can significantly reduce the incidence of CVD. Furthermore, intensive lipid-lowering therapy with statins yields a significantly greater reduction in the risk of coronary events compared to moderate lipid-lowering therapy.7,8 Nonetheless, a residual risk was present in all of the statin trials. 9 Although these reports indicate that the residual risk of cardiovascular events after statin therapy is explained in part by the n-3 to n-6 PUFAs ratio, the effects of statins on serum PUFAs levels are not well understood. Therefore, we examined the effects of statins on serum PUFAs levels and their ratios in patients with coronary artery disease (CAD).
Methods
Patients and Study Design
The present observational longitudinal study compared the intensive lipid-lowering effects of pitavastatin with the moderate lipid-lowering effects of pravastatin on serum PUFAs levels, and the ratios that were obtained during the Treatment with Statin on Atheroma Regression Evaluated by Intravascular Ultrasound with Virtual Histology (TRUTH) trial. The TRUTH trial was a prospective, open-labeled, randomized, and multicenter trial performed at 11 Japanese centers to evaluate the effects of an 8-month treatment with pitavastatin versus pravastatin on the composition of coronary artery plaques. 10 Briefly, 164 patients with angina pectoris were randomized to either pitavastatin (4 mg/day, intensive lipid-lowering group) or pravastatin (20 mg/day, moderate lipid-lowering group) therapy after successful percutaneous coronary intervention.
Patients were included in the present study if they fulfilled the following criteria: the allocated statins were continued during the study period (8 months) and an adequate serum volume was available in frozen samples for various measurements.
The TRUTH study was conducted in accordance with the Declaration of Helsinki and with the approval of the ethical committees of the 11 participating institutions. Written informed consent was obtained from each patient enrolled in the study.
Biomarker Analysis
Serum lipid levels and inflammatory markers were measured at baseline and 8 months after treatment with statins. The serum levels of EPA, DHA, arachidonic acid (AA), and dihomogamma-linolenic acid (DHLA) in conserved frozen samples that were obtained at baseline and at 8 months were measured annually by a central laboratory (BML Inc, Kawagoe, Japan). In brief, serum lipids were extracted using Folch procedure. Next, using tricosanoic acid (C23:0) as an internal standard, fatty acids were methylated using boron trifluoride and methanol, and the methylated fatty acids were analyzed using a capillary gas chromatograph (GC-2010; Shimadzu Corporation, Kyoto, Japan) and a BPX70 capillary column (0.25 mm ID × 30 m; SGE International Ltd, Melbourne, Australia).
Statistical Analysis
Statistical analysis was performed using StatView version 5.0 (SAS Institute, Cary, North Carolina). Results are expressed as the mean ± standard deviation. Differences in continuous variables between the 2 groups were compared using the unpaired t test when the variables showed a normal distribution or the Mann-Whitney U test when they did not. Differences in continuous variables within each group were compared using the paired t test when the variables showed a normal distribution or the Wilcoxon signed rank-sum test when they did not. Categorical variables between the 2 groups were compared using the chi-squared test or the Fisher exact test. Univariate regression analyses were performed to assess the relationship between the percent change in low-density lipoprotein cholesterol (LDL-C) and that in PUFAs. Statistical significance was set at P < .05.
Results
Patient Characteristics and Risk Factor Control
The baseline characteristics of the participants are shown in Table 1. Pitavastatin was used to treat 51 patients (50%) and pravastatin was used to treat 50 patients (50%). None of the baseline characteristics were significantly different between the 2 groups.
Baseline Characteristics of Participants.a

Abbreviations: CAD, coronary artery disease; ACE-Is, angiotensin-converting enzyme inhibitors; ARBs, angiotensin-receptor blockers; CCBs, calcium channel blockers; SD, standard deviation.
aData are expressed as the mean ± SD or number (%).
Blood Parameters at Baseline and 8 Months After Treatment With Statins.a
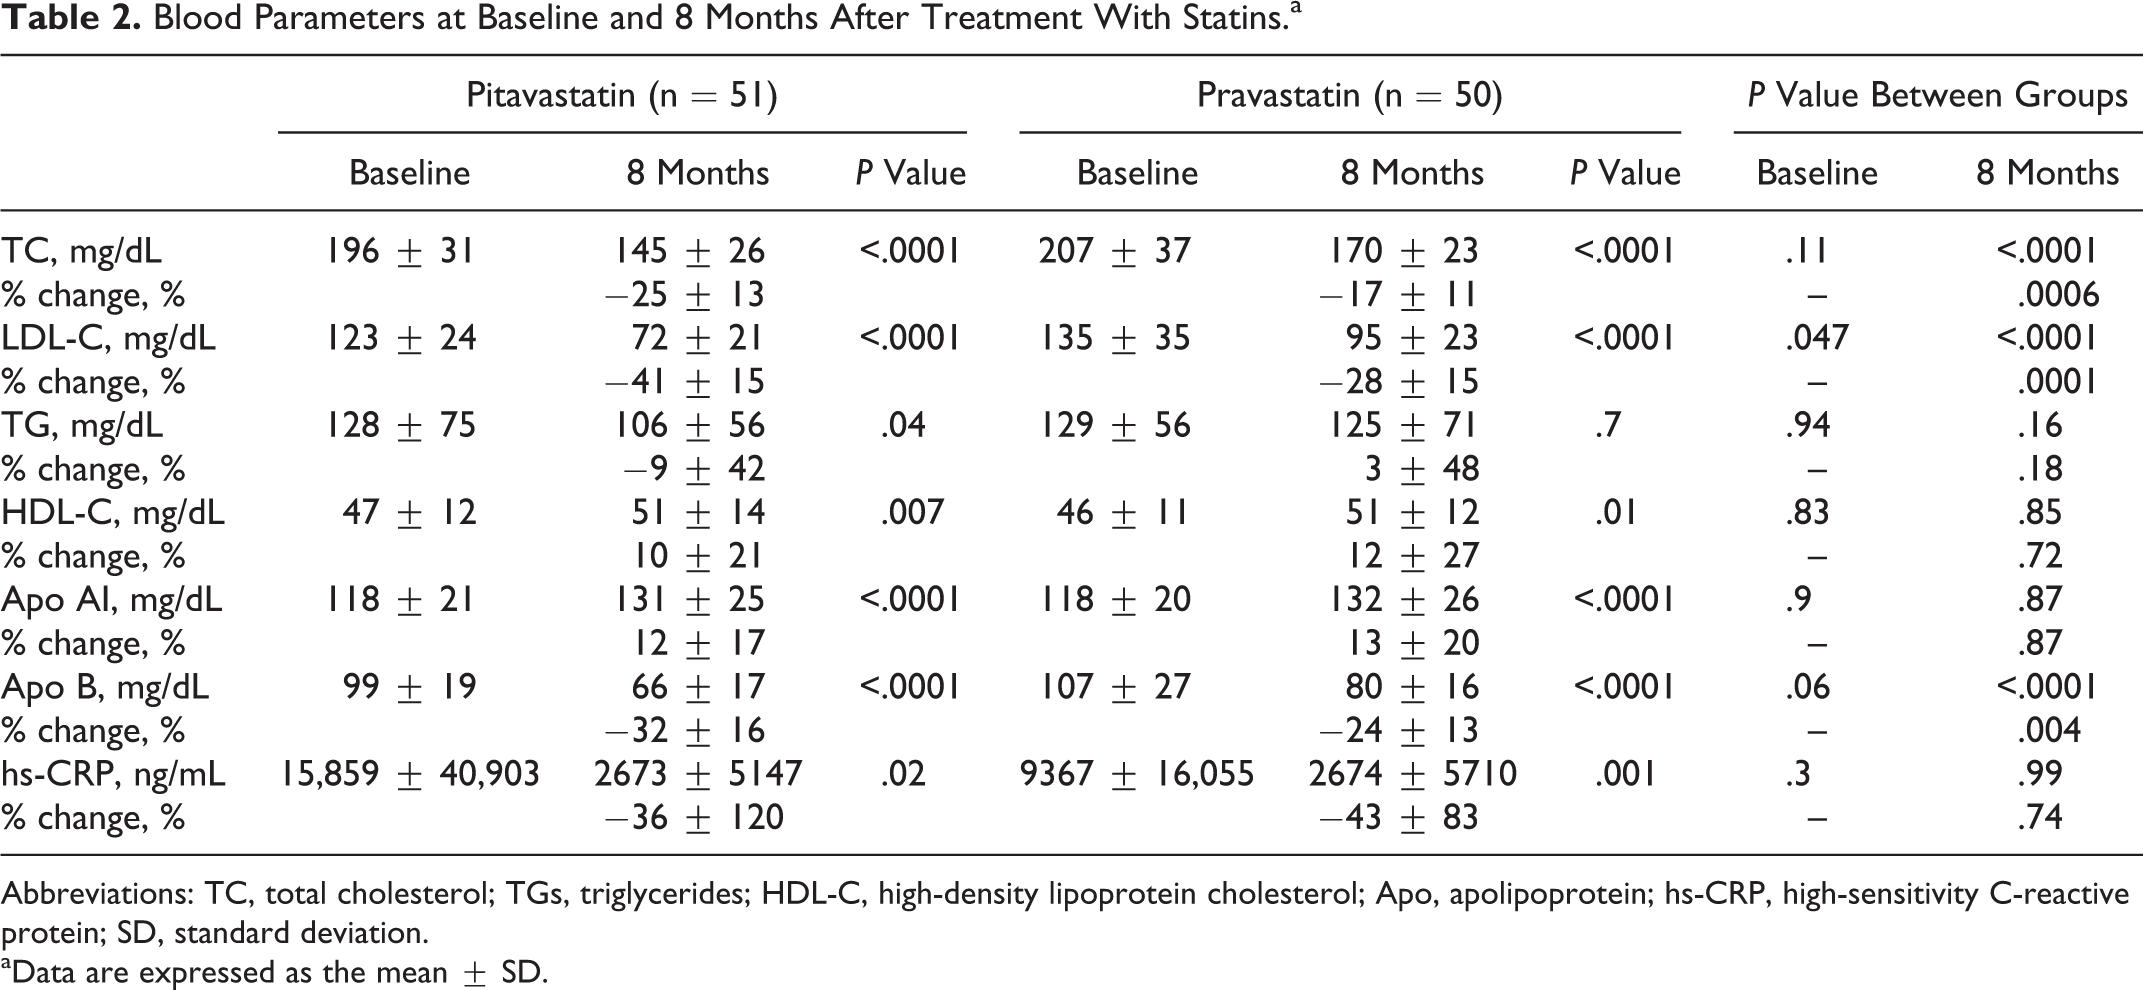
Abbreviations: TC, total cholesterol; TGs, triglycerides; HDL-C, high-density lipoprotein cholesterol; Apo, apolipoprotein; hs-CRP, high-sensitivity C-reactive protein; SD, standard deviation.
aData are expressed as the mean ± SD.
Serum LDL-C levels decreased significantly in both the groups (pitavastatin group, −41%, P < .0001; pravastatin group, −28%, P < .0001). The mean LDL-C level at 8 months was significantly lower in the pitavastatin group (72 mg/dL vs 95 mg/dL, P < .0001). In both the groups, the serum high-density lipoprotein cholesterol level increased significantly (pitavastatin group, 10%, P = .007; pravastatin group, 12%, P = .01) and high-sensitivity C-reactive protein level decreased significantly (pitavastatin group, −36%, P = .02; pravastatin group, −43%, P = .001). However, no significant differences were observed in these levels at 8 months between the 2 groups.
Correlations Between Percent Changes in LDL-C and in PUFAs
We assessed the correlations between the percent changes in LDL-C and in PUFAs. The percent change in LDL-C was positively correlated with that in DHLA (r = .376, P = .007), AA (r = .316, P = .02), EPA (r = .408, P = .003), or DHA (r = .270, P = .056) in the pitavastatin group (Figure 1). These correlations were not observed in the pravastatin group (Figure 2).

Correlations between the percent change in LDL-C and that in n-6 or n-3 PUFAs in the pitavastatin group. Positive correlations were observed between the percent change in LDL-C and that in DHLA, AA, EPA, or DHA. DHLA indicates dihomogamma-linolenic acid; AA, arachidonic acid; EPA, eicosapentaenoic acid; DHA, docosahexaenoic acid; LDL-C, low-density lipoprotein cholesterol.

Correlations between the percent change in LDL-C and that in n-6 or n-3 PUFAs in the pravastatin group. No correlations were found between the percent change in LDL-C and that in DHLA, AA, EPA, or DHA. DHLA indicates dihomogamma-linolenic acid; AA, arachidonic acid; EPA, eicosapentaenoic acid; DHA, docosahexaenoic acid; LDL-C, low-density lipoprotein cholesterol.
Changes in Serum PUFAs Levels and Ratios
Serum PUFAs levels at baseline and 8 months after treatment with statins are shown in Table 3. A significant increase in AA was observed in the pitavastatin group (from 128.9 to 141.2 μg/mL, P = .009), whereas this increase was not significant in the pravastatin group (from 132.5 to 138.4 μg/mL, P = .13). The serum EPA level tended to increase in both the groups, whereas the DHA level tended to decrease in both the groups. As a result, the serum DHA level was significantly lower at 8 months in the pitavastatin group than in the pravastatin group (111.4 μg/mL vs 128.9 μg/mL, P = .04). Moreover, although decreases in the DHA/AA ratio were observed in both the groups, the decrease in this ratio was greater in the pitavastatin group (−0.14 vs −0.04, P = .04); therefore, the DHA/AA ratio at 8 months was significantly lower in the pitavastatin group (0.83 vs 0.96, P = .03). The EPA/AA ratio showed no significant change in both the groups.
Serum PUFAs Levels at Baseline and 8 Months After Treatment With Statins.a
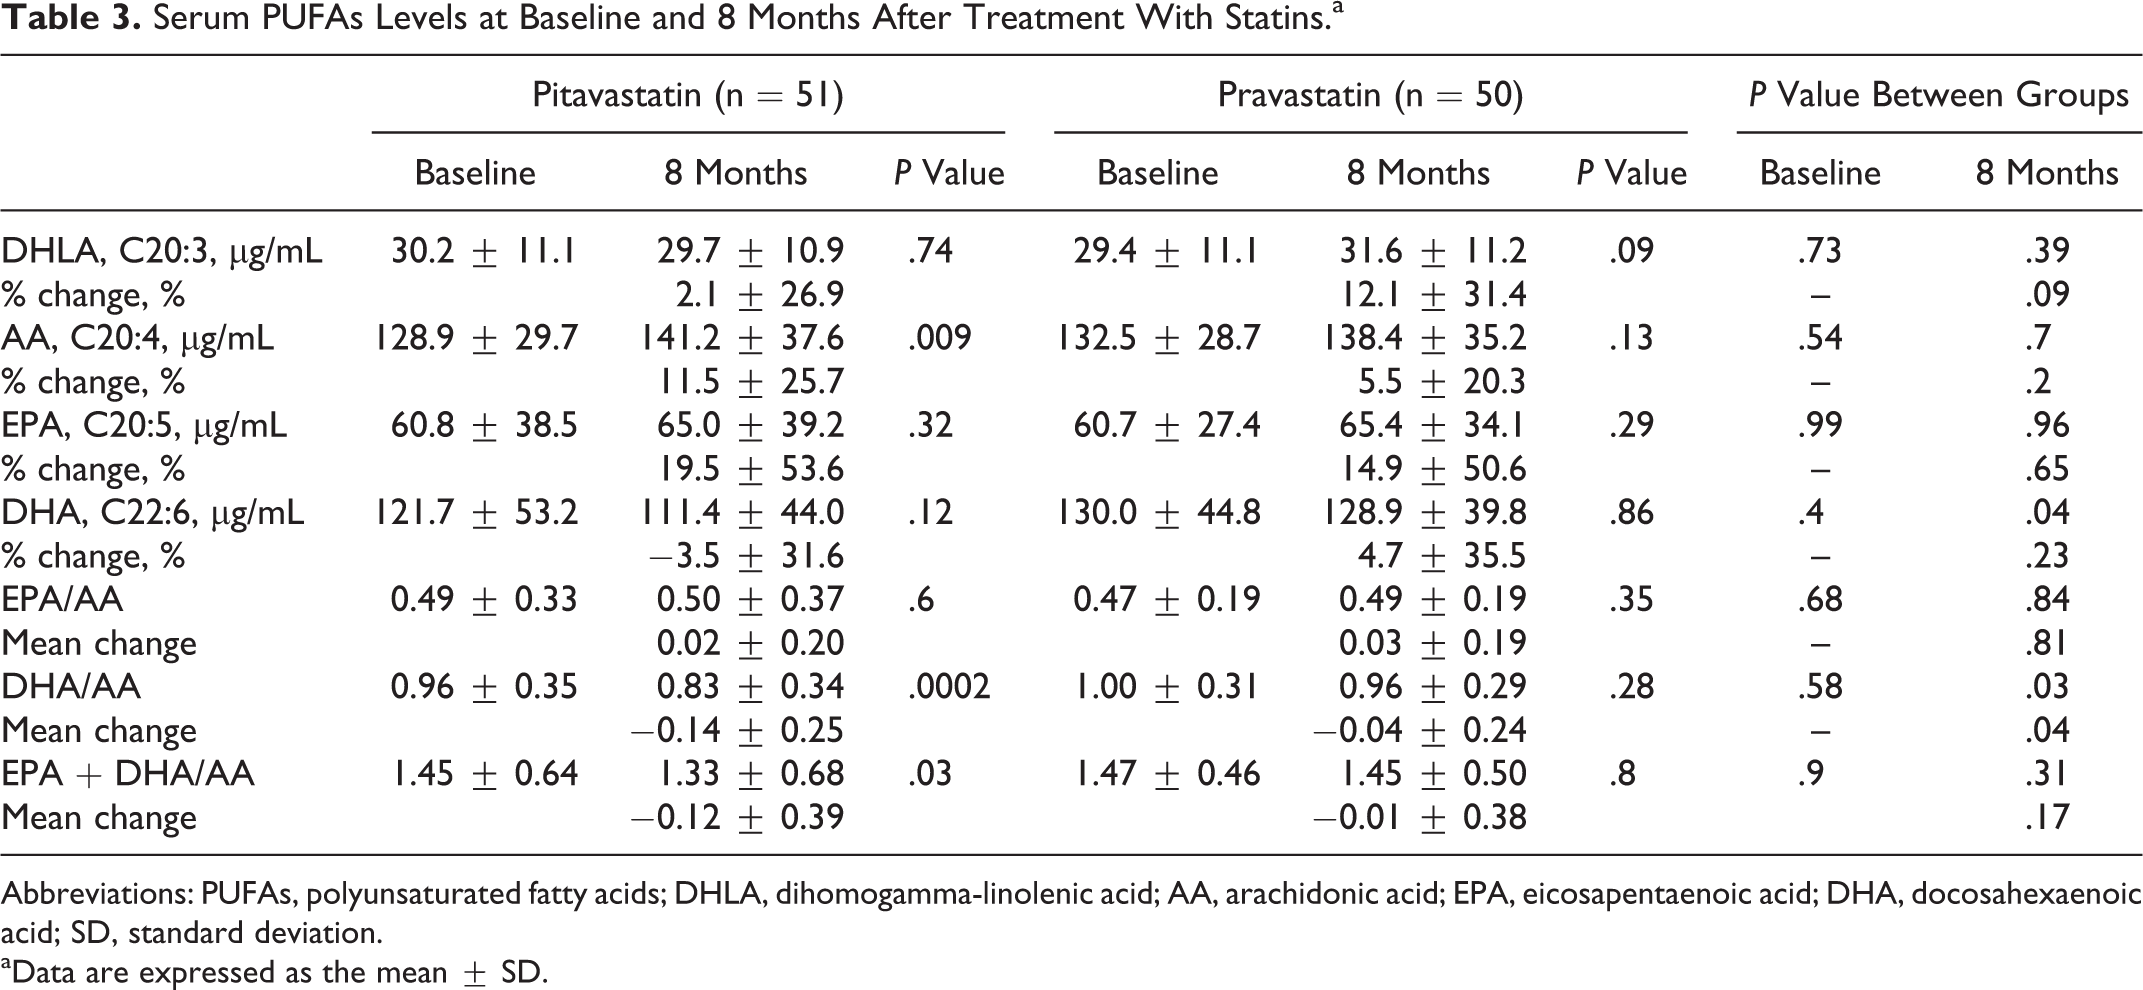
Abbreviations: PUFAs, polyunsaturated fatty acids; DHLA, dihomogamma-linolenic acid; AA, arachidonic acid; EPA, eicosapentaenoic acid; DHA, docosahexaenoic acid; SD, standard deviation.
aData are expressed as the mean ± SD.
Discussion
The major findings of the present study included the following: (1) the percent change in LDL-C was positively correlated with that in n-3 and n-6 PUFAs in the pitavastatin group, whereas these correlations were not observed in the pravastatin group, (2) a significant decrease in the DHA/AA ratio was observed in the pitavastain group, particularly at 8 months, and (3) the EPA/AA ratio did not change significantly in either group.
The PUFAs are important constituents of all cell membranes and are essential for humans. The 2 types of PUFAs, n-6 and n-3, are metabolized by the same set of enzymes to their respective long-chain metabolites. The AA, the key n-6 PUFA, plays an important role in the inflammatory process and platelet activation in atherosclerosis in connection with the production of free radical oxidation, leukotriene, thromboxane, and prostaglandins.11–13 In contrast, EPA and DHA, the key n-3 PUFAs, have counter effects on the progression of atherosclerosis. Both EPA and DHA are protective against the progression of atherosclerosis because they inhibit platelet aggregation, 14 inflammatory cytokine production, and the expression of adhesion factors. 15 The effect of fish oil supplementation on the fatty acid (EPA + DHA) composition of atherosclerotic plaques has been examined in 3 previous studies. Rapp et al reported substantial incorporation of EPA and DHA into plaque lipids when using a very high dose of EPA + DHA. 16 In contrast, 2 other studies found significantly higher levels of EPA in atherosclerotic plaques than DHA when using a low dose of EPA + DHA.17,18 These findings suggest that EPA and DHA exert different protective effects against the development of atherosclerosis.
Few reports have described the effects of statins on PUFAs levels. According to the previous reports, the effects of statins on serum PUFAs levels have varied. Nakamura et al evaluated the effects of pravastatin and simvastatin on PUFAs levels in patients with hypercholesterolemia. 19 They demonstrated that these statins increased the AA level significantly whereas they did not affect EPA and DHA levels, resulting in a significant decrease in the EPA/AA ratio. Harris et al reported that concentration of AA were unchanged while the AA/EPA ratio was increased significantly and the AA/DHA ratio tended to be increased by simvastatin 40 mg. 20 Kurisu et al evaluated the effects of strong statins including atorvastatin, rosuvastatin, and pitavastatin on PUFAs levels and reported that strong statins mainly reduced n-3 PUFAs in proportion to the decrease in the LDL-C level whereas the EPA/AA ratio showed no significant change. 21 In the present study, percent change in the LDL-C was positively correlated with that in n-3 PUFAs in the pitavastatin group. These data are consistent with a previous report. However, our data showed a positive correlation between the percent change in LDL-C and that in n-6 PUFAs, which is discrepant with a previous report. 21 Furthermore, pravastatin treatment did not significantly decrease the EPA/AA ratio. These differences are likely due to the use of different types of statins. Kurisu et al evaluated the effects of various strong statins (atorvastatin, 48%; rosuvastatin, 19%; and pitavastatin, 33%) on serum PUFAs levels and Nakamura et al evaluated the effects of weak statins (pravastatin, 74% and simvastatin, 26%) on serum PUFAs levels. On the other hand, the present study evaluated the effects of pitavastatin only among strong statins and pravastatin only among weak statins on serum PUFAs levels. A recent study reported that simvastatin increases the serum AA levels due to an increase in Δ6- and Δ5-desaturase enzyme activities. 22 Although the effects of other statins on these enzyme activities were not evaluated fully, statins increase the formation of DHLA, AA, EPA, and DHA by these enzymes. 23 We speculate that the effects of statins on the formation and conversion of PUFAs are different among specific types of statins and these differences partly explain the various pleiotropic effects of statins. The AA, EPA, and DHA give rise to anti-inflammatory molecules such as lipoxins, resolvins, protectins, and maresins. 23 Thus, PUFAs form precursors of both pro- and anti-inflammatory molecules and the balance between these mutually antagonistic compounds could determine the process of atherosclerosis.
Although statins help to prevent CVD, a residual risk remains from statin treatment. Our results suggested that some of the beneficial effects of statins are canceled by a decrease in the n-3 to n-6 PUFAs ratio. Combination therapy with n-3 PUFAs and a statin had a beneficial effect 24 and significantly decreased the incidence of coronary events. 3 We should consider treating patients who show a decrease in the n-3 to n-6 PUFA ratio after statin therapy with n-3 PUFAs.
Conclusion
Pitavastatin decreased the serum DHA/AA ratio, whereas pravastatin had no effect on this ratio. In addition, both pitavastatin and pravastatin had no effect on the serum EPA/AA ratio in patients with CAD. Additional treatment with n-3 PUFAs may be an option for resolving residual risk in patients with CAD treated with a statin alone.
Study Limitations
This study had several limitations. First, this study was a post hoc analysis of the TRUTH trial. Second, lifestyle habits were not controlled, and changes in the PUFAs composition of the diet are reflected in the levels of serum PUFAs. 25 Third, antidiabetic and antihypertensive medications were not standardized during the study period. Changes in medications or other factors such as plasma glucose levels, blood pressure, exercise, or smoking may have affected the present results. Fourth, we did not measure lipoxins, resolvins, protectins, and maresins, which are anti-inflammatory products derived from AA, EPA, or DHA. Finally, the statistical power was insufficient to compare the effects of statins on serum PUFAs levels and their ratios because of the small number of patients. Therefore, a prospective, randomized study involving more patients is necessary to confirm our conclusions.
Footnotes
Declaration of Conflicting Interests
The author(s) declared no potential conflicts of interest with respect to the research, authorship, and/or publication of this article.
Funding
The author(s) received no financial support for the research, authorship, and/or publication of this article.