
Abstract
Background:
Uric acid is considered a risk factor for cardiovascular disease (CVD). The effect of statins and ezetimibe on serum uric acid levels has not been yet clarified.
Objective:
To compare the effect of simvastatin/ezetimibe 10/10 mg, simvastatin 40 mg, and rosuvastatin 10 mg daily on serum uric acid levels in patients with dyslipidemia.
Methods:
This was a prospective, randomized, open-label, blinded end point (PROBE) study. Following a 3-month dietary intervention, patients with hypercholesterolemia received simvastatin/ezetimibe 10/10 mg or simvastatin 40 mg or rosuvastatin 10 mg. Changes in serum levels of uric acid and fractional renal excretion of uric acid as well as changes in electrolyte and renal function parameters were assessed after 12 weeks of treatment.
Results:
One hundred fifty-three patients (56 male) were included. At week 12, a significant reduction in serum uric acid levels was seen in all treatment groups (simvastatin/ezetimibe 10/10 mg: −3.8%, simvastatin 40 mg: −5.7%, and rosuvastatin 10 mg: −3.8%; P < .05 compared with baseline; P = not significant [NS] for comparison between groups). Fractional excretion of uric acid nonsignificantly increased in all groups (simvastatin/ezetimibe 10/10 mg: +6.8%, simvastatin 40 mg: +6.8%, and rosuvastatin 10 mg: +5.9%). The reduction in serum uric acid levels correlated with the increase in fractional excretion of uric acid and baseline uric acid levels. Renal function parameters as well as serum levels and fractional excretions of electrolytes remained unchanged in all groups. Changes in serum lipids were similar across groups.
Conclusion:
Simvastatin/ezetimibe 10/10 mg, simvastatin 40 mg, and rosuvastatin 10 mg exhibit a similar uric acid–lowering effect.
Introduction
The association of hyperuricemia with cardiovascular disease (CVD) risk factors such as hypertension, dyslipidemia, obesity, insulin resistance, metabolic syndrome, and chronic kidney disease (CKD) has long been recognized. 1,2 However, the exact role of serum uric acid (SUA) in the development of CVD has been debated for several years. It is a matter of controversy as to whether SUA is independently associated with CVD or is only a marker.
Current data show that statins (mainly atorvastatin) may reduce SUA levels, and this may be part of their so-called pleiotropic effects. 3 –7 Data on the effect of other statins on SUA metabolism are scarce. A recently published retrospective study showed that rosuvastatin may reduce SUA levels. 8 Regarding simvastatin, a decrease in SUA was demonstrated in patients with peripheral arterial disease. 9 However, 1 study showed a neutral effect of simvastatin on SUA levels. 5 Studies showed no effect of ezetimibe monotherapy on SUA levels in overweight and obese as well as hypercholesterolemic patients. 10,11 We are unaware of any published data with regard to the impact of the combination of ezetimibe with simvastatin on SUA levels. We aimed to examine whether the combination of ezetimibe with low-dose simvastatin versus higher dose simvastatin versus the usual dose rosuvastatin has the same effects on SUA levels.
We have previously described the effects of 3 different hypolipidemic treatment regimens with similar low-density lipoprotein (LDL) cholesterol–lowering capacity, namely simvastatin/ezetimibe 10/10 mg, simvastatin 40 mg, and rosuvastatin 10 mg, on glucose metabolism in patients with primary hypercholesterolemia. 12 We now report on a prespecified analysis regarding the effect of these treatments on SUA levels.
Materials and Methods
Study Population
Study details have been previously described. 12 Briefly, consecutive patients with primary hypercholesterolemia attending the Outpatient Lipid and Obesity Clinic of the University Hospital of Ioannina in Greece, participated in the present study. Inclusion criteria were LDL cholesterol levels above those recommended by the National Cholesterol Education Program–Treatment Panel III (NCEP-ATP-II) based on the risk factors of each patient following a 3-month period of lifestyle change. 13
Exclusion criteria were known CVD, symptomatic carotid artery disease, peripheral arterial disease, abdominal aortic aneurysm, diabetes mellitus, triglycerides (TGs) >500 mg/dL (5.65 mmol/L), renal disease (serum creatinine levels >1.6 mg/dL; 141.4 μmol/L), hypothyroidism (thyroid-stimulating hormone [TSH] >5 IU/mL), and liver disease (alanine aminotranferase and/or aspartate aminotranferase levels >3-fold upper limit of normal [ULN] in 2 consecutive measurements), neoplasia as well as clinical and laboratory evidence of an inflammatory or infectious condition. Patients with hypertension were included in the study if they were on stable medication for at least 3 months and their blood pressure was adequately controlled (no change in their treatment was allowed during the study). Patients currently taking lipid-lowering drugs or having stopped them less than 4 weeks before study entry were excluded.
Study Protocol
This study had a prospective, randomized, open-label, blinded end point (PROBE) design.
Before randomization to study treatment, all patients underwent a 12-week dietary intervention in accordance with the NCEP-ATP-III guidelines. 13 After 12 weeks, patients who continued to meet the inclusion criteria were randomly allocated to receive open-label simvastatin/ezetimibe 10/10 mg or simvastatin 40 mg or rosuvastatin 10 mg for 12 weeks. Randomization was performed by means of a computer-generated sequence of random numbers.
Changes in SUA levels, fractional excretion (FE) of uric acid, serum creatinine, estimated creatinine clearance (eClCr), estimated glomerular filtration rate (eGFR) and urinary-albumin-to creatinine ratio as well as serum levels and FE of electrolytes were assessed after 3 months of treatment.
Tolerability was assessed by questioning patients about adverse effects and monitoring relevant laboratory parameters (creatine kinase [CK], liver function tests). Compliance with study medication was assessed at week 12 by tablet counts; patients were considered compliant if they took 80% to 100% of the prescribed number of tablets.
All participants gave written informed consent before any clinical or laboratory evaluations were performed. The study protocol was approved by the institutional ethics committee.
Biochemical Parameters
All laboratory determinations were carried out after an overnight fast and performed blinded with regard to treatment allocation. All laboratory measurements were performed at the laboratory of Biochemistry of the University Hospital of Ioannina. Morning blood and first void urine samples were obtained from all participants. Serum was separated by centrifugation at 1500g for 15 minutes and serum glucose and electrolytes (sodium, potassium, magnesium, calcium, chloride, and phosphate) were measured using an Olympus AU600 Clinical Chemistry analyzer (Olympus Diagnostica, Hamburg, Germany) by standard procedures. The uricase–peroxidase coupled reaction was used for quantitative determination of uric acid in serum and urine. Urine samples were centrifuged at 1000g for 10 minutes and an aliquot was taken for the determination of creatinine, sodium, potassium, magnesium, calcium, chloride, phosphate, and uric acid. The urinary albumin was measured on a Behring Nephelometer BN ProSpect (Dade Behring Holding Gmbh, Lieberbach, Germany). Serum creatinine was measured by a modification of Jaffé method. Urinary albumin excretion was expressed as a ratio of urinary-albumin-to-urinary-creatinine concentration. Fractional excretion of uric acid, sodium, potassium, calcium, phosphate, chloride, and magnesium was calculated from the standard formula: %FEx = [(Ux * Scr)/(Sx * Ucr)]*100%, where Sx and Ux represent the serum and urine concentrations of electrolyte x, and Scr and Ucr represent serum and urine concentrations of creatinine, respectively.
The eClCr was calculated using the Cockcroft-Gault formula [(140 − age) × body weight × (0.85 if female)]/[serum creatinine (mg/dL) × 72]. The eGFR was calculated using the Modification of Diet in Renal Disease (eGFR-MDRD) formula [186 × serum creatinine−1.154 × age−0.203 × (0.742 if female) × (1.210 if black)].
Concentrations of total cholesterol (TC), TGs, and high-density lipoprotein (HDL) cholesterol were determined enzymatically on the Olympus AU 600 clinical chemistry analyser (Olympus Diagnostica). High-density lipoprotein cholesterol was determined by a direct assay (Olympus Diagnostica). Low-density lipoprotein cholesterol was calculated with the Friedewald formula. Fasting insulin levels were measured using an AxSYM microparticle enzyme immunoassay on an AxSYM analyzer (Abbott Diagnostics, Abbott Park, Illinois). Homeostasis model assessment of insulin resistance (HOMA-IR) was calculated as follows: fasting insulin (mU/L) × fasting glucose (mg/dL)/405.
Liver and muscle enzymes as well as thyroid function tests were measured by conventional methods
Statistical Analysis
Values are given as mean ± standard deviation (SD) and median (range) for parametric and nonparametric data, respectively. Continuous variables were tested for lack of normality by the Kolmogorov-Smirnov test and logarithmic transformations were accordingly performed for nonparametric variables. The paired sample t test was used for assessing the effect of treatment in each group. Analysis of covariance (ANCOVA), adjusted for baseline values and multiple variables, was used for comparisons between treatment groups.
After log transforming, non-Gaussian variables Pearson correlation coefficients were used to describe the relationship of posttreatment change in the SUA levels with baseline SUA levels, HOMA-IR, age, gender as well as with waist circumference, body mass index (BMI) and lipid levels, and changes in these parameters.
Significance was defined as P < .05 (2-tailed). Analyses were performed using the Statistical Package for the Social Sciences (SPSS) 15.0 (SPSS Inc, Chicago, Illinois).
Results
Initially, 160 patients were enrolled. After a 12-week dietary intervention, 153 patients (56 male) continued to meet the inclusion criteria and were randomized to receive either simvastatin 40 mg (n = 55) or rosuvastatin 10 mg (n = 45) or the combination of simvastatin 10 mg with ezetimibe 10 mg (n = 53; as a single pill).
No significant differences regarding baseline data were found across groups (Table 1). No adverse effects due to muscle or liver toxicity were noted. No patient dropped out and compliance was >80% in all patients.
Baseline Demographic Characteristics of Study Participantsa

Abbreviations: ACEIs, angiotensin-converting enzyme inhibitors; ARBs, angiotensin II receptor blockers; BMI, body mass index; MetSyn, metabolic syndrome.
aValues are expressed as mean ± SD. P = NS for all comparisons.
The SUA levels were significantly reduced in all 3 treatment groups without any significant difference between the 3 groups (simvastatin/ezetimibe 10/10 mg: −3.8%, simvastatin 40 mg: −5.7%, and rosuvastatin 10 mg: −3.8%; P < .05 compared with baseline; P = NS for comparison between groups; Table 2). Uric acid FE tended to increase in all 3 groups, although this increase did not reach significance in any group (simvastatin/ezetimibe 10/10 mg: +6.8%, simvastatin 40 mg: +6.8% and rosuvastatin 10 mg: +5.9%; P = NS compared with baseline; P = NS for comparison between groups; Table 2).
Changes in Uric Acid, Electrolytes, and Renal Function Parameters Following 3 Months of Treatmenta,b
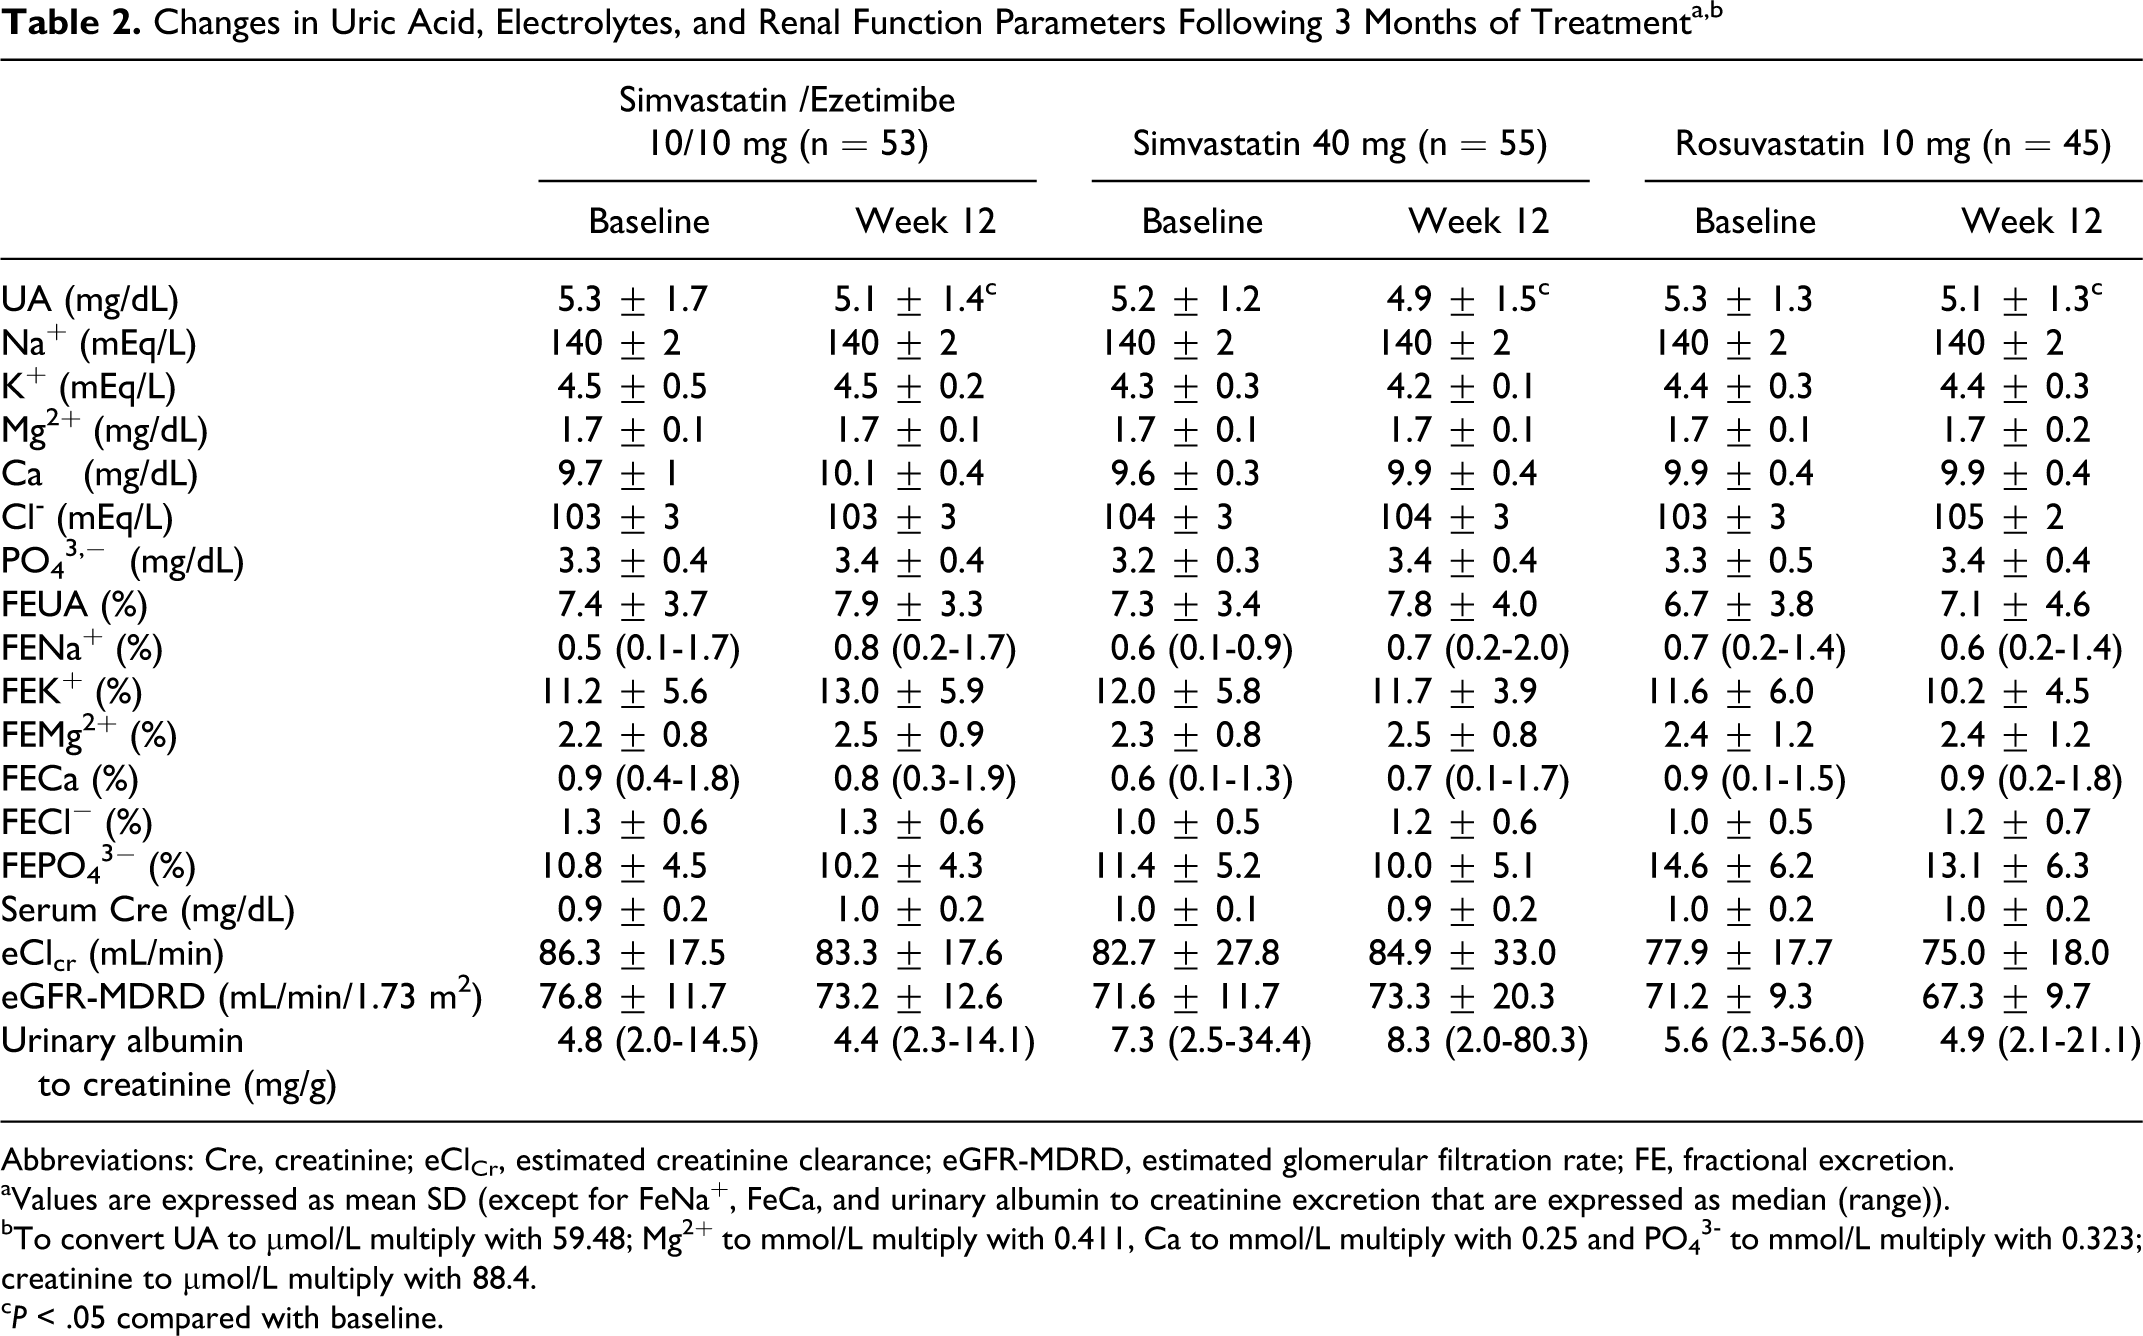
Abbreviations: Cre, creatinine; eClCr, estimated creatinine clearance; eGFR-MDRD, estimated glomerular filtration rate; FE, fractional excretion.
aValues are expressed as mean SD (except for FeNa+, FeCa, and urinary albumin to creatinine excretion that are expressed as median (range)).
bTo convert UA to μmol/L multiply with 59.48; Mg2+ to mmol/L multiply with 0.411, Ca to mmol/L multiply with 0.25 and PO4 3– to mmol/L multiply with 0.323; creatinine to μmol/L multiply with 88.4.
c P < .05 compared with baseline.
The effect of different treatments on renal function as assessed by serum creatinine, eClCr, eGFR-MDRD, and urinary-albumin-to-creatinine ratio are shown in Table 2. No significant changes versus baseline were observed in any groups. No significant difference was observed between groups (P = NS for comparison between groups). No change in serum levels and FE of electrolytes was observed in any group (Table 2).
All participants that were randomized to lipid-lowering treatment had participated in a 12-week dietary intervention before drug therapy was initiated. No significant change in BMI and waist circumference was noted when preintervention, baseline pretreatment, and posttreatment values were compared (data not shown).
The effect of treatment on serum lipid parameters and glucose metabolism has been previously described. 12 Briefly, at the end of the 12-week treatment period, levels of TC, LDL cholesterol, and TGs were significantly reduced in all groups (P < .001 compared with the baseline values in all groups). High-density lipoprotein cholesterol levels were not significantly altered in any of the 3 groups. There was no significant difference between the 3 groups. Serum insulin and HOMA-IR significantly increased in all 3 groups (P < .05 compared with baseline; P = NS for all comparisons between groups).
In univariate analysis, changes in SUA levels were significantly correlated only with baseline uric acid levels (r = −.378, P < .001), age (r = −.185, P < .05), and changes in FeUA (r = −.343, P < .001). No correlation was observed with baseline and changes in HOMA-IR or serum lipid levels.
Discussion
This is the first study, to our knowledge, comparing the effects of the combination of simvastatin with ezetimibe versus statin monotherapy in equivalent cholesterol reduction doses on SUA levels. We demonstrate that simvastatin/ezetimibe 10/10 mg, simvastatin 40 mg, and rosuvastatin 10 mg were associated with similar SUA level reduction in participants with primary hypercholesterolemia.
Recent epidemiological evidence suggests an independent relationship among elevated SUA levels and increased CVD risk. 6,14,15 A causal relationship between SUA levels and CVD risk has been strongly suggested by a post hoc analysis of the Losartan Intervention For Endpoint reduction (LIFE) study. 14 In this study, SUA levels were strongly (P < .0001) associated with CVD events, particularly in women. In addition, data support the idea that SUA decrease may contribute to CVD risk reduction. 14 In fact, in LIFE study 29% of the superiority of losartan (compared with atenolol) on the primary composite end point was attributed to a fall in SUA levels. 14 In addition, other studies suggest that SUA may be considered as an independent risk factor for CVD and may also carry prognostic significance. 6,15 Although the pathophysiologic mechanisms by which SUA plays a pathogenetic role in CVD are unclear, hyperuricemia by itself may be associated with deleterious effects on endothelial function, platelet adhesion and aggregation, and oxidative stress. 1,2 In this context, the reduction in SUA levels may result in a decrease in CVD risk. A direct causal role remains to be established.
Statins may affect SUA levels independently of lipid-lowering effects, and this may be included in their pleiotropic effects. 16 However, this is not a consistent finding and whether it represents a class effect remains unknown. Among statins, several studies have shown that atorvastatin has a hypouricemic action by increasing fractional urate excretion. 3,4,6,17 In the GREek Atorvastatin and Coronary-heart-disease Evaluation (GREACE) study, in patients with coronary heart disease, atorvastatin was associated with a significant (P < .0001) fall in SUA levels. Every 1 mg/dL fall in SUA levels was associated with a decreased hazard ratio (0.76; 95% CI 0.62-0.89; P = .001) for vascular events. 6 However, in this study atorvastatin significantly improved renal function, which may have contributed to the reduction in SUA levels. In a recently published post hoc analysis of the Assessing The Treatment Effect in Metabolic syndrome without Perceptible diabeTes (ATTEMPT) study, in 1123 participants with hypercholesterolemia and the metabolic syndrome, treatment with atorvastatin significantly reduced SUA levels by 5.6% and increased eGFR by 3.5%. 18
Data on the effect of other statins on SUA are scarce. 4,8,9 In a recently published study aiming to show noninferiority of pitavastatin 2 mg versus atorvastatin 10 mg versus rosuvastatin 2.5 mg in safety and LDL-cholesterol–lowering capacity, atorvastatin and rosuvastatin significantly reduced SUA levels compared with baseline (5.2 ± 1.2 mg/dL to 5.0 ± 1.1 mg/dL, 5.4 ± 1.5 mg/dL to 5.2 ± 1.5 mg/dL, P < .05, respectively). 17 In the ATOrvastatin and ROSuvastatin (ATOROS) study, a 24-week open-label randomized study, atorvastatin was compared with rosuvastatin in patients with primary hypercholesterolemia. In this study, renal function parameters were not influenced in any group, while atorvastatin but not rosuvastatin showed a significant hypouricemic effect. 19 To our best knowledge, the effect of ezetimibe in combination with a statin on SUA levels has not been reported.
Insulin resistance is associated with hyperuricemia. 20 Specifically, insulin increases both sodium and uric acid reabsorption. Therefore, insulin increases SUA levels. 20 In this regard, drugs that improve insulin sensitivity, such as metformin, troglitazone, sibutramine, and orlistat also lower SUA levels. 2 In our cohort, changes in SUA levels did not correlate either with baseline HOMA-IR concentrations or with HOMA-IR changes. In fact, all 3 treatment regimens significantly increased HOMA-IR. 12
The underlying mechanisms of statin-induced SUA reduction are not well understood. Uric acid is primarily excreted via the kidney, where it is completely filtered at the glomerulus, fully reabsorbed by the proximal tubule, and then excreted (about 50% of the filtered load) and again reabsorbed. Elevated SUA concentration can result from an overproduction of uric acid but is usually the consequence of its low renal excretion. It has been speculated that statins increase renal blood flow and, thus, increase renal urate excretion and lower serum creatinine levels. 7 In our cohort, no significant change in renal function parameters was observed in any of the 3 groups. However, there was a trend toward increasing FE of uric acid. Of note, changes in SUA levels were significantly correlated with changes in FE of uric acid in all 3 groups. This may be attributed to a direct statin effect on renal uric acid excretion or alternatively, to an effect of cholesterol-lowering per se. As the reduction in SUA was independent of changes in serum cholesterol, it is unlikely to be related to cholesterol lowering. Additionally, since all 3 treatments were associated with reduced SUA levels and increased FE of urate, the SUA-reducing effect may not be specifically statin dependent.
In the present study, we demonstrate that simvastatin combined with ezetimibe produce the same SUA-lowering effect compared with statin monotherapy. This is the first study to report a SUA-lowering effect with the combination of a statin with ezetimibe. Whether the observed effect is attributed to the small statin dose or to a direct effect of ezetimibe on SUA could not be defined. In this regard, an ezetimibe monotherapy group would be valuable. However, an ezetimibe monotherapy group was not included since statins are considered the initial drug of choice in cholesterol management. To our knowledge, there are few data on the effects of ezetimibe on SUA levels. Studies showed no effect of ezetimibe monotherapy on SUA levels in overweight and obese as well as hypercholesterolemic patients. 10,11 The true practical and clinical implications of the observed relatively small differences in SUA levels during lipid lowering therapy are not known.
There have been studies associating statin treatment with improvements in renal function. 6,21 –23 However, the beneficial effects of statins on renal disease may not be a class effect. The effects of rosuvastatin on the kidney may vary. 22,24,25 High-dose atorvastatin significantly reduced proteinuria and did not affect renal function, whereas rosuvastatin was associated with a significant decline in function and had no effect on proteinuria, according to results of the Prospective Evaluation of Proteinuria and Renal Function in Diabetic Patients With Progressive Renal Disease (PLANET I) and Prospective Evaluation of Proteinuria and Renal Function in Nondiabetic Patients With Progressive Renal Disease (PLANET II) trials. 26 Also, data indicate that rosuvastatin may be associated with increased urine protein excretion of tubular origin and particularly alpha-1-microglobulin. 25
Ezetimibe may be associated with favorable effects on renal function, although the data available are limited. 27,28 In a retrospective study, ezetimibe in combination with a statin was associated with some degree of improved renal function. 11 In another study, treatment with ezetimibe plus simvastatin resulted in a significant decrease in serum creatinine levels in patients with baseline values greater than 1.0 mg/dL (88 μmol/L). 29 In our study, all treatment combinations had neutral effects with regard to renal function tests as well as urinary-albumin-to-creatinine ratio. This may be attributed to the relative short period of treatment. Also, participants did not have impaired renal function tests at baseline. In addition, they had very low baseline urinary albumin excretion rates. As a result, no benefits may have been possible since no renal disease was present. None of the treatment regimens had any effect on electrolytes.
Study Limitations
The main limitation of our study is the lack of a control group. Therefore, we cannot exclude the potential for false positive findings. However, it was deemed necessary to start hypolipidemic treatment following a 3-month period of lifestyle changes if treatment targets had not been reached. Additional limitations include its open-label design (although end points were blindly assessed) and the relatively short period of follow-up (12 weeks). Participants were predominantly female and therefore our findings may not be generalizable. Also, number of patients was not equal in each group due to the technical problems related to the randomization procedure. The small study sample is a further potential limitation, and a type II error cannot be excluded.
The clinical significance of the observed “statistically” significant reduction in SUA levels during lipid-lowering drug therapy in our study is unclear, and further larger studies are needed to confirm such changes and determine their clinical or pathophysiological significance.
Conclusions
Simvastatin/ezetimibe 10/10 mg, simvastatin 40 mg, and rosuvastatin 10 mg exert a similar SUA-lowering effect. Whether this effect is clinically relevant and translates into a reduction of CVD events remains to be further investigated.
Footnotes
Authors' Note
Evangelos N. Liberopoulos, Matilda Florentin, and Moses S. Elisaf were involved in design of the study; Elisavet Moutzouri, Evangelos N. Liberopoulos, and George Liamis conducted the study; Elisavet Moutzouri, Evangelos N. Liberopoulos, and George Liamis were invoved in data collection; Elisavet Moutzouri analyzed the data; Elisavet Moutzouri, Evangelos N. Liberopoulos, and Moses S. Elisaf interpreted the data; Elisavet Moutzouri and Evangelos N. Liberopoulos were involved with manuscript writing.
Declaration of Conflicting Interests
The author(s) declared no potential conflicts of interest with respect to the research, authorship, and/or publication of this article.
Funding
The author(s) received no financial support for the research, authorship, and/or publication of this article.