
Abstract
Primary somatosensory neurons, glial cells in the peripheral ganglia, and neural circuits in the spinal cord function as dynamic network circuits that transmit information to the brain. Although a variety of methods and techniques have been used to study individual neurons or tissue explants, the number of neurons that can be monitored is limited. Imaging intact primary sensory neurons, such as those in the dorsal root ganglion and trigeminal ganglia, and the spinal cord in vivo using fluorescent calcium markers helps overcome the limitations of previous methods and techniques by allowing researchers to monitor tens to thousands of cells simultaneously. This allows researchers to conduct experiments to elucidate somatosensory mechanisms and responses to axonal injury that were previously difficult or impossible to observe. Using this approach, researchers have studied dynamic neural network circuits, connectivity, responses to soft and deep touch, heat, cold, chemicals, inflammation, and injury, and they have repeatedly imaged individual neurons over long periods of time. Approaches include using calcium-sensitive fluorescent dyes and genetically encoded markers, performing terminal exposure surgeries, using chambers designed to monitor large numbers of cells or repeatedly imaging small numbers of cells, and imaging animals with or without anesthesia. This review discusses the advantages and disadvantages of in vivo calcium imaging for studying somatosensory and axonal injury in peripheral sensory ganglia and the dorsal spinal cord, as well as anticipated future directions.
Keywords
Introduction
The somatosensory system monitors all types of somatosensory sensations, including soft and deep touch, proprioception, pain, itch, hot and cold, and chemical stimuli. Somatosensory functions as an ensemble of networks to discriminate between painful and nonpainful sensations (Ropero Peláez and Taniguchi 2016) or fine tactile discriminations (Johansson and Flanagan 2009). Primary sensory neurons in the peripheral ganglia innervate peripheral targets and transmit action potentials to the spinal cord and brain. To better understand these networks and circuit activity or patterns under normal conditions and how these networks respond to damage, researchers must use methods that study neurons, glial cells, and other cell types and dynamic network circuits at the population level. Explants can be useful for studying the function of individual neurons and local networks, but they have the obvious limitation that they often do not innervate targets in the brain, spinal cord, or skin, although some explants include many relevant tissues (Fadaka and others 2025). Ultimately, we want to understand how stimuli from the skin and underlying tissues reach the brain and are interpreted there, so it is desirable to study intact sensory ganglia and nuclei in their normal anatomical and physiological context.
In vivo neural firing is essential for somatosensation, but until recently, tools for studying it have been limited to a relatively small number of cells. To overcome this, imaging based on changes in cytosolic calcium dynamics has been developed. Fluorescent calcium-sensitive indicators respond in neurons that normally have low cytosolic calcium levels. Their activity increases as cytosolic Ca2+ concentration increases in proportion to action potential frequency (Chisholm and others 2018; Helmchen and others 1996). In vivo calcium imaging has two major advantages over electrophysiological approaches (Anderson and others 2018). Calcium imaging allows simultaneous analysis of tens, hundreds, or thousands of neurons. Furthermore, it can be used to image repeatedly over long periods of time with appropriate surgical preparation, allowing researchers to observe physiological changes in the same cell or multiple cells over time. Thus, it has a wide range of applications: numerical population response analysis where a few vs tens vs up to hundreds of neurons respond under different conditions; studying the morphology of neuronal subtypes and their response patterns to specific stimuli; observing changes in neuronal morphology and response patterns under specific conditions, such as injury, drug treatment, or mutation; observing changes in neuronal sensitivity to stimuli; studying calcium signaling responses in unexcited cells or under conditions where neurons are not firing; and observing changes in neurons over time at the individual neuron and population level. In vivo Ca2+ imaging is emerging as a powerful tool, useful for studying neurons from many parts of the nervous system. This article reviews, as an example, the many ways that Ca2+ imaging has provided new information about primary sensory neurons and the spinal cord. This review also discusses the shortcomings of this technique, such as its limitations in imaging cells near the surface due to limitations in the depth to which the excited and emitted light can penetrate the tissue, not being able to measure action potentials directly, and low temporal resolution.
Spinal Cord Imaging
Spinal cord imaging is useful for linking specific somatosensory inputs to patterns of neural activity and for studying axonal damage. Layers I–IV of the dorsal horn (DH) of the spinal cord receive somatosensory inputs from primary sensory neurons and send action potentials to the brain. The location of the dorsal horn is ideal for exposure surgery. Layers I–IV are close enough to the surface to allow calcium imaging of neurons and other cell types in vivo using fluorescence microscopy. Similarly, the dorsal root fiber pathways of primary sensory neurons can be directly exposed and imaged. Results from DH imaging show great promise for studying somatosensory networks and circuits (Chen and others 2018; Johannssen and Helmchen 2010; Nishida and others 2014; Ran and others 2016; Sekiguchi and others 2016; Shekhtmeyster and others 2023a; Yoshihara and others 2018). For example, calcium imaging models of network activity have shown that different stimuli activate different neuronal subpopulations (Farrar and others 2012; Johannssen and Helmchen 2010; Lorenzana and others 2015; Nishida and others 2014; Ran and others 2016; Sekiguchi and others 2016; Yoshihara and others 2018). Moreover, tens (Chen and others 2018; Johannssen and Helmchen 2010; Sekiguchi and others 2016; Tang and others 2015; Yoshihara and others 2018) to hundreds (Farrar and others 2012; Nishida and others 2014; Ran and others 2016; Shekhtmeyster and others 2023a) and even thousands (Shekhtmeyster and others 2023b) of neurons or glial cells were monitored to identify meaningful patterns in network activity. There are two main approaches to imaging calcium activity in DH cells and dorsal root fibers: loading the cells with calcium-sensitive fluorescent dyes and expressing calcium-sensitive fluorescent proteins in the cells of interest.
Spinal Cord Imaging Using Calcium-Sensitive Fluorescent Dyes
A significant advantage of calcium-sensitive fluorescent dyes over genetically encoded calcium indicators is that they can be used in any strain, species, or cell type, provided the dye can be loaded and the cells examined by fluorescence microscopy. The calcium-sensitive fluorescent dye Oregon Green 488 BAPTA-1 AM has been loaded into dorsal horn cells after spinal transection to image calcium influx and dynamics among a variety of cell types (Ikeda and others 2006; Johannssen and Helmchen 2010; Ran and others 2016). Early experiments imaging spinal muscle fibers showed that in vivo calcium gradients closely follow recorded action potentials (Ikeda and others 2006). Furthermore, it has been shown that electrical stimulation of afferent nerves activates DH neurons broadly, but only a small, distinct subpopulation responds to mechanical stimulation, demonstrating that in vivo calcium imaging can be used to map neural networks in real time (Johannssen and Helmchen 2010). Improvements in animal restraint and movement stabilization have made it easier to map neural networks in real time. Systems capable of imaging ~400 DH neurons at a time have shown a series of overlapping neuronal populations that respond to a wide range of temperatures, from noxious hot to noxious cold, with temperature activation thresholds evenly distributed across the entire temperature range, and with formalin and oxaliplatin affecting warm, cold, and multimodal neurons differently (Ran and others 2016; Ran and others 2021). Analyzing coding populations of this scale would be impossible using conventional electrophysiology. However, calcium-sensitive dyes have several major drawbacks: they do not label specific cell types, so unless neurons are clearly identified during image analysis, the types of neuronal subtype data that can be collected are severely limited. Neurons analyzed were mostly in the superficial laminae. Moreover, the dye is rapidly inactivated, and loading it can cause tissue damage (Xu and Dong 2019).
Spinal Cord Imaging Using Genetically Encoded Calcium Indicators
Transgenic or vector-delivered fluorescent genetically encoded calcium indicators (GECIs) can be used to label specific cell types using cell type–specific promoters or Cre conditional promoters and cell type–specific Cre. Compared with calcium-sensitive dyes, the expressed proteins have the advantage of being longer-lasting during imaging without signal loss and of not requiring cell staining immediately before imaging. Many studies have used this approach to image the mouse brain in vivo (Cheng and others 2019). However, less work has been done using this approach to image the spinal cord in vivo (Cheng and others 2019). A pioneering study using plasmid-encoded Yellow Chameleon monitored the activity of ~200 L1 DH neurons in response to mechanical and thermal stimuli and distinguished between innocuous and noxious coding in layers I–III of the dorsal horn (Nishida and others 2014). Using adeno-associated virus (AAV)–delivered GCaMP6, researchers have shown that approximately half of the mechanosensory neurons in laminae I–II are potentiated by norepinephrine afferents descending from the locus coeruleus (Chen and others 2018; Kawanabe and others 2021; Kohro and others 2020), which would have been difficult or impossible to achieve using electrophysiology. Similarly, DH astrocytes studied at the population level using AAV-delivered GCaMP have been shown to respond to noxious stimuli in both superficial and deep laminae, but not to innocuous stimuli (Sekiguchi and others 2016; Shekhtmeyster and others 2023a; Shekhtmeyster and others 2023b; Yoshihara and others 2018). At the population level, it has been possible to monitor a variety of signaling patterns in different cell types, including the coordination of inhibitory and excitatory DH neurons (Sullivan and Sdrulla 2022) and calcium activity patterns in astrocytes and microglia (Rieder and others 2022). However, analysis was largely confined to the surface laminae.
Repetitive Imaging on Mice without Anesthesia
Traditional real-time imaging methods require terminal exposure surgery and often necessitate that the mouse be anesthetized during imaging. These limitations make repeated imaging impossible and raise questions about how similar the observed neural activity patterns are to those in awake, behaving animals. To resolve these limitations, the implantation of viewing chambers or microprisms has been proposed. These can be inserted through appropriate surgical preparation, allowing repeated measurements of spinal cell activity over several days or weeks without anesthesia. These imaging methods revealed that in freely moving animals, a small number of DH neurons respond to specific stimuli, whereas astrocytes respond only to large-scale inflammation. This method also found that the frequency and amplitude of spontaneous neuronal activity and the activity evoked by mechanical pinch stimulation were greater in freely moving mice than in anesthetized mice. However, only a small number of cells could be imaged in this method (Tables 1 and 2) (Sekiguchi and others 2016; Shekhtmeyster and others 2023a; Shekhtmeyster and others 2023b).
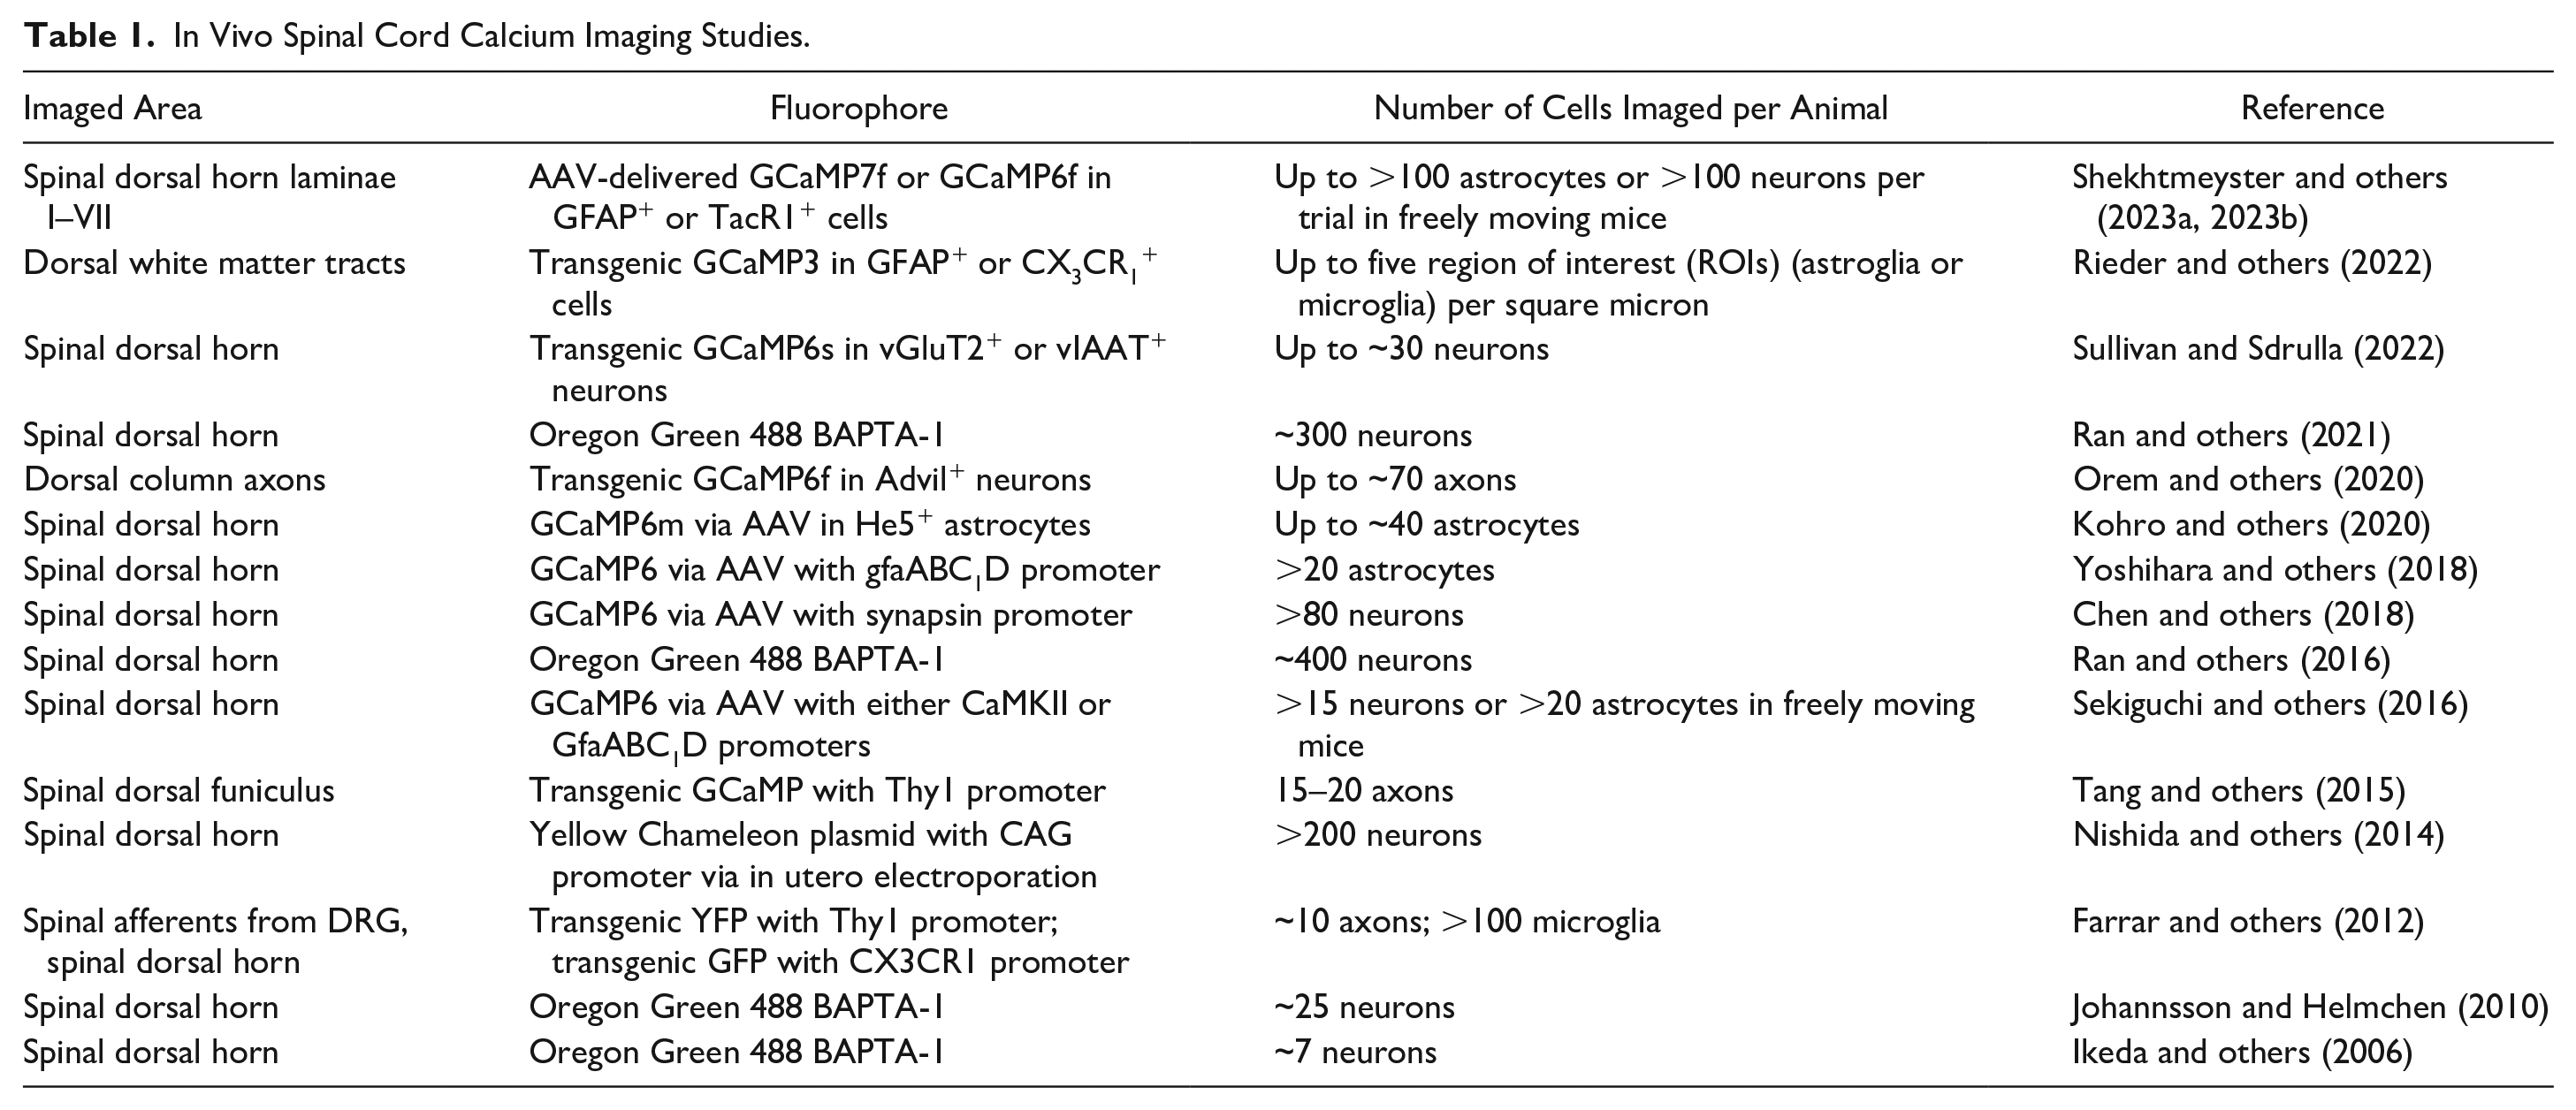
In Vivo Spinal Cord Calcium Imaging Studies.
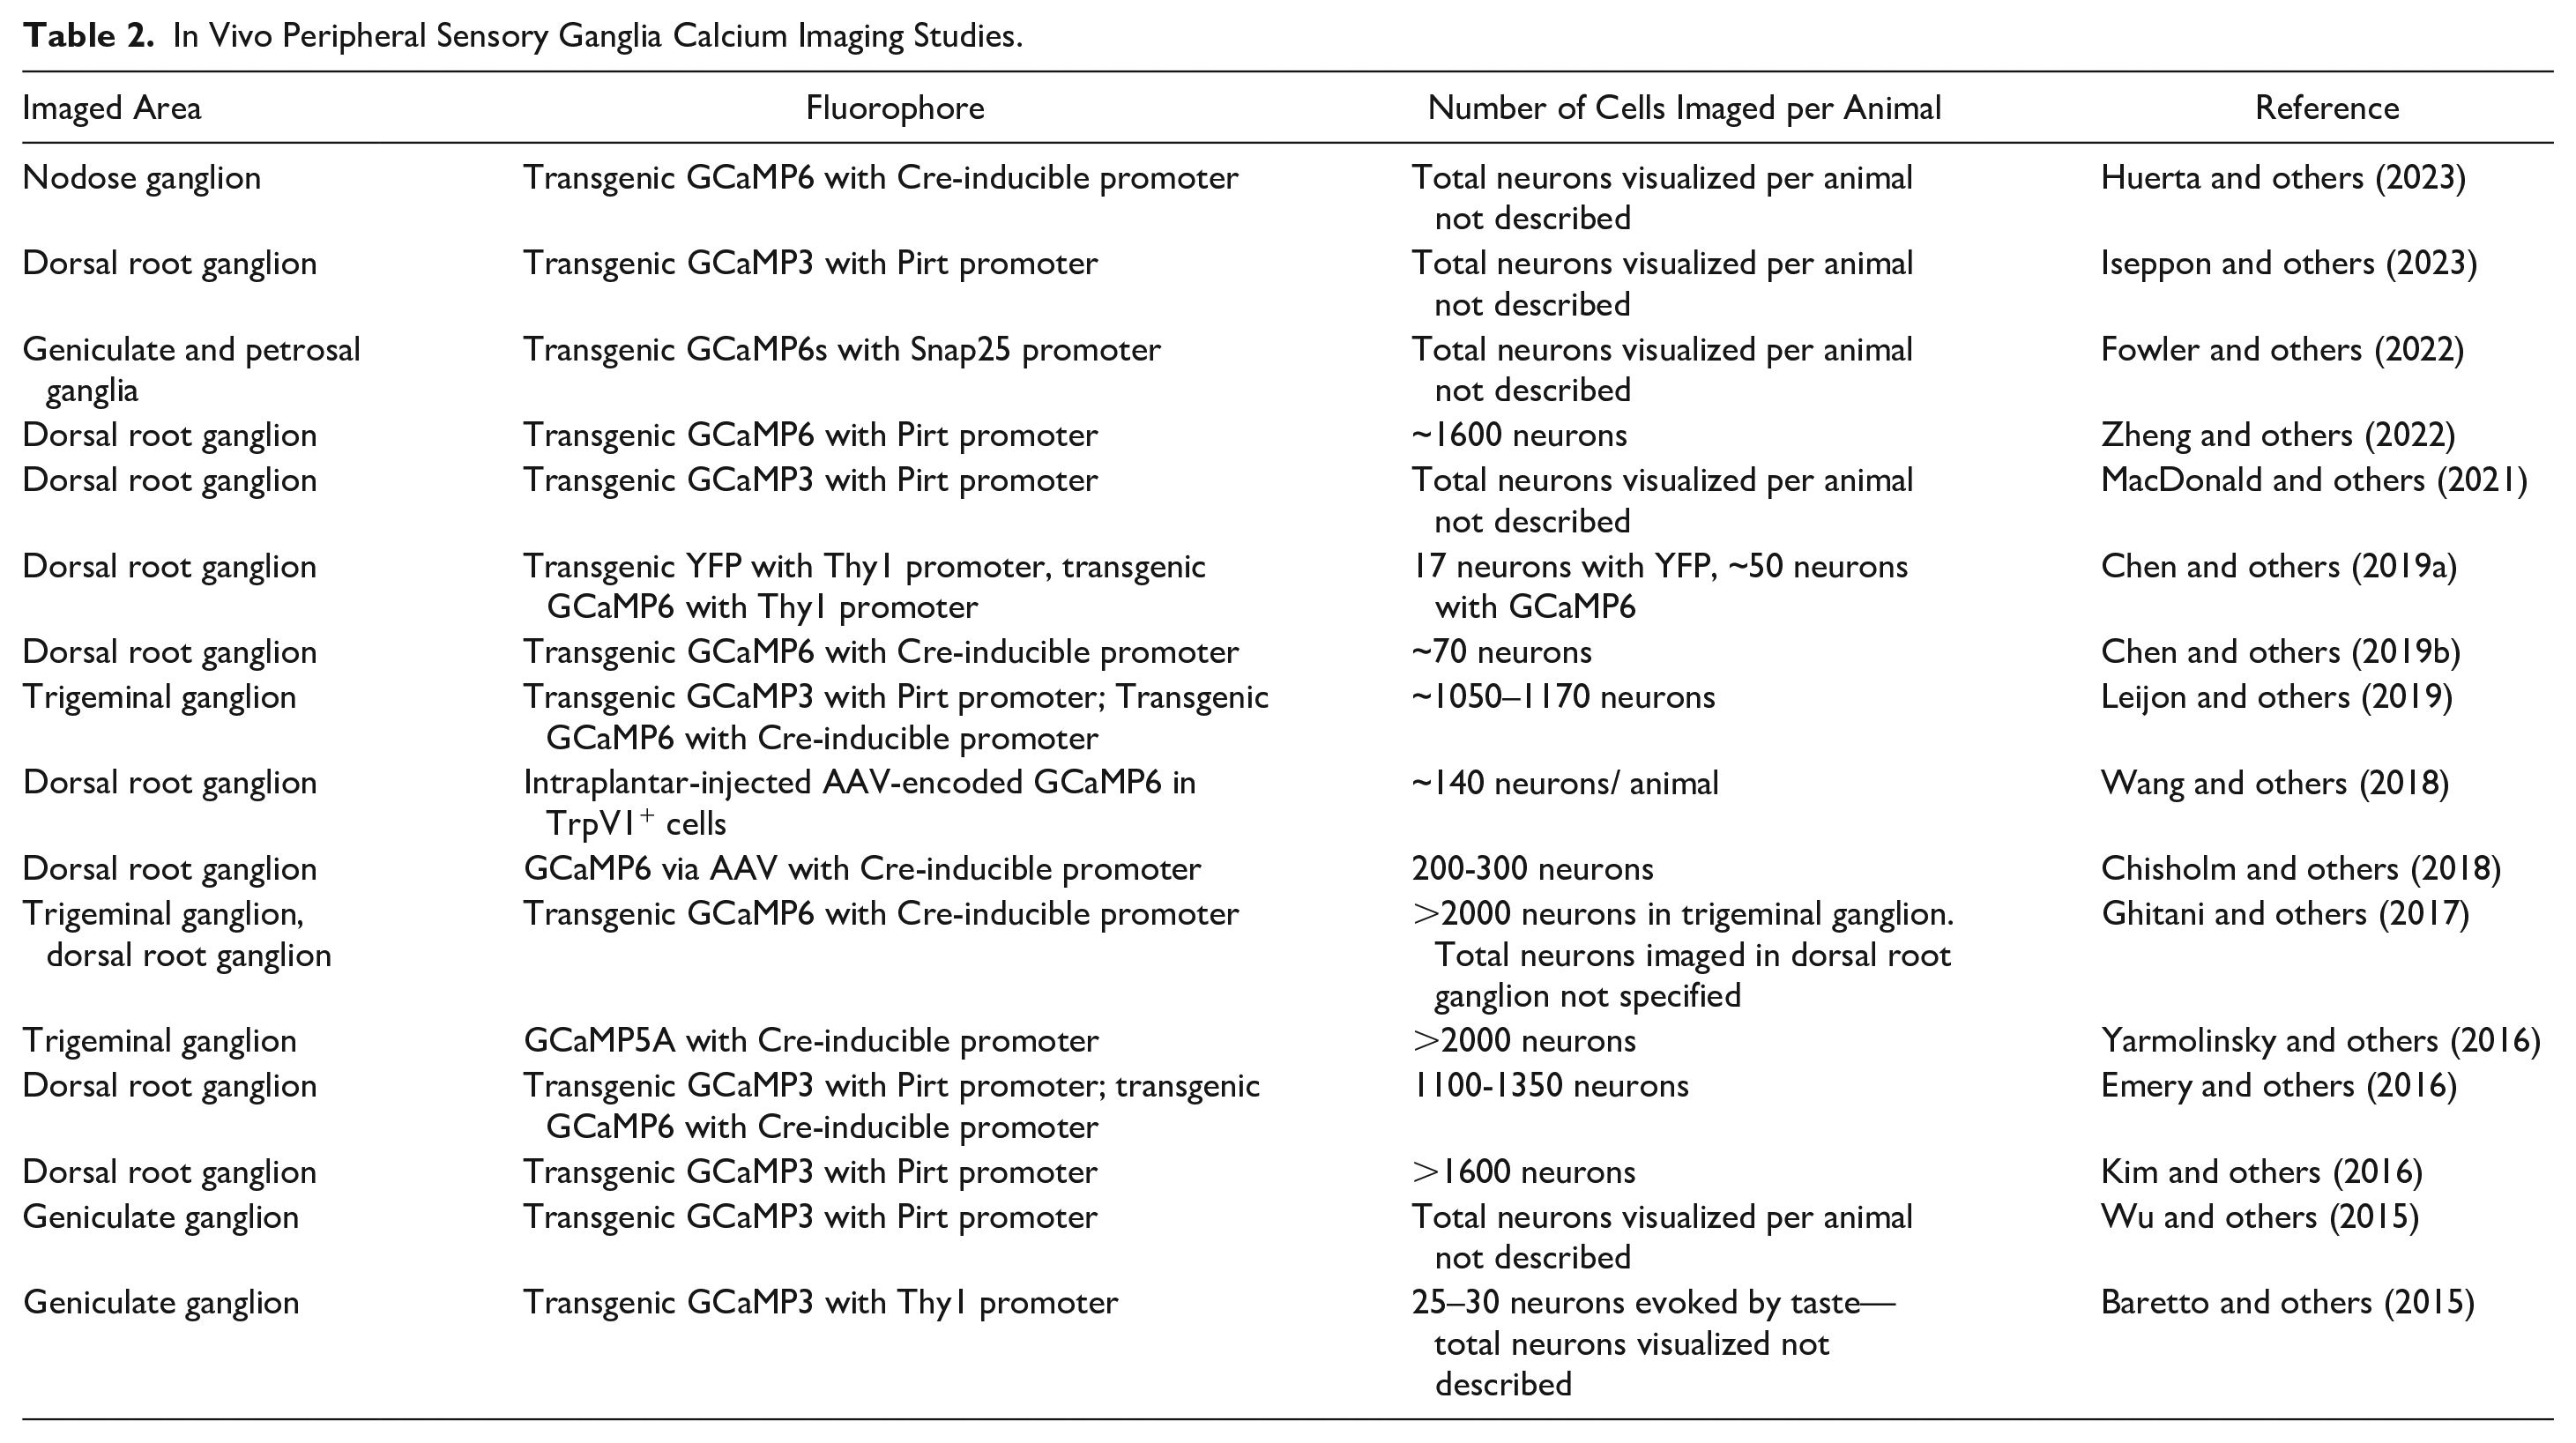
In Vivo Peripheral Sensory Ganglia Calcium Imaging Studies.
Studying Axonal Injury Using Repetitive Imaging Fluorescence Microscopy
Fluorescent labeling has been used to study degeneration and regeneration of superficial axons after spinal cord injury. This can range from studying interactions of specific cell types through genetic encoding to studying interactions with blood vessels and immune cells. Early experiments used green fluorescent protein (GFP) expressed from a neuron-specific promoter to repeatedly image identical axons in the spinal cord and characterize differences in degeneration and stability of axons proximal and distal to the injury site (Kerschensteiner and others 2005). Simultaneous imaging of blood vessels and neurons showed that axonal regeneration did not correlate with blood vessel location (Dray and others 2009). Microglial scar formation and axonal degeneration were observed over a five-week period after focal spinal cord injury (Farrar and others 2012). Imaging of yellow fluorescent protein (YFP)–labeled axons and GFP-labeled macrophages and microglia allowed morphological distinction between microglia and macrophages, demonstrating differences in their roles in axonal degeneration (Evans and others 2014; Wu and others 2024). Using repetitive imaging of individual axons as they branch, it was possible to show that retrograde degeneration of severed axons stops at the point of branching (Lorenzana and others 2015). The timing of calcium release after injury can also be studied to determine the effect on axon populations (Orem and others 2020). Such detailed mapping of individual axon degeneration and regeneration, the site of injury, and interactions with other cell types can only be achieved using repetitive imaging using stable, long-term, cell type–specific fluorescent markers.
Dealing with Motion Artifacts
A major recurring technical challenge was stabilizing the spine so that heartbeat and breathing motion did not interfere with image resolution. Brain imaging uses the skull as a stable platform to hold the head in place, so there is no difficulty in maintaining cells in the focal plane over time. However, spine imaging has difficulty maintaining cells in the focal plane over time because the spine is flexible and close to the moving internal organs. Another technical challenge is determining baseline fluorescence and spontaneous activity of neurons. A stable platform allows researchers to take multiple images of cells to determine baseline fluorescence and spontaneous activity, but the spinal cord can easily move, making it difficult to determine these. When using two-photon microscopy near myelinated tracts, motion artifacts are exacerbated by myelin’s property of scattering light (Wang and others 2005), reducing the overall signal. Methods to address this motion-induced technical challenge include custom spinal clamps placed immediately anterior and distal to the spinal resection (Davalos and others 2008; Johannssen and Helmchen 2010) (Fig. 1), chamber or microprism implants for anesthetized (Farrar and others 2012) and freely moving animals (Sekiguchi and others 2016; Shekhtmeyster and others 2023a), and algorithmic methods (Ahanonu and others 2024).
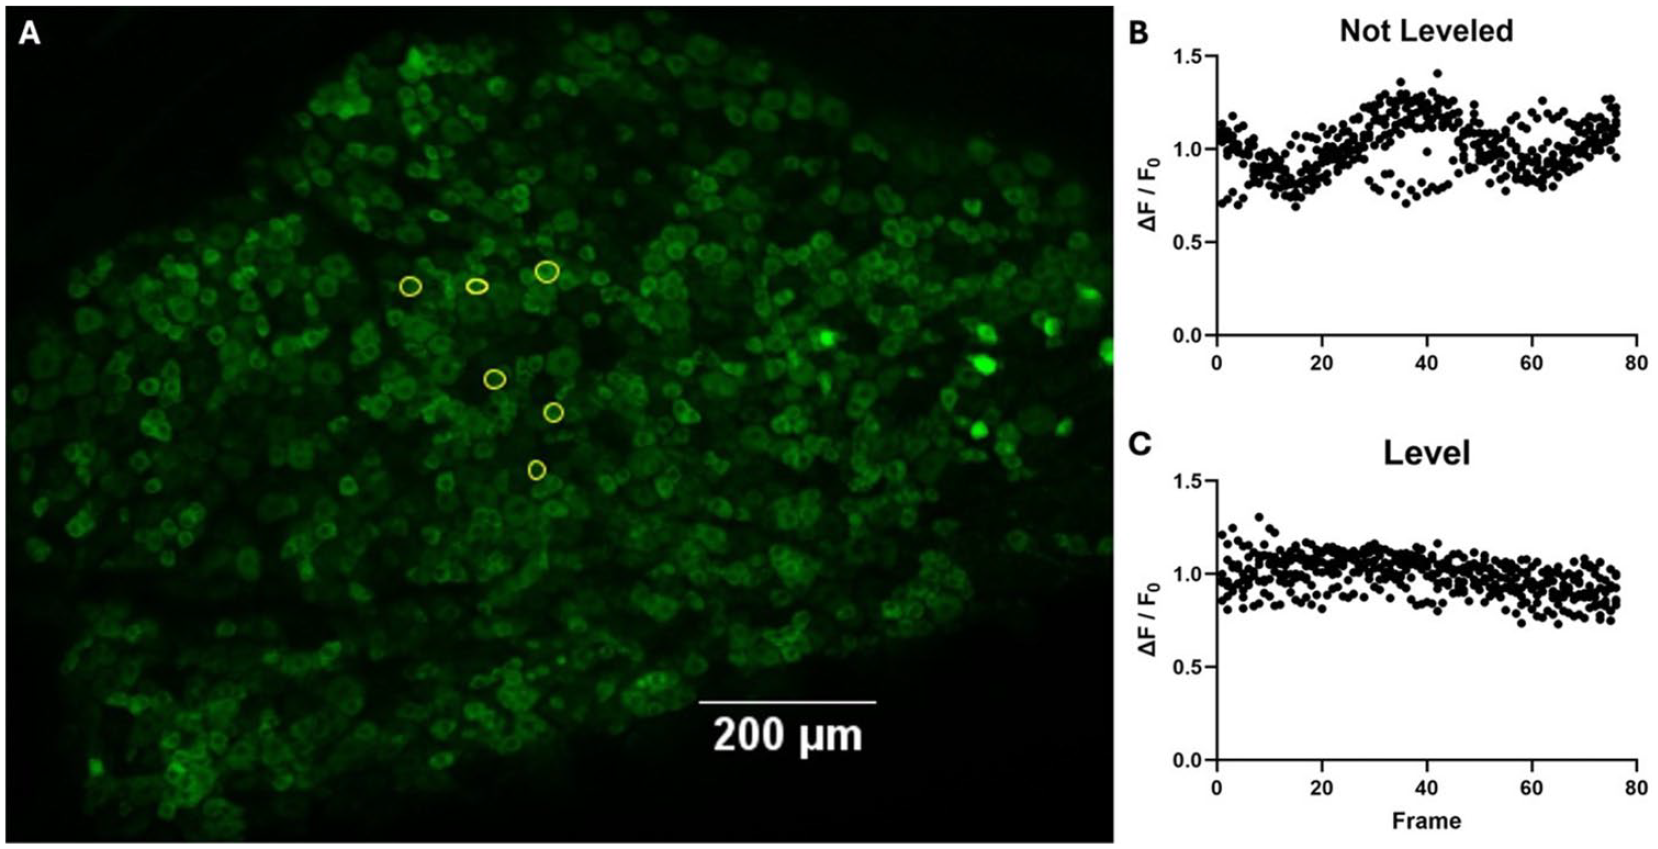
Proper leveling and adjusting are important for dorsal root ganglion imaging. Dealing with motion artifacts by adjusting the position of the spine using spinal clamps to level a lumbar 5 dorsal root ganglion imaged using confocal scanning laser microscopy in a Pirt-GCaMP3 mouse. (A) A sum intensity projection of a confocal scanning laser microscope of a lumbar 5 dorsal root ganglion without stimulus. Spinal clamps immediately rostral and caudal to the ganglion hold it in place. Six neurons are selected. (B) A graph of fluorescent intensity of the six selected neurons normalized to F0 of median intensity scanning 76 frames over 10 minutes. The six neurons are graphed at each time point. (C) The same six neurons graphed at each time point after the dorsal root ganglion has been leveled by adjusting spinal clamps.
Imaging Primary Sensory Neurons
Axonal fibers of the primary sensory ganglia innervate the skin, underlying tissues such as muscle, and spinal cord, and initiate somatosensory signals in the nervous system. The dorsal root ganglion (DRG) consists of 10,000–15,000 primary sensory neurons (Schmalbruch 1987; Sørensen and others 2003). Its dorsal location on the lateral aspect of the spine makes it particularly easy to image in vivo. The number of cells imaged in the DRG tends to be much higher than in the dorsal horn (DH). The trigeminal, geniculate, and nodose peripheral ganglia have also been successfully imaged in vivo.
Exposure Surgery of Dorsal Root Ganglia and Trigeminal Ganglia
Intact, entire primary sensory ganglia can be surgically exposed and imaged in vivo (Anderson and others 2018; Chen and others 2019b; Chisholm and others 2018; Emery and others 2016; Ghitani and others 2017; Hu 2019; Huerta and others 2023; Iseppon and others 2023; Kim and others 2016; Leijon and others 2019; Yarmolinsky and others 2016; Zheng and others 2022). This has the powerful advantage of allowing simultaneous observation of thousands of neurons, which has led to the discovery of physiologically relevant phenomena. Early experiments imaging the DRG in vivo in anesthetized animals found that, surprisingly, over 1600 primary sensory neurons could be imaged simultaneously (Chisholm and others 2018; Emery and others 2016; Ishida and others 2021; Kim and others 2016; Shannonhouse and others 2022; Zheng and others 2022). These experiments led to the discovery of the physiologically relevant phenomenon of coupled activation of adjacent primary sensory neurons in mice following nerve injury or inflammatory insult (Kim and others 2016). Similarly, sympathetic innervation of the DRG after nerve injury, but not following inflammatory insult, was detected via clusters of neurons that activated together (Zheng and others 2022). Other experiments using this system found that more than 85% of primary sensory nociceptive neurons were monomodal when comparing noxious heat, cold, and mechanical stimuli at the population level. Of note, a much higher proportion of primary sensory neurons responded to both cold and heat when cultured in vitro than in vivo (Emery and others 2016). Spontaneous neuronal activity in the L4 DRG following transection of the L5 nerve in rats was robustly increased, complementing similar but smaller-scale electrophysiological data from rats (Chen and others 2019b). Satellite glial cell Ca2+ transients can also be monitored (Jager and others 2024).
Similar imaging experiments were performed in the trigeminal ganglion of anesthetized animals following exposure surgery. When all primary sensory neurons and specific populations of TRPV1, TRPA1, and TRPM8 neurons were imaged as a population to measure calcium activity in response to temperature changes in the mouth, 90% of the temperature-sensitive neurons responded to either heat or cold, but not both. Cold-sensitive neurons had three distinct subpopulations, corresponding to adaptation to innocuous or noxious cold (Yarmolinsky and others 2016). Population-level analysis allowed the identification of subpopulations sensitive to temperature and drugs (capsaicin, AITC, and menthol) at concentrations found in food. The response of neuronal populations to temperatures ranging from 5°C to 52°C before and after drug treatment allowed the monitoring of threshold changes in thousands of individual neurons (Leijon and others 2019). Combination of trigeminal ganglion (TG) and DRG imaging revealed that CGRP neurons were thermoreceptors, a novel class of high-threshold mechanoreceptors (HTMRs), or both, but did not respond to gentle touch. Using rapidly adapting GCaMP6, the researchers were able to detect individual action potentials, measure conduction velocity between stimuli and calcium influx, and demonstrate overlapping receptive fields of individual neurons while imaging whole TG or DRG in vivo (Chisholm and others 2018).
Importantly, these imaging methods allowed population-level analysis of primary sensory neuron activity that would otherwise be difficult or impossible using electrophysiological, histological, or other methods. Specific neuron subtypes can be visualized with genetic fluorescent labeling alongside calcium indicators (Kim and others 2016) (Fig. 2). This allowed for population-level studies of changes in coding, multimodality, and neuronal activity patterns under conditions of injury. However, as with spinal cord imaging, these experiments involve terminal surgery, preclude repeated imaging over several hours, and require anesthesia during imaging. They mostly look at neurons on the surface of the ganglia. Neuronal activity patterns have often been correlated with behavior (Alshanqiti and others 2024; Chisholm and others 2018; Chivers and others 2024; Emery and others 2016; Ghitani and others 2017; Iseppon and others 2023; Ishida and others 2021; Kim and others 2016; Son and others 2024a, 2024b, 2024c; Yarmolinsky and others 2016; Zheng and others 2022), indicating that calcium imaging is a valid surrogate for neuronal activity in awake mice despite these limitations.
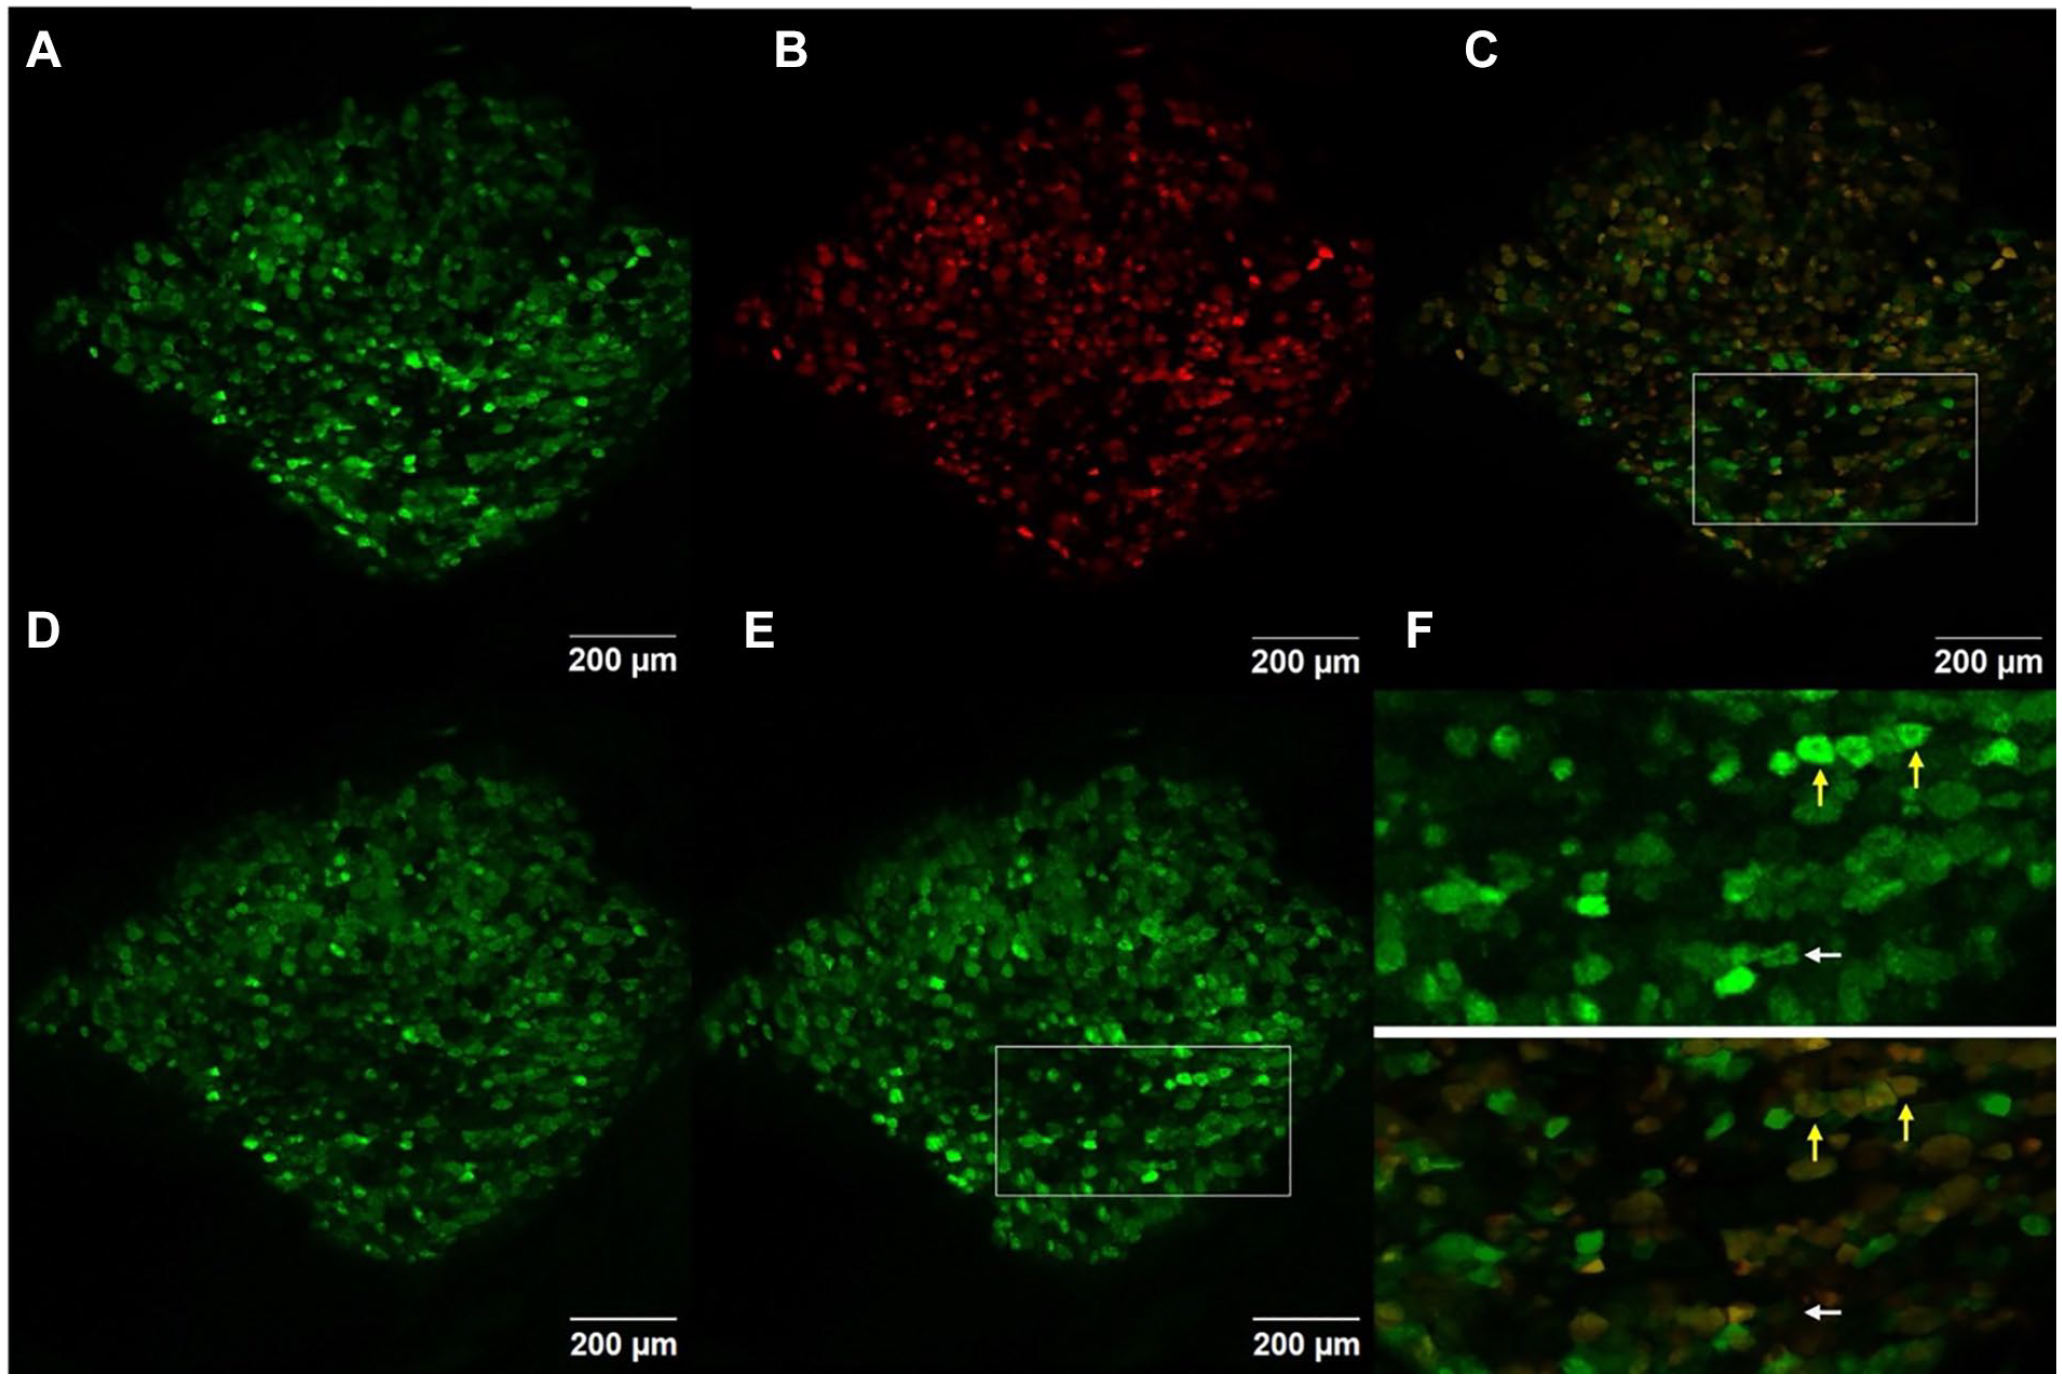
Labeling of specific neurons with Td-Tomato in a lumbar 5 dorsal root ganglion of a Pirt-GCaMP3/NPY2r-Cre td-Tomato mouse imaged using confocal scanning laser microscopy. (A) A high-resolution image of the green (GCaMP3) channel. (B) A high-resolution image of the red (Tomato) channel. (C) Merge of GCaMP3 and Tomato labels. (D) A maximum-intensity projection of GCaMP3 in the baseline period before stimulus. (E) A maximum-intensity projection of GCaMP3 during a 300-gram press on the ipsilateral hind paw. (F) Insets of boxes in panels C and E showing neurons activating during a 300-gram press that are colabeled with Tomato (yellow arrows) or not labeled with Tomato (white arrow).
Imaging of Primary Sensory Ganglia in Awake, Behaving Animals and Repetitive Imaging
Imaging DRG neurons in awake, behaving mice is technically challenging due to the flexible nature of the spine, the small size of the DRG, and the fact that the spinal resection method used to create the spinal window removes bone that holds the DRG in place. A group of researchers successfully imaged the DRG by creating a spinal fusion surgical model that minimized spinal motion and secured the imaging chamber in place relative to the microscope objective. Using this method, they were able to repeatedly image the DRG in awake mice for five weeks. Anesthetized mice showed significantly less spontaneous DRG activity than awake mice. The researchers were able to correlate DRG activity over time with phasic pain behavior after formalin injection (Chen and others 2019a). However, the number of neurons that could be imaged in this manner was much smaller than in open surgery, hindering robust population-level analysis of neuronal patterns and detection of rare but physiologically important activity patterns. Although in vivo DRG imaging is technically challenging, in vivo trigeminal ganglion imaging is a promising approach because the skull provides a naturally stable platform for mounting lenses in a manner similar to in vivo brain imaging.
Imaging of Geniculate and Nodose Ganglia
In addition to DRG imaging, a genetically encoded calcium indicators (GECIs) have been successfully used to analyze population-level activity in the geniculate ganglion (GG) in response to gustatory stimuli. A pioneering study of gustatory stimuli in the GG using implanted lenses found that most neurons responded to only one of five gustatory stimuli (Barretto and others 2015). In contrast, another study using exposure surgery found that relatively few neurons responded to multiple stimuli at low intensities, but about half responded to multiple gustatory stimuli at high intensities (Wu and others 2015). One study was able to selectively label and identify patterns of geniculate neurons in the geniculate ganglion (Asencor and others 2022). Another study investigated TrpV1 and TrpA1 agonists and glutamate applied to the vagus nerve in the nodose ganglion (Huerta and others 2023). Although these studies were able to analyze patterns, they were unable to correlate the observed neural activity with behavior. However, studies using calcium imaging were able to correlate the observed neural activity in the nodose ganglion and geniculate ganglia with a variety of physiological effects (Fowler and others 2022).
High Temporal Resolution Calcium Imaging
A drawback of calcium indicators is that they do not directly image action potentials. Temporal resolution is low, especially when imaging large areas with scanning microscopy, where each scan can take several seconds. However, using a fast version of the GCaMP6 calcium indicator, GCaMP6f, one set of researchers was able to image at frame rates of less than one second and resolve single action potentials evoked in the sciatic nerve. Interestingly, using this method, the researchers found that most neurons showed multimodal responses (to both thermal and mechanical pinch), in contrast to previously published in vivo imaging studies of DRGs (Chisholm and others 2018). These experiments demonstrate that sensitive GECIs can be used to monitor action potential-driven calcium dynamics at the population level. Furthermore, they suggest that high temporal resolution analysis of neuronal action potential-mediated calcium dynamics reveals significantly different response patterns than low temporal resolution methods. It should be noted that only one publication exists with this kind of analysis, that individual action potential–mediated calcium transients could only be observed at low firing frequency, and that action potential–mediated calcium influx, not action potentials themselves, were observed.
Imaging Ca2+ Transients: Selection and Quantification of Responses
Different methods of calcium imaging analysis can lead to different conclusions. In many fields, including but not limited to neuroimaging (Botvinik-Nezer and others 2020), the same data have been analyzed using different methods in different laboratories or within the same laboratory, resulting in different conclusions. Therefore, it is useful to review different analytical approaches to identify which neurons to include or exclude in the analysis and how to quantify Ca2+ transients.
Identification of Ca+2 Transients
The task of identifying neurons that respond to stimuli or are spontaneously activated can be accomplished using vision, software, or a combination of the two (Table 3). The first method, using vision, can be accomplished by identifying all neurons with Ca2+ markers or selectively analyzing neurons that exhibit Ca2+ transients. The advantage of visually observing all cells is that it allows for the analysis of the proportion of cells that responded (e.g., the proportion of cells with different diameters). However, this approach is usually used to observe relatively small numbers of neurons or glial cells, ranging from fewer than 20 to about 400 cells (Barretto and others 2015; Chen and others 2019a; Nishida and others 2014; Ran and others 2016; Sekiguchi and others 2016), although it can be used to characterize thousands of neurons (Son and others 2024a). The disadvantage of this analysis is that it is labor-intensive. Another disadvantage is that it requires long exposures or high laser intensity scans to identify dim cells, consequently resulting in the risk of photobleaching or phototoxicity. The second method is to use software or vision and software to find visually responsive cells (Chisholm and others 2018; Johannssen and Helmchen 2010; Chen and others 2019; Ghitani and others 2017; Yarmolinksy and other 2016; Kim and others 2016; Wu and others 2015; Barretto and others 2015; Kerschensteinner and others 2005; Dray and others 2009; Sørensen and others 2003) (Ingram and others 2024) (Table 3). Analyzing only responsive cells minimizes the need for high-intensity laser scanning or long exposure times, since cells can be identified at their brightest fluorescence intensity. This approach is therefore less likely to cause phototoxicity and is less labor-intensive than analyzing all cells. However, this analysis must be based on the total number of activated cells, not the percentage of activated cells, and therefore may require imaging a large number of animals to obtain clear results, since the size of the area that can be imaged after surgery varies. Researchers must also be careful not to overlook responsive cells, especially dim cells, which can skew the results. Multimodality can be analyzed by selecting only responsive neurons and performing a ratiometric analysis on these (e.g., examining the proportion of neurons that respond to warm temperatures that also react to cold temperatures) (Chisholm and others 2018; Emery and others 2016; Leijon and others 2019). Most published papers rely in whole or in part on humans to identify Ca2+ transients, although some recent papers have been able to rely on software entirely (Table 3).
Summary of Methods of Microscopy and Ca2+ Transient Identification and Analysis.
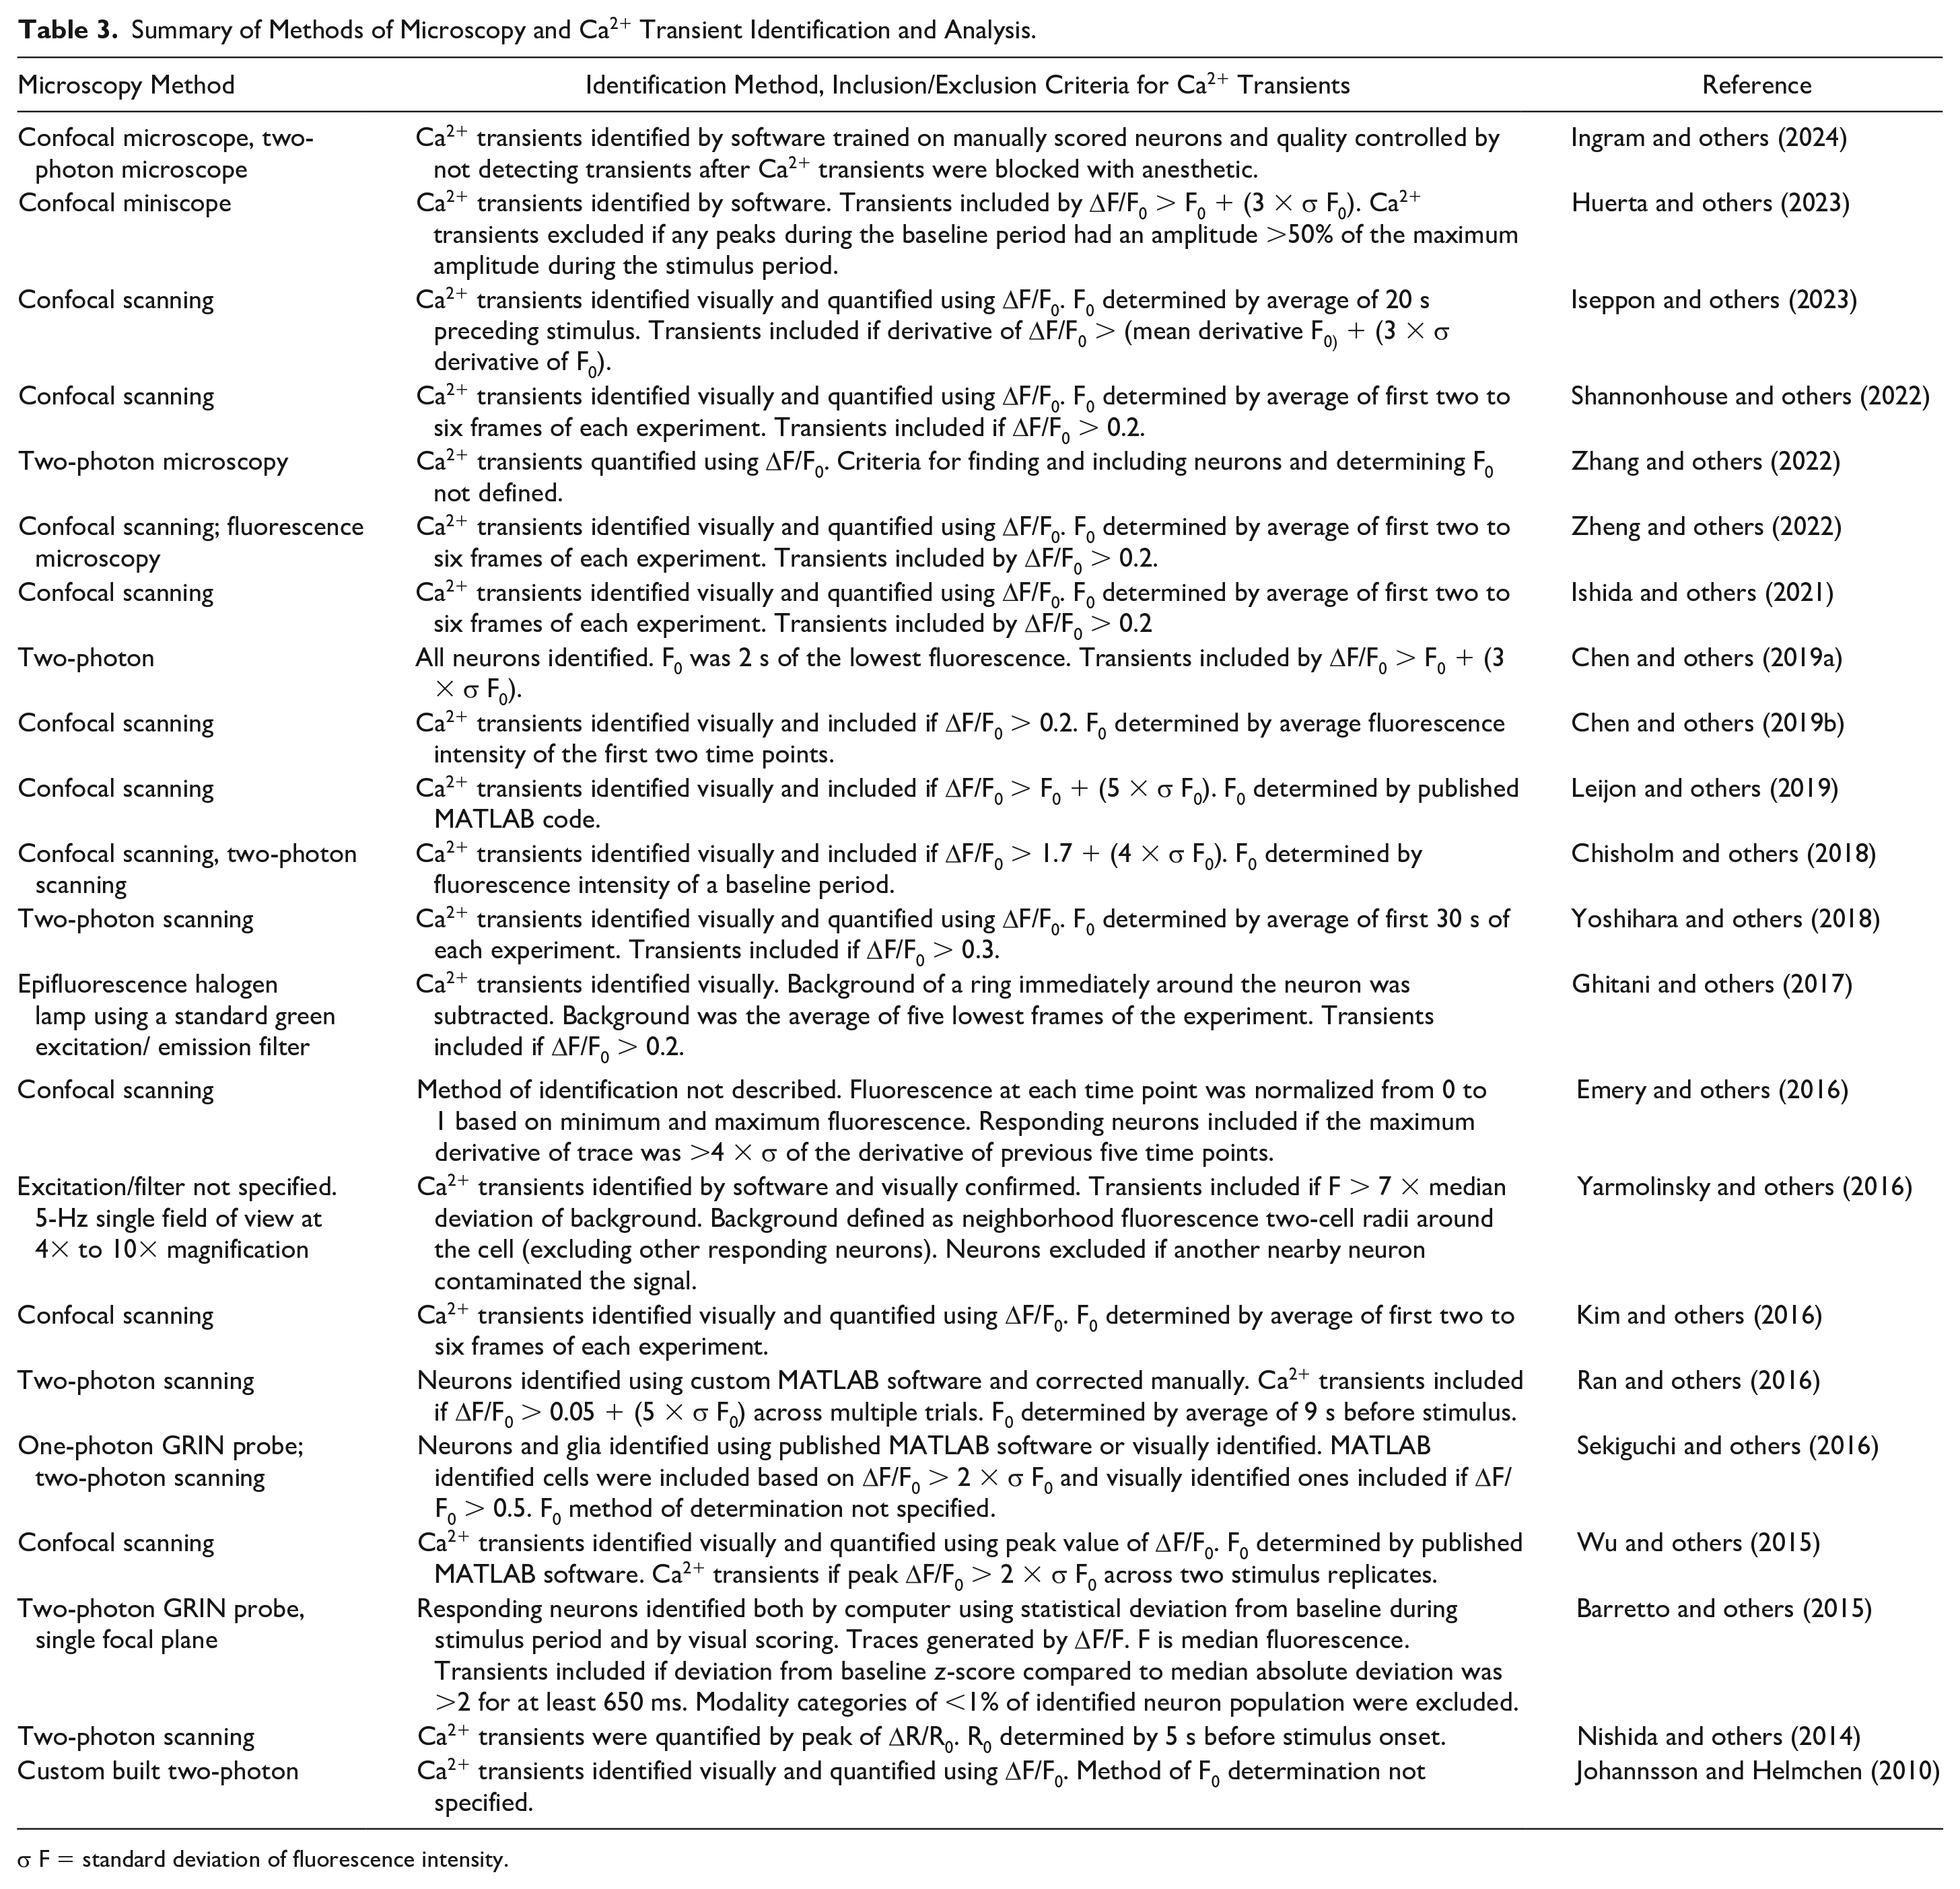
σ F = standard deviation of fluorescence intensity.
Inclusion and exclusion criteria for responding neurons vary widely (Table 3). Almost all published methods for analyzing responses are based on comparison to baseline fluorescence F0, with inclusion and exclusion based on the amplitude and/or slope of the curve. The duration of the transient can be used as an inclusion criterion. However, scanning microscopy can take several seconds to scan the imaged region. Consequently, if two neurons are activated for the same duration, one may appear in one scan and the other in two consecutive scans, depending on their location in the imaged region. Scanning microscopy images represent samples taken several seconds apart and cannot be considered a true indicator of transient duration. Scans that take several seconds each confound the analysis of the area under the curve. For such an analysis to be meaningful, a large number of transients should be imaged, or the researcher should accept that the duration cutoff represents the minimum number of neurons activated during the duration, not the total number.
Distinguishing between genuine stimulus responses and spontaneous transient responses can be problematic, especially when there are few neurons responding to a stimulus or when there is a lot of spontaneous activity (e.g., experimental lesion models). The baseline period for imaging the spinal cord and enteric ganglia may be too short to identify spontaneously active neurons. Stimuli may also inadvertently activate proprioceptors (or mechanoreceptors when studying proprioception) by inducing movement of the stimulated area. One way to address this problem is to conduct multiple trials (Ran and others 2016; Wu and others 2015). However, this approach runs the risk of desensitization. Researchers can also compare stimulus responses to known anatomical structures, such as neuron diameter (Ishida and others 2021; Kim and others 2016; Shannonhouse and others 2022) or location (Kohro and others 2020; Shekhtmeyster and others 2023a), to determine if the results are consistent with known properties of the neurons. However, these approaches cannot exclude individual neurons for spontaneous activity and risk overlooking changes in coding that occur in experimental models. Finally, researchers can image enough animals to statistically overwhelm the noise of spontaneous activity. Furthermore, if it is important to distinguish signals originating in the skin rather than underlying tissues such as muscle, methods such as fluorescent tracers injected into the site of interest will be useful.
Baseline Fluorescence
A key issue in calcium imaging analysis is how to establish F0. The skull can provide a stable platform for fixing the objective at a fixed distance from the brain or TG. This allows for establishing baseline fluorescence and analyzing for long periods of time to determine whether cells are spontaneously active. However, the spinal cord and ganglia are much more difficult to fix in place, so baseline acquisition periods can be very short. For responses to stimulation, F0 is often the average of the prestimulus period or number of frames, or a defined baseline period (Chen and others 2019b; Chisholm and others 2018; Emery and others 2016; Ghitani and others 2017; Ishida and others 2021; Johannssen and Helmchen 2010; Kim and others 2016; Nishida and others 2014; Ran and others 2016; Sekiguchi and others 2016; Shannonhouse and others 2022; Wu and others 2015). It is important to note that signals from nearby neurons can interfere with the analysis, making it difficult to tell if a faint neuron is activated and making it impossible to accurately measure ΔF/F0. The difference in fluorescence intensity between baseline fluorescence and fluorescence upon cytosolic Ca2+ influx can vary greatly among fluorophores. For example, GCaMP3 and GCaMP6f evoked in cultured neurons show up to a ninefold difference in ΔF/F0, suggesting that ΔF/F0 and exclusion/inclusion criteria are not always comparable across papers.
Fluorophore Properties
Differences in fluorophores and inclusion/exclusion criteria may be the cause of the different results. Researchers have found that the number of neurons activated differs when using different fluorophores in the dorsal root ganglion (Emery and others 2016; Kim and others 2016). In particular, the ratio of mechanical and thermal modalities differed significantly in the papers that studied DRG neuron modalities. One potential explanation is that one study included neurons based on the ratio of the derivative of the stimulus ΔF/F0 to the standard deviation of the baseline derivatives of ΔF/F0 (Emery and others 2016), while another study included neurons based on the value of ΔF/F0 (Chisholm and others 2018). A neuron could appear to be monomodal under one set of inclusion/exclusion criteria and bimodal under different criteria (Fig. 3).
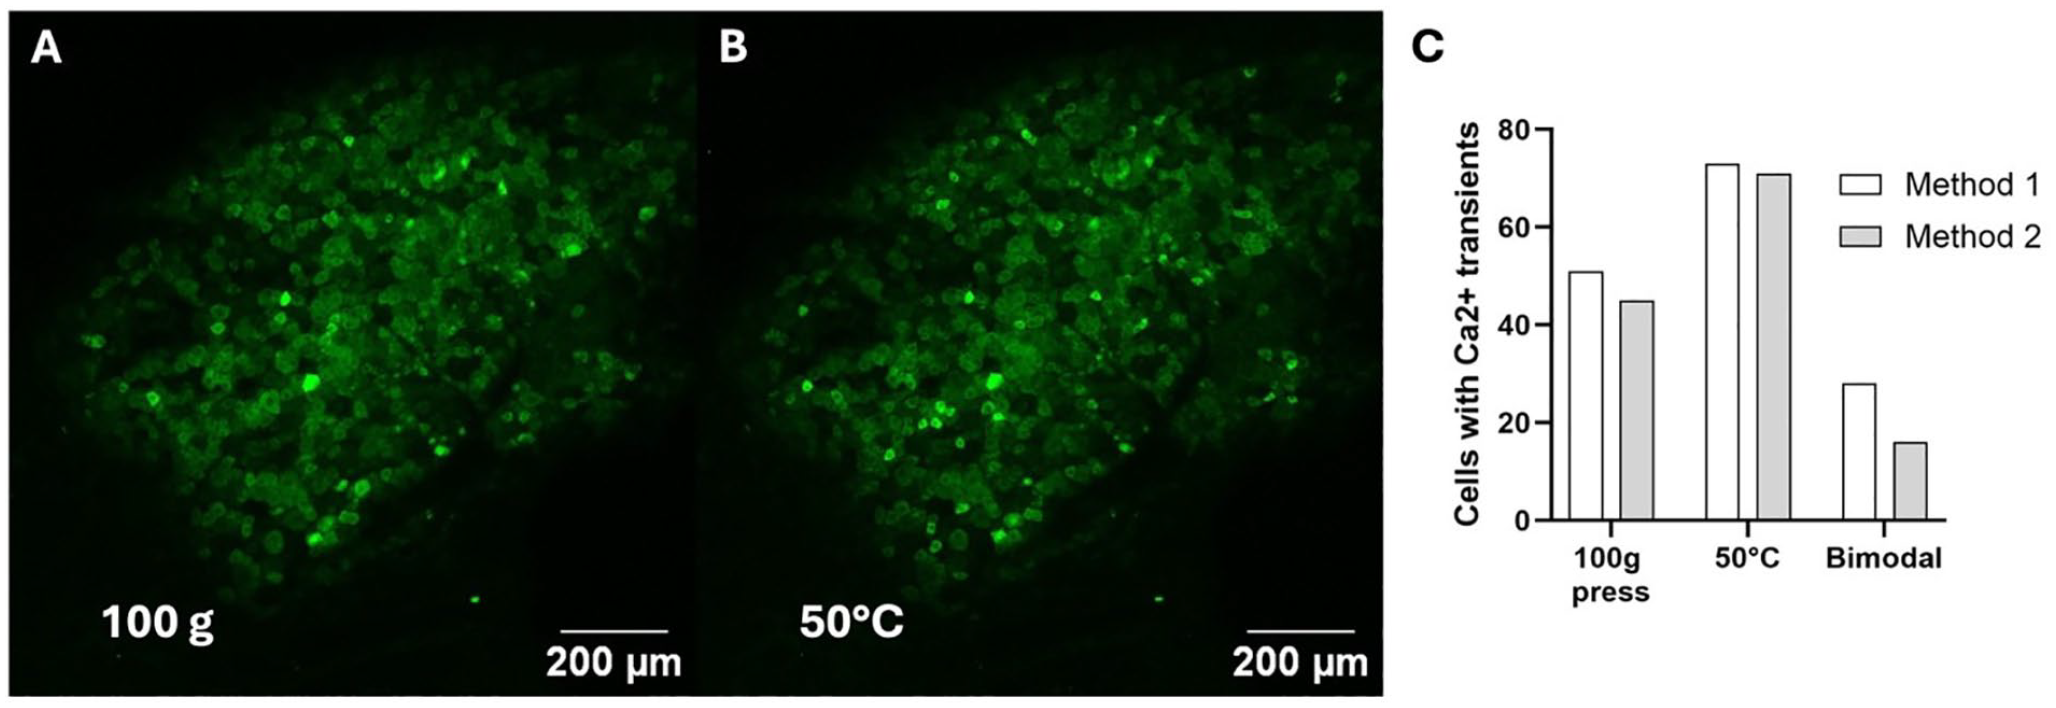
Different methods of inclusion and exclusion of neurons give different results. (A) A maximum-intensity projection of a lumbar 5 dorsal root ganglion in a Pirt-GCaMP3 mouse undergoing a 100-gram press on the ipsilateral hind paw. (B) A maximum-intensity projection of a lumbar 5 dorsal root ganglion in a Pirt-GCaMP3 mouse undergoing ipsilateral hind paw immersion in 50°C water. (C) A graph of the number of producing Ca2+ transients during a 100-gram press, 50°C water immersion, and both (bimodal) using the inclusion/exclusion criteria from Shannonhouse and others (2022) (Method 1, white bar) and Emery and others (2016) (Method 2, gray bar).
When choosing a fluorophore, considerations include whether the researcher needs to image inactive neurons, the importance of detecting dim neurons, the importance of cell type specificity for the study, and whether the microscope can sample the fluorophore at a sufficient rate for the study. Baseline brightness becomes important if the researcher chooses to look at all neurons in a region rather than just active neurons. Although the GCaMP6 isoform is brighter than other GECIs used to image spinal cord or sensory ganglia, it has low baseline fluorescence at normal physiological Ca2+ concentrations (Chen and others 2013), and in the experience of these authors, it is difficult to see inactive neurons expressing GCaMP6 in peripheral ganglia (Fig. 4). GCaMP5 has similarly low baseline brightness (Akerboom and others 2012), and GCaMP7 and GCaMP8 are much lower (Ohkura and others 2012). GCaMP3 has a higher baseline brightness (Akerboom and others 2012; Tian and others 2009), making it easier to identify inactive neurons. If the investigator plans to analyze only active neurons, the microscope should be able to detect the maximum brightness during a Ca2+ transient (for positively modulated indicators) or the baseline (for negatively modulated indicators). Ratiometric dyes emit alternate wavelengths with relative intensities depending on Ca2+ concentrations. Microscopes that are not designed to rapidly switch back and forth or to excite and detect both wavelengths simultaneously have very limited ability to image Ca2+ transients in vivo using ratiometric dyes (Bootman and others 2013) or genetically encoded FRET Ca2+ indicators.
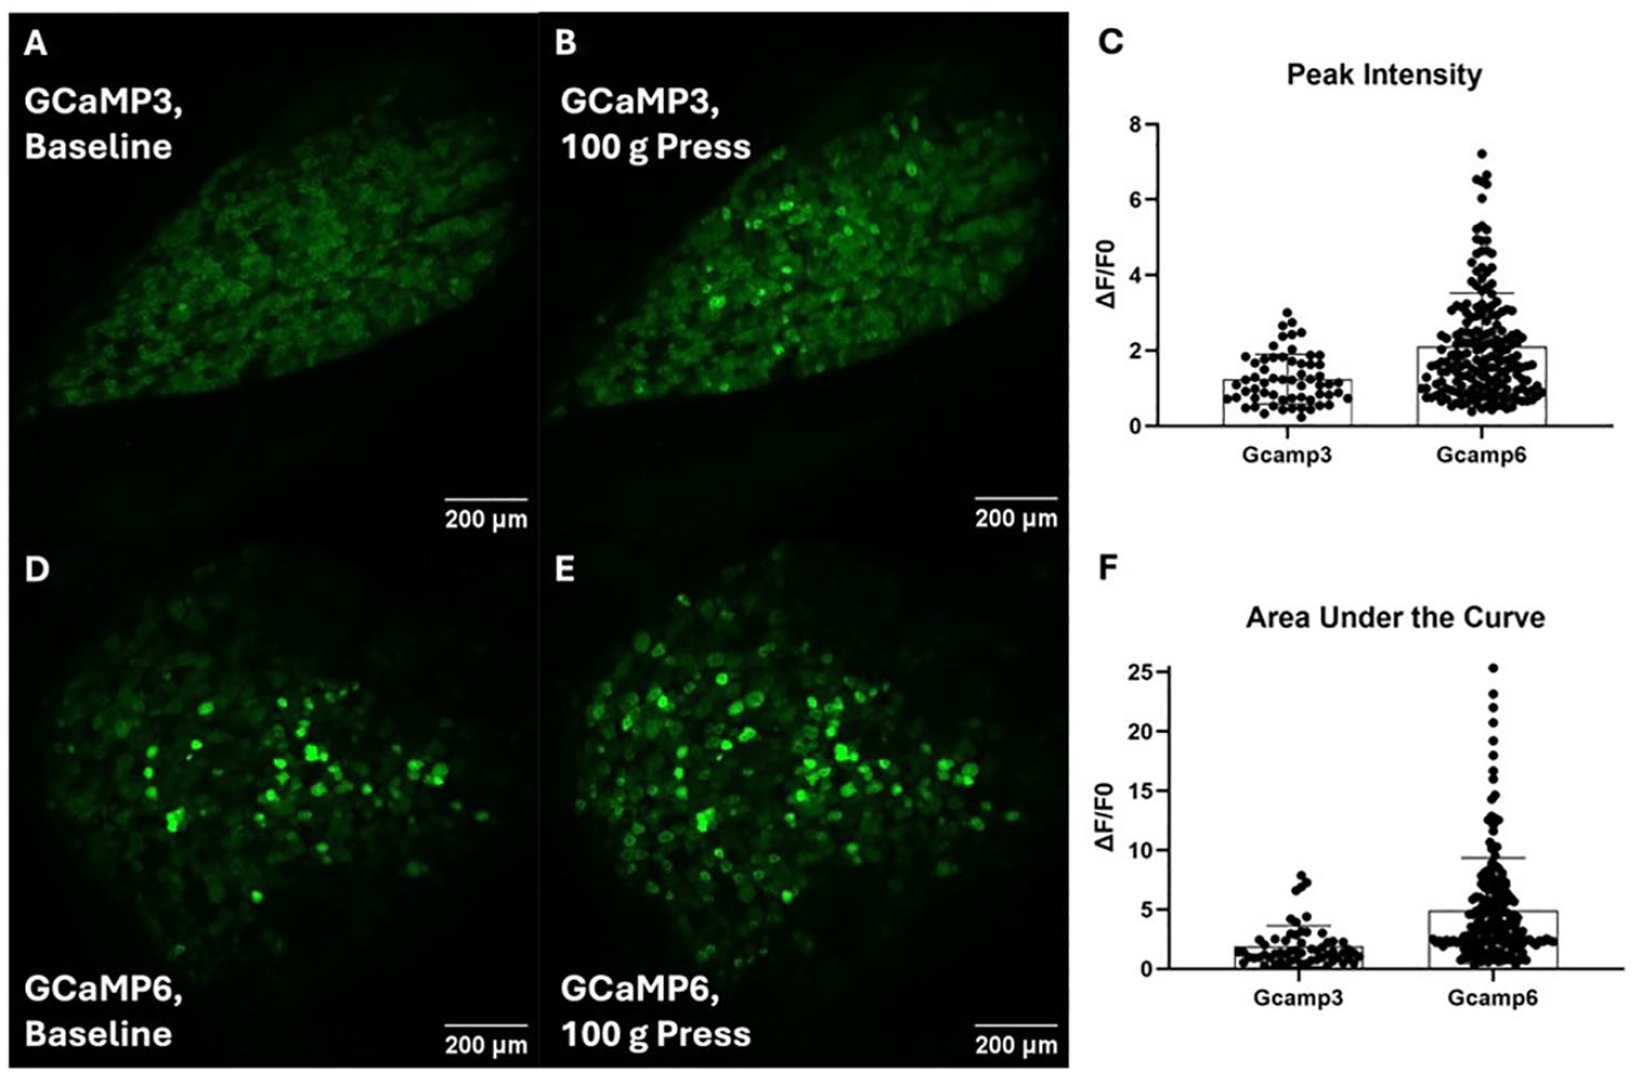
Choice of fluorophore and effect on number and intensity of Ca2+ transients detected and the ability to clearly see inactive neurons. (A) A maximum-intensity projection of a lumbar 5 dorsal root ganglion in a Pirt-GCaMP3 mouse using confocal laser scanning microscopy in the absence of stimulus. (B) The same ganglion as panel A during a 100-gram press on the ipsilateral hind paw. (C) A graph of maximum peak ΔF/F0 intensity of all individual Ca2+ transients during a 100-gram press on the ipsilateral hind paw in a Pirt-GCaMP3 mouse and a Pirt-Cre GCaMP6s mouse. (D) A maximum-intensity projection of a lumbar 5 dorsal root ganglion in a Pirt-Cre GCaMP6 mouse using confocal laser scanning microscopy in the absence of stimulus. (E) The same ganglion as panel during a 100-gram press on the ipsilateral hindpaw. (F) A graph of the area under the curve of ΔF/F0 intensity of all individual Ca2+ transients during a 100-gram press on the ipsilateral hindpaw in a Pirt-GCaMP3 mouse and a Pirt-Cre GCaMP6s mouse.
Future Directions in Primary Sensory Neuron and Spinal Cord Imaging
Imaging with calcium-sensitive fluorophores has been a powerful method for studying neurons and other cell types in vivo at the population level and for repeatedly imaging the same cells under a variety of conditions. Future directions in this research include combining calcium imaging approaches with optogenetics, imaging in awake mice, and combining imaging with other fluorescent biosensors, such as voltage-sensor imaging, and other second messengers, such as cAMP sensor imaging.
Optogenetics and Red Fluorescent GECIs
Optogenetics is a powerful way to depolarize or hyperpolarize cells via light-sensitive ion channels such as channelrhodopsin (Nagel and others 2003) and the light-activated chloride pump halorhodopsin (Zhao and others 2008). Unfortunately, the wavelengths of light required to excite green fluorescent GECIs or green fluorescent calcium-sensitive fluorescent dyes also activate many optogenetic channels, such as channelrhodopsin and halorhodopsin. A solution could be red fluorescent calcium indicators that are designed to be unaffected by the blue light used in optogenetics (Dana and others 2016; Hussein and Berlin 2020) or red-shifted channelrhodopsins (Lin and others 2013; Turrini and others 2024). By controlling genetically encoded optogenetic proteins under cell type–specific Cre recombinase, it should be possible to reversibly activate and deactivate specific cell types and analyze their effects on calcium dynamics and activity elsewhere in the neural network. This has been demonstrated in albino zebrafish larvae using acousto-optic deflectors and light sheet microscopy (Turrini and others 2024), although this technology may not be currently suitable for mammalian use.
Genetically Encoded Voltage Indicators for Ultra-Fast Imaging of Action Potentials
GECIs indirectly measure action potentials. Cytosolic calcium monitoring has been used to study efflux from the endoplasmic reticulum, mitochondria, or other types of cell surface receptors (Akerboom and others 2012; Chen and others 2013; Rieder and others 2022; Tian and others 2009). In vitro imaging using GECIs suggests that individual action potential–driven calcium influx can be directly imaged only at relatively low neuronal firing frequencies (Chisholm and others 2018; Hartung and Gold 2020). To directly study action potentials in large populations of neurons, other tools are needed. Voltage-sensitive dyes and genetically encoded voltage indicators (GEVIs) may provide important alternatives for imaging action potentials in vivo. Voltage-sensitive dyes have been used to image brain neurons in vivo (Dalphin and others 2020; Kuhn and others 2008; Roome and Kuhn 2018; Roome and Kuhn 2020). GEVIs have been used to image cortical neurons in anesthetized and awake mice, and direct comparison of patch-clamp recordings with fluorescence has demonstrated that GEVIs can be used to directly measure action potentials in vivo (Villette and others 2019). Combining GEVIs with red fluorescent GECIs allows for simultaneous analysis of total cytosolic calcium levels and voltage changes. This approach opens up the exciting possibility of distinguishing between the effects of neuronal firing and the overall physiological state of neurons and their signaling pathways and outcomes.
Other Fluorescent Indicators
In addition to GEVIs, other fluorescent biosensors for intracellular signaling, second messengers, and cell activity markers could potentially be used for in vivo imaging. These sensors can be coupled to calcium or voltage indicators, allowing changes in calcium or voltage to be correlated with cell signaling or cell activity markers. A variety of fluorescent sensors exist for various polyphosphoinositides (PPIns) that can be used to study PPIn signaling and intracellular localization (Hammond and Balla 2015). Fluorescent sensors have also been tested for a variety of other cell signaling and metabolic sensors in mammalian cells. These include cAMP (Harada and others 2017) and cGMP (Calamera and others 2019), ATP/ADP and ATP/AMP ratios (Crocker and others 2020), lactate/pyruvate ratios (Galaz and others 2020), poly-ADP-ribose (Serebrovskaya and others 2020), and extracellular ATP (Kitajima and others 2020). Many more fluorescent indicators of cell signaling and metabolism have been developed and are continuing to be developed. GRAB (GPCR-activation based) sensors are a general design that exploits conformational changes in the intracellular loop between transmembrane helices 5 and 6 of G protein-coupled receptors, which has enabled the design of a wide range of fluorescent indicators with diverse excitation/emission spectra and sensitivity to a variety of extracellular ligands (Dong and others 2022; Dong and others 2023; Feng and others 2019; Jing and others 2020; Peng and others 2020; Qian and others 2023; Sun and others 2020; Wan and others 2021; Wu and others 2023; Zeng and others 2023). A major advantage of fluorescent sensors is that many standard analyses of the signal require tissue destruction, whereas imaging with fluorescent sensors allows real-time correlation with a resolution of two seconds or even subseconds. The variety of signals and analysis speeds means that fluorescent imaging has the potential to revolutionize the analysis of cell signaling in neurons in vivo. The combination of different excitation and emission wavelengths for GECIs and other sensors will be important for such studies, as they require simultaneous monitoring of calcium and other types of molecules.
Anesthesia and Repetitive Longitudinal Imaging
The choice of whether to allow imaging with or without anesthesia is important and can have a major impact on the cellular activity and pattern generation that can be achieved in the types of experiments that can be performed in vivo. The anesthetics required for exposure surgery can disrupt the activity of certain neurons and other cell types (Chen and others 2019a; Sekiguchi and others 2016; Shekhtmeyster and others 2023a; Sullivan and Sdrulla 2022). Implanting chambers to image awake animals can avoid this problem but presents unique challenges. Awake animals are mobile and therefore cannot simply be placed under the objective of a conventional microscope, or a scanning confocal or multiphoton microscope, for imaging in vivo. Specialized stable platforms for the imaging window must be mounted to the tissue to be imaged in a fixed position (Fig. 5). As a result, fewer cells can be imaged in awake mice than in anesthetized mice following exposure surgery (tens vs hundreds to thousands). Current techniques therefore have limitations in detecting the broad population-level changes that can be observed and in observing rare but physiologically important patterns of neural activity. However, the observation chamber has the important advantage of allowing repeated imaging of the same cells over multiple sessions spaced several days or weeks apart, allowing experiments such as observing the regeneration and degeneration of individual damaged axons, the neuroplasticity of damaged neurons, or the resulting changes in network activity, and helping to address questions about how anesthesia itself affects neural activity patterns and responses.
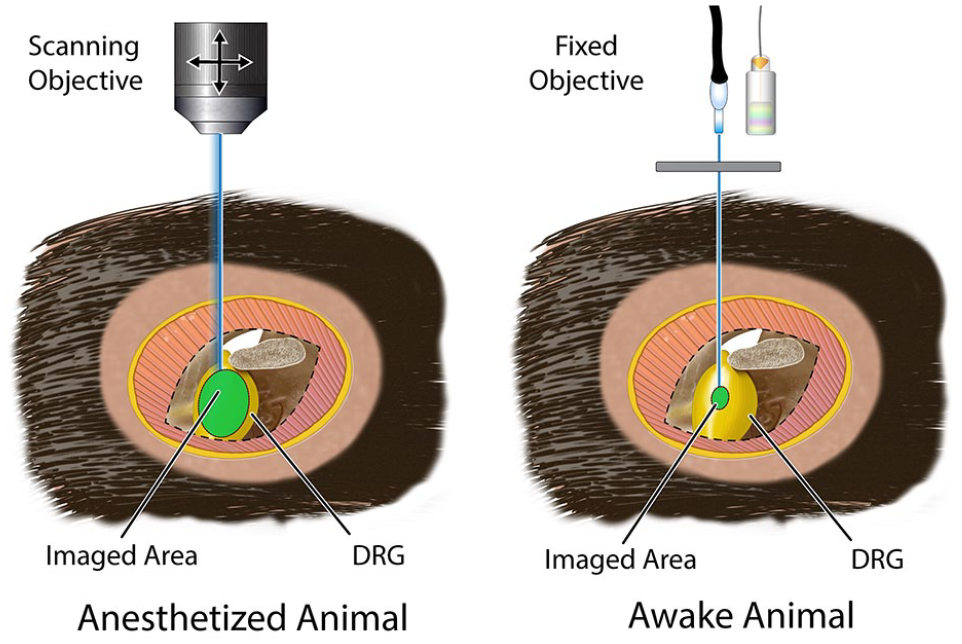
Advantages and disadvantages of imaging anesthetized vs awake animals. (Left) Anesthetized mice can be placed under the scanning objective of a conventional microscope. This allows for wide and deep imaging of tissues such as the dorsal root ganglion (or dorsal horn, trigeminal ganglion, etc.), allowing researchers to monitor calcium activity in hundreds or thousands of cells. However, anesthesia disrupts normal neural activity, and experiments are usually terminal. (Right) Tissues can be imaged repeatedly over several weeks or months in awake and freely moving mice without anesthesia disrupting normal neural activity. However, this requires a special stable platform that is mounted at a fixed distance from the tissue during the imaging session. This significantly limits the number of cells that can be imaged in a single imaging session.
Chemigenetic and mNeon Green Indicators
Improving the signal-to-background ratio would improve researchers’ ability to detect intracellular calcium changes in neurons where the signal is weak. One approach to this problem is to use chemogenetic sensors or to improve the maximum fluorescence of GECIs (Chai and others 2023). Chemogenetics involves engineering proteins to specifically bind to an injected chemical indicator. This allows researchers to combine the cell-type specificity of a genetic indicator with the sensitivity, brightness, absorbance/emission spectra, and photostability of a chemical indicator (Chai and others 2023; Hoelzel and Zhang 2020; Zhu and others 2023). mNeon Green is a much brighter fluorescent protein than GFP (Shaner and others 2013). Using the GCaMP protein as a model, similar NCaMP proteins have been engineered (Li and others 2023; Subach and others 2020), some of which (NEMO components) have much higher ΔF/F0 than GCaMP6 (Li and others 2023). However, we were unable to find published examples of chemogenetics or NEMO in spinal cord or peripheral ganglia in vivo.
Conclusions
Imaging calcium activity is one of the most powerful methods for studying neural network activity in the primary somatosensory ganglia and the spinal cord. Exposure surgery can visualize large areas of the spinal cord and entire peripheral ganglia but requires anesthesia. In contrast, implanting an observation chamber allows monitoring of neurons in relatively small areas. Calcium signaling can indirectly monitor action potentials in up to thousands of neurons. New red fluorescent calcium indicators allow researchers to combine the power of optogenetics with calcium signaling. Combining red or green emitting calcium indicators with other types of indicators, such as voltage, metabolic indicators, or cAMP, reduces these confounding factors.
Cytosolic calcium levels can be used to monitor action potentials via calcium influx, ligand binding to voltage-gated and ligand-gated channels, and calcium efflux from the endoplasmic reticulum or mitochondria.
A variety of sensors and manipulations can be combined with calcium imaging (Fig. 6). Optogenetics using channelrhodopsin and halorhodopsin are stimulated by blue wavelengths and can be used with red calcium indicators. Depending on the emission wavelength, green or red fluorescent GECIs can be imaged simultaneously with markers of intracellular signaling (e.g., cAMP, cGMP, PPIn) or cell metabolism (e.g., AMP/ATP ratio, lactate/pyruvic acid ratio). A wide variety of GRAB sensors detect extracellular neurotransmitters. Fluorescent indicators allow rapid detection and analysis of these cell signaling markers during imaging without damaging the tissue under physiological conditions in vivo. Voltage-sensitive dyes or GEVIs can directly detect voltage changes. Combining fluorescent voltage sensors with fluorescent calcium sensors that emit at different wavelengths allows simultaneous monitoring of voltage changes and intracellular calcium dynamics.
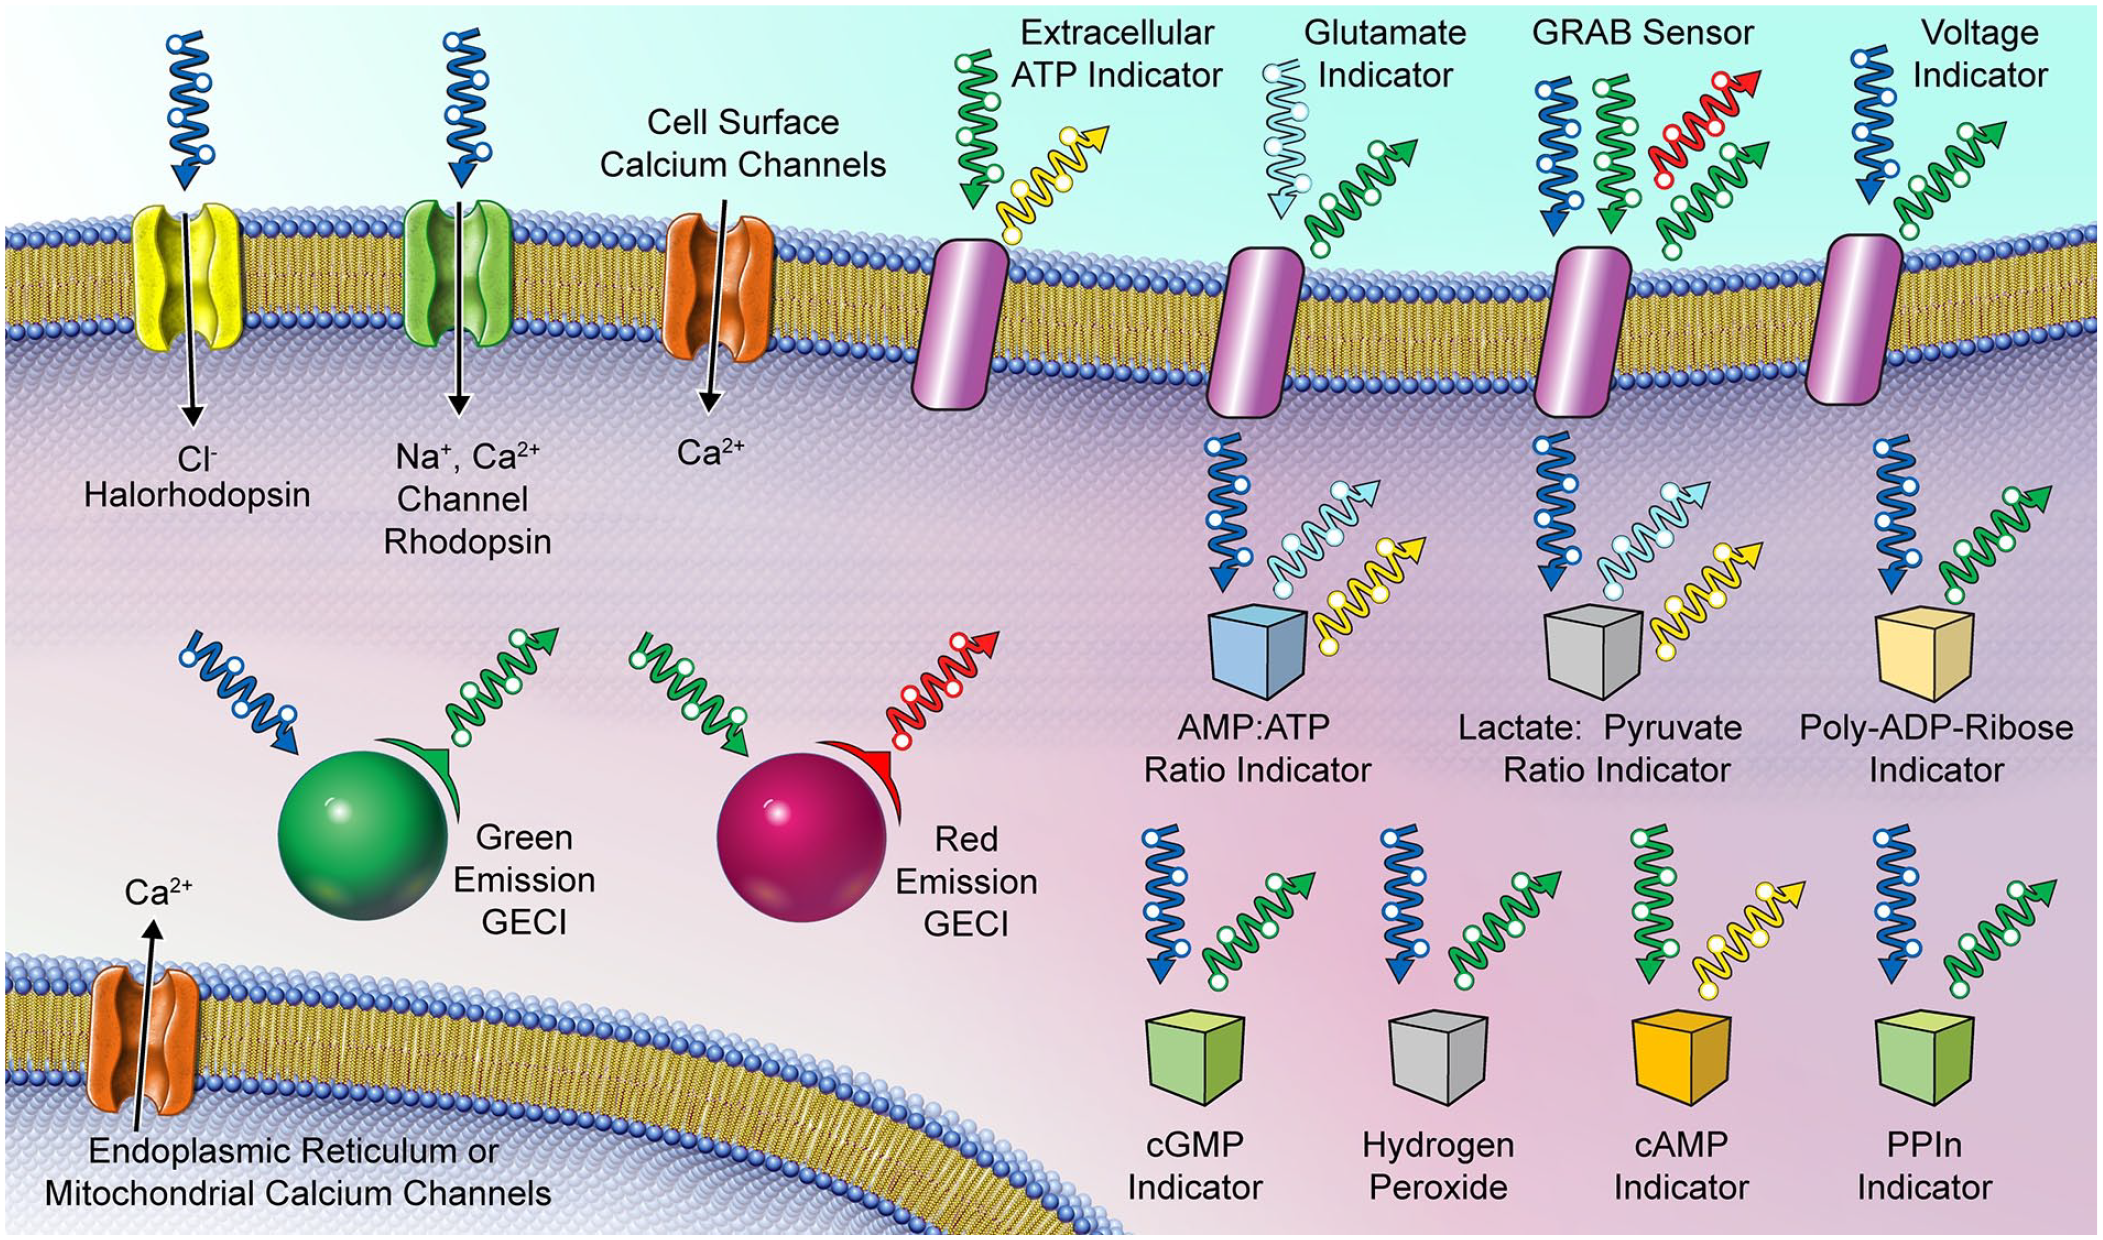
Simultaneous imaging of calcium activity and other cellular activity markers.
Footnotes
Acknowledgements
We thank members of the Kim laboratory for helpful comments and discussion.
Declaration of Conflicting Interests
The author(s) declared no potential conflicts of interest with respect to the research, authorship, and/or publication of this article.
Funding
The author(s) disclosed receipt of the following financial support for the research, authorship, and/or publication of this article: This work was supported by National Institutes of Health Grant (R01DE031477 and R01NS128574 to Y.K.) and a STAR Award from the University of Texas system and NIH T32DE014318 COSTAR award (J.S.).