
Abstract
Introduction
Neuroendocrine tumors (NETs) are rare and heterogeneous. Everolimus, an inhibitor of the mammalian target of rapamycin (mTOR), is widely used in gastrointestinal and pancreatic NETs (GEP-NETs). Owing to the lack of validated biomarkers, exploratory analyses of molecular pathways may help identify subgroups that derive clinical benefit from everolimus.
Methods
We conducted a retrospective observational cohort study of patients with GEP-NETs who received everolimus and underwent tumor next-generation sequencing (NGS). Genomic alterations were categorized into seven predefined signaling pathways (PI3K/AKT/mTOR, MAPK, DNA damage repair (DDR), developmental, epigenetic regulation, JAK–STAT, and cell-cycle regulation), and patients were classified as mutated (≥1 alteration) or wild-type. Clinical outcomes included objective response rate (ORR), disease control rate (DCR), progression-free survival (PFS), and overall survival (OS). Associations between pathway alterations and outcomes were assessed.
Results
Twenty-eight patients were included. Median PFS was 26.4 months (95% CI, 17.3–37.1) and median OS was 41.0 months (95% CI, 36.6–not reached [NR]). Alterations in the PI3K/AKT/mTOR pathway were associated with more favorable treatment outcomes, including a higher ORR (47.6% vs. 14.3%; OR, 5.17; 95% CI, 0.49–275.05; p=0.191) and a significantly higher DCR (85.7% vs. 28.6%; OR, 13.0; 95% CI, 1.40–199.5; p=0.009). Survival outcomes also tended to be longer in this group compared with wild-type tumors, with median OS of 59.0 vs. 40.8 months (p=0.321) and median PFS of 26.4 vs. 18.6 months (p=0.858). In contrast, alterations in DDR-related genes were associated with lower ORR and DCR, while alterations in cell-cycle regulation pathways were associated with shorter OS and PFS and numerically lower response rates. No significant differences in survival or response outcomes were observed for MAPK, JAK–STAT, epigenetic, or developmental pathways.
Conclusions
Pathway-level genomic alterations were associated with differential clinical benefit from everolimus in GEP-NETs, with PI3K/AKT/mTOR alterations suggesting greater benefit, while DDR and cell-cycle alterations indicated reduced benefit. Despite the small cohort, these findings support the potential of pathway-based biomarkers and warrant prospective validation.
Keywords
Introduction
Gastro-entero-pancreatic neuroendocrine tumors (GEP-NETs) are rare, heterogeneous malignancies that account for less than 2% of all gastrointestinal cancers, with an annual incidence of approximately 3–5 cases per 100,000 population.1,2 Their incidence has been steadily increasing worldwide, with marked rises reported in Europe and North America, and similar trends observed in Asian countries including Japan and Korea, particularly for tumors of the small intestine, rectum, and pancreas. According to the current WHO classification, NETs are well-differentiated and graded (G1–G3) by mitotic count and Ki-67 index, whereas neuroendocrine carcinomas (NECs) are poorly differentiated.
Surgical resection remains the only curative option for localized disease. For advanced disease, somatostatin analogues (SSAs) help control hormone-related symptoms and delay tumor progression, while targeted agents are indicated upon progression. The mammalian target of rapamycin (mTOR) inhibitor everolimus has demonstrated significant efficacy in phase III trials. In the RADIANT-3 and RADIANT-4 studies, everolimus improved median progression-free survival (PFS) to approximately 11 months compared with 4–5 months with placebo in advanced pancreatic, gastrointestinal, and lung NETs,3,4 thereby establishing its role as a standard therapy for progressive GEP-NETs.
Despite the availability of effective targeted agents, treatment decisions remain largely guided by histological grade and stage, with limited integration of molecular data. Next-generation sequencing (NGS) studies have highlighted the molecular heterogeneity of NETs and suggest that specific alterations may influence therapeutic sensitivity or resistance. Increasing evidence indicates that GEP-NETs harbor recurrent alterations in genes such as MEN1, DAXX, and ATRX, as well as in canonical signaling pathways. 5 Given the central role of the PI3K/AKT/mTOR pathway in NET pathogenesis—through both germline syndromes (e.g., NF1, TSC1, TSC2) and somatic alterations (e.g., PTEN, PIK3CA)—it is biologically plausible that pathway-level alterations influence sensitivity to mTOR inhibition. Moreover, other canonical signaling pathways may also modulate treatment outcomes. We therefore investigated the association between pathway-level genomic alterations and clinical benefits from everolimus in patients with GEP-NETs, aiming to provide hypothesis-generating evidence for molecularly guided treatment strategies. 6
Materials and Methods
Patients
This exploratory, single-center, retrospective cohort study consecutively included all patients with GEP-NETs who received everolimus between 2020 and 2025, with initial diagnosis dates ranging from 2008 to 2023. Eligible patients had available NGS results and complete clinical outcome data. All patient data were de-identified prior to analysis. Everolimus was predominantly administered after disease progression on prior therapies rather than as first-line treatment.
Clinical variables collected from medical records included age, sex, primary tumor site, grade, Ki-67 index, tumor size, functionality, lymph node involvement, distant metastases (liver, bone, and other sites), and prior treatments. Everolimus was administered orally at a dose of 10 mg once daily until disease progression or unacceptable toxicity.
Next-Generation Sequencing and Pathway Analysis
Tumor genomic profiling was performed on formalin-fixed, paraffin-embedded tissue using targeted NGS panels. NGS of tumor samples was performed with the TruSight Oncology 500 panel (Illumina, San Diego, CA, USA), which targets over 500 cancer-related genes. Variants were called, annotated, and classified according to the AMP/ASCO/CAP guidelines. For pathway-level analysis, gene alterations were grouped into seven canonical signaling pathways: (1) PI3K/AKT/mTOR, (2) MAPK (RTK–RAS), (3) JAK–STAT, (4) developmental pathways (WNT/β-catenin, NOTCH, TGF-β/SMAD), (5) DNA damage repair (DDR), (6) epigenetic/chromatin regulation, and (7) cell-cycle regulation (p53–CDKN1A–RB) based on The Cancer Genome Atlas (TCGA). Genes with potential membership in multiple pathways were assigned to their primary function (e.g., TSC1/TSC2 to PI3K/AKT/mTOR), while acknowledging known cross-talk (e.g., ERK/RSK phosphorylation of TSC2/Raptor). Receptor tyrosine kinase (RTK) genes, which regulate multiple cascades, were included in all relevant pathways. Patients were classified as “mutated” if ≥1 alteration was detected in a pathway and “wild-type” otherwise.
Statistical Analysis
Survival outcomes were estimated using the Kaplan–Meier method and compared with the log-rank test. Hazard ratios (HRs) and 95% confidence intervals (CIs) were derived from Cox proportional hazards models. Overall survival (OS) was defined as the time from initiation of everolimus to death from any cause or last follow-up. Progression-free survival (PFS) was defined as the time from initiation of everolimus to radiologic or clinical disease progression. The objective response rate (ORR) was defined as the proportion of patients achieving complete or partial response, and disease control rate (DCR) included complete response, partial response, or stable disease, according to Response Evaluation Criteria in Solid Tumors (RECIST) version 1.1. ORR and DCR were compared using Fisher’s exact test. All statistical analyses were performed using R software, version 4.5.1 (R Foundation for Statistical Computing, Vienna, Austria).
This study was reviewed and deemed exempt from ethics approval by the Institutional Review Board of Samsung Medical Center (File No. 2025-09-173-001), and the requirement for informed consent was waived owing to the retrospective nature of the study and the use of de-identified data. The reporting of this study conforms to the Strengthening the Reporting of Observational Studies in Epidemiology (STROBE) guidelines. 7
Results
Baseline Characteristics
Baseline Clinicopathologic Characteristics of Patients Included in the Study

Patient demographics and disease characteristics at baseline are summarized. Variables include sex, primary tumor site (foregut, midgut, hindgut), tumor size, functional status, Ki-67 proliferation index, presence of bone metastasis, and prior treatment history. Values are presented as number of patients (percentage).
Abbreviations: IQR, Interquartile Range, LN, lymph node, Tx, treatment.
Overall Survival (OS) and Progression-Free Survival (PFS)
In the overall cohort, the median PFS was 26.4 months (95% CI, 17.3–37.1), and the median OS was 41.0 months (95% CI, 36.6–not reached (NR)) (Figure 1A and B). The estimated 3- and 5-year OS rates were 26.2% (95% CI, 12.2–56.5) and 13.1% (95% CI, 2.7–64.0), respectively, while the corresponding PFS rates were 26.2% (95% CI, 12.2–56.5) and 13.1% (95% CI, 2.7–64.0). Survival estimates at 5 years should be interpreted with caution due to the limited number of patients at risk. Overall Survival (OS) and Progression-Free Survival (PFS) in the overall cohort
Overall Survival (OS) and Progression-Free Survival (PFS) According to Pathway-Level Genomic Alterations
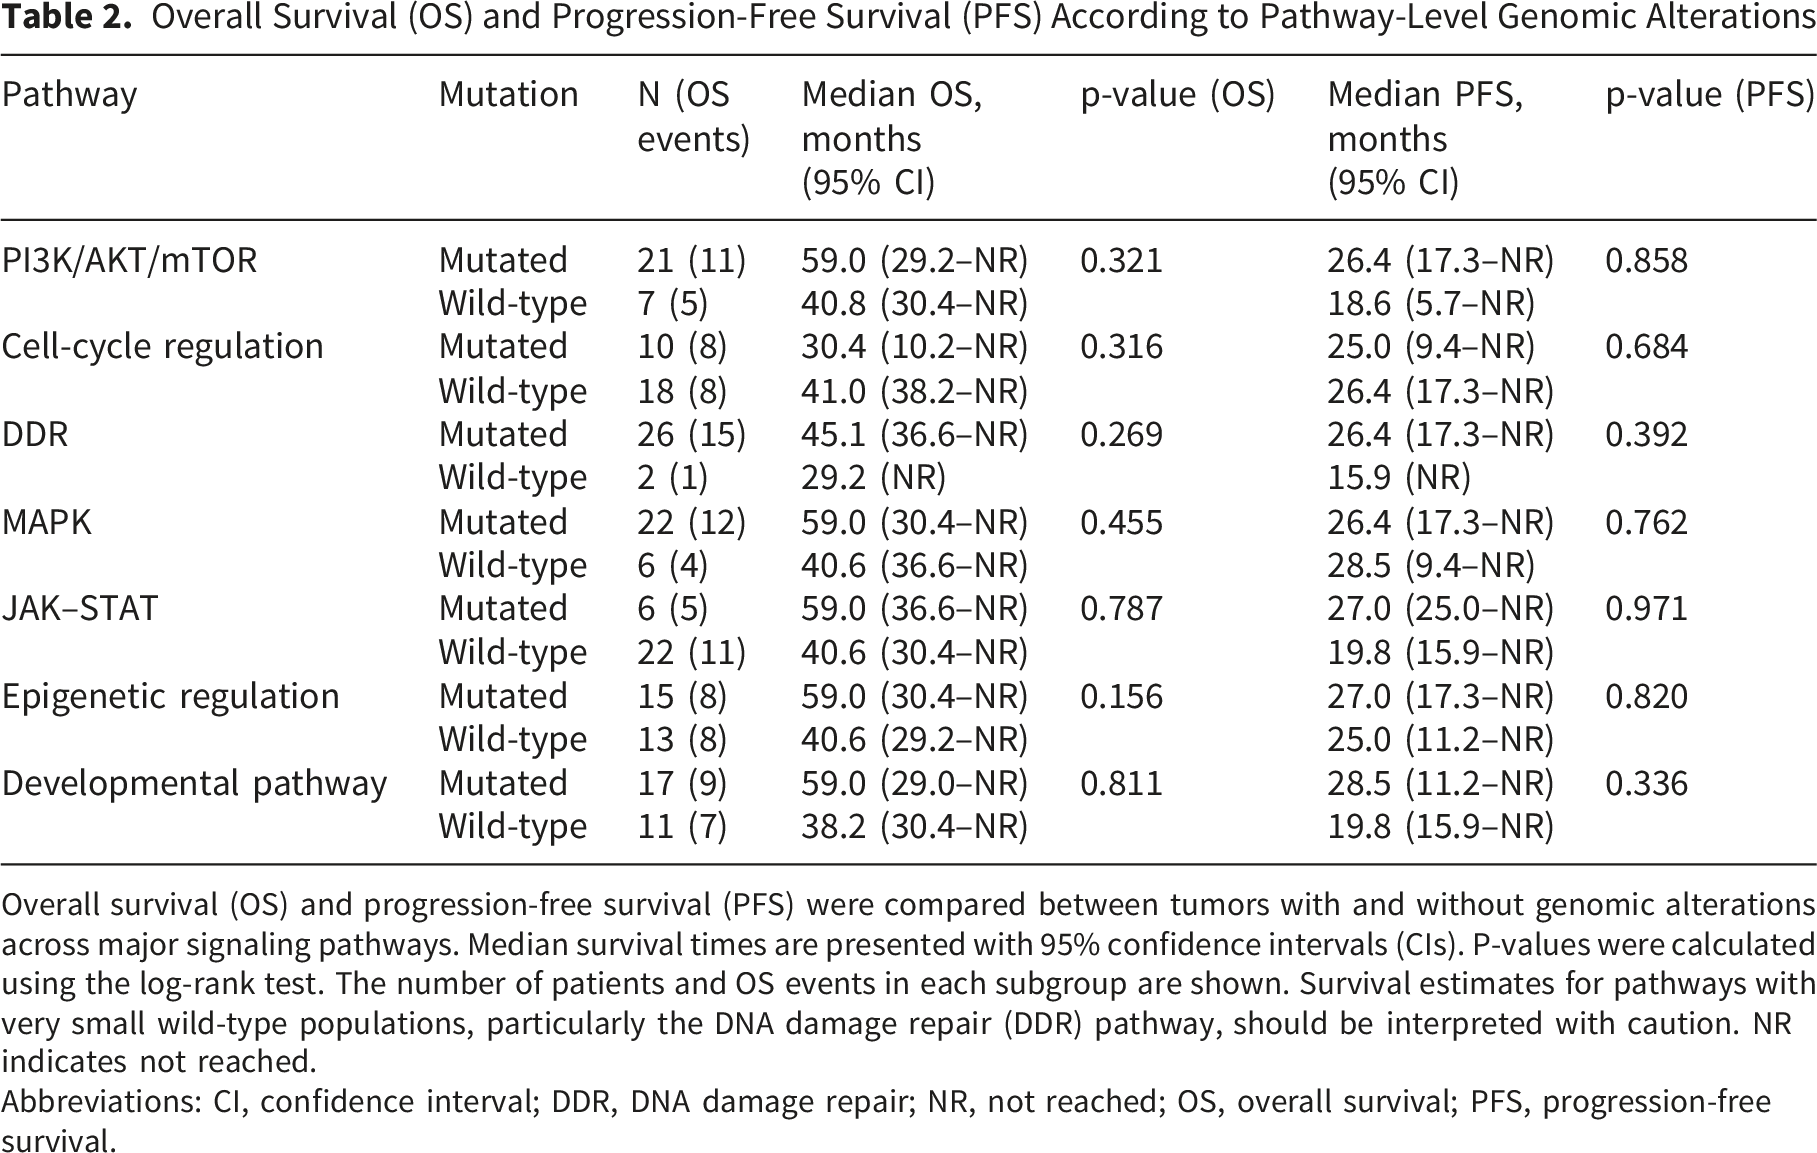
Overall survival (OS) and progression-free survival (PFS) were compared between tumors with and without genomic alterations across major signaling pathways. Median survival times are presented with 95% confidence intervals (CIs). P-values were calculated using the log-rank test. The number of patients and OS events in each subgroup are shown. Survival estimates for pathways with very small wild-type populations, particularly the DNA damage repair (DDR) pathway, should be interpreted with caution. NR indicates not reached.
Abbreviations: CI, confidence interval; DDR, DNA damage repair; NR, not reached; OS, overall survival; PFS, progression-free survival.

Survival outcomes according to pathway-level genomic alterations
For the cell-cycle regulation pathway, 10 patients were mutated (8 OS events) and 18 were wild-type (8 OS events). Median OS was 30.4 months (95% CI, 10.2–NR) versus 41.0 months (95% CI, 38.2–NR; p=0.316), and median PFS was 25.0 months (95% CI, 9.4–NR) versus 26.4 months (95% CI, 17.3–NR; p=0.684) (Figure 2B).
In the DDR pathway, 26 patients were mutated (15 OS events) and only 2 were wild-type (1 OS event). Median OS was 45.1 months (95% CI, 36.6–NR) compared with 29.2 months (95% CI, NR; p=0.269), and median PFS was 26.4 months (95% CI, 17.3–NR) versus 15.9 months (95% CI, NR; p=0.392). Given the very small number of wild-type patients, these findings should be interpreted with caution (Figure 2C).
For the MAPK pathway, 22 patients had mutations (12 OS events) and 6 were wild-type (4 OS events). The median OS was 59.0 months (95% CI, 30.4–NR) compared with 40.6 months (95% CI, 36.6–NR; p=0.455), while the median PFS was 26.4 months (95% CI, 17.3–NR) versus 28.5 months (95% CI, 9.4–NR; p=0.762) (Supplemental Figure 1A).
In the JAK–STAT pathway, 6 patients were mutated (5 OS events) and 22 were wild-type (11 OS events). The median OS was 59.0 months (95% CI, 36.6–NR) versus 40.6 months (95% CI, 30.4–NR; p=0.787), and the median PFS was 27.0 months (95% CI, 25.0–NR) compared with 19.8 months (95% CI, 15.9–NR; p=0.971) (Supplemental Figure 1B).
For the epigenetic regulation pathway, 15 patients were mutated (8 OS events) and 13 were wild-type (8 OS events). The median OS was 59.0 months (95% CI, 30.4–NR) compared with 40.6 months (95% CI, 29.2–NR; p=0.156). The median PFS was 27.0 months (95% CI, 17.3–NR) versus 25.0 months (95% CI, 11.2–NR; p=0.820) (Supplemental Figure 1C).
In the developmental pathway, 17 patients carried mutations (9 OS events) and 11 were wild-type (7 OS events). The median OS was 59.0 months (95% CI, 29.0–NR) versus 38.2 months (95% CI, 30.4–NR; p=0.811), and the median PFS was 28.5 months (95% CI, 11.2–NR) versus 19.8 months (95% CI, 15.9–NR; p=0.336) (Supplemental Figure 1D).
Overall Objective Response Rate (ORR) and Disease Control Rate (DCR)
Among the 28 patients evaluable for radiologic response, the ORR was 39.3% (11 of 28), and the DCR was 71.4% (20 of 28).
In pathway-level analyses (Figure 3A and B), for the PI3K/AKT/mTOR pathway (altered in 21 patients, 75.0%), the ORR was 47.6% (10 of 21) compared with 14.3% (1 of 7) in wild-type tumors; odds ratio (OR), 5.17; 95% CI, 0.49–275.05; p=0.191, and the DCR was 85.7% (18 of 21) versus 28.6% (2 of 7) (OR, 13.0; 95% CI, 1.40–199.5; p=0.009). (A) Bar plots showing ORR according to mutation status in major pathways. Patients were classified as mutated (≥1 alteration) or wild-type for each signaling pathway. Objective response rate (ORR): The PI3K/AKT/mTOR pathway showed numerically higher ORR in mutated tumors compared with wild-type (47.6% vs. 14.3%, p=0.191). DDR alterations were associated with lower ORR relative to wild-type (34.6% vs. 100%, p=0.146). No significant differences in ORR were observed across the cell-cycle regulation (20.0% vs. 50.0%, p=0.226), epigenetic regulation (40.0% vs. 38.5%, p=1.000), MAPK (40.9% vs. 33.3%, p=1.000), JAK–STAT (33.3% vs. 40.9%, p=1.000), or developmental pathways (35.3% vs. 45.5%, p=0.701). Abbreviations: ORR, objective response rate; CI, confidence interval; WT, wild-type. (B) Bar plots showing DCR according to mutation status in major pathways. Patients were classified as mutated (≥1 alteration) or wild-type for each signaling pathway. Disease control rate (DCR): PI3K/AKT/mTOR alterations were significantly associated with improved DCR compared with wild-type (85.7% vs. 28.6%, p=0.009). DDR alterations demonstrated a trend toward lower DCR (69.2% vs. 100%, p=1.000). No significant differences were seen in cell-cycle regulation (60.0% vs. 77.8%, p=0.400), epigenetic regulation (73.3% vs. 69.2%, p=1.000), MAPK (72.7% vs. 66.7%, p=1.000), JAK–STAT (83.3% vs. 68.2%, p=0.640), or developmental pathways (64.7% vs. 81.8%, p=0.419). Error bars represent 95% CIs. P values were calculated using Fisher’s exact test. Abbreviations: DCR, disease control rate; CI, confidence interval; WT, wild-type
In the DDR pathway (26 patients, 92.9%), the ORR was 34.6% (9 of 26) compared with 100% (2 of 2) in the wild-type group (OR, 0.00; 95% CI, 0.00–3.34; p=0.146), and the DCR was 69.2% (18 of 26) versus 100% (2 of 2) (OR, 0.00; 95% CI, 0.00–13.66; p=1.000).
For cell-cycle regulation alterations (10 patients, 35.7%), the ORR was 20.0% (2 of 10) versus 50.0% (9 of 18) in wild-type tumors (OR, 0.26; 95% CI, 0.02–1.86; p=0.226), and the DCR was 60.0% (6 of 10) versus 77.8% (14 of 18) (OR, 0.44; 95% CI, 0.06–3.24; p=0.400).
In the MAPK pathway (22 patients, 78.6%), the ORR was 40.9% (9 of 22) compared with 33.3% (2 of 6) (OR, 1.37; 95% CI, 0.15–18.22; p=1.000), and the DCR was 72.7% (16 of 22) versus 66.7% (4 of 6) (OR, 1.32; 95% CI, 0.10–12.45; p=1.000).
For the JAK–STAT pathway (6 patients, 21.4%), the ORR was 33.3% (2 of 6) compared with 40.9% (9 of 22) (OR, 0.73; 95% CI, 0.05–6.46; p=1.000), and the DCR was 83.3% (5 of 6) versus 68.2% (15 of 22) (OR, 2.27; 95% CI, 0.19–125.8; p=0.640).
In the epigenetic regulation pathway (15 patients, 53.6%), the ORR was 40.0% (6 of 15) versus 38.5% (5 of 13) (OR, 1.06; 95% CI, 0.18–6.38; p=1.000), and the DCR was 73.3% (11 of 15) versus 69.2% (9 of 13) (OR, 1.21; 95% CI, 0.17–8.63; p=1.000).
Finally, in the developmental signaling pathway (17 patients, 60.7%), the ORR was 35.3% (6 of 17) compared with 45.5% (5 of 11) (OR, 0.66; 95% CI, 0.11–2.05; p=0.701), and the DCR was 64.7% (11 of 17) versus 81.8% (9 of 11) (OR, 0.42; 95% CI, 0.03–3.16; p=0.419).
Genomic Landscape
Across the cohort, missense variants predominated, accounting for >85% of alterations in most pathway categories (Figure 4A-C and Supplemental Figure 2). Synonymous substitutions were comparatively more frequent in the cell-cycle and epigenetic pathways, whereas nonsense variants were intermittently observed in DDR, epigenetic regulation, MAPK, and PI3K/AKT/mTOR. (A) Mutational landscape of the PI3K/AKT/mTOR pathway in patients with gastro-entero-pancreatic neuroendocrine tumors (GEP-NETs). Each column represents an individual patient, and each row represents a pathway gene. The top annotation bar indicates the type of genomic alteration (red = missense mutation, blue = insertion/deletion, green = nonsense mutation). The heatmap color intensity corresponds to the number of mutations detected in each gene. Frequent alterations were observed in MTOR, PIK3CA, and PIK3R1, with additional mutations identified in upstream receptor tyrosine kinases (e.g., FGFR2/3/4, ERBB2/3) and adaptor proteins. These data illustrate the heterogeneity of genomic events converging on the PI3K/AKT/mTOR axis, which may influence sensitivity to mTOR inhibition. (B) Mutational profile of the cell-cycle regulation in patients with gastro-entero-pancreatic neuroendocrine tumors (GEP-NETs). Each column represents an individual patient, and each row represents a pathway gene. The top annotation bar indicates the type of genomic alteration (red = missense mutation, blue = insertion/deletion). The heatmap color intensity reflects the number of mutations detected in each gene. Frequent alterations were observed in TP53 and RB1, consistent with their known role in tumor suppressor inactivation and disease progression. (C) Mutational profile of the DNA damage repair (DDR) in patients with gastro-entero-pancreatic neuroendocrine tumors (GEP-NETs). Each column represents an individual patient, and each row represents a DDR-related gene. The top annotation bar indicates the type of genomic alteration (red = missense mutation, blue = insertion/deletion, green = nonsense mutation). The heatmap color intensity reflects the number of mutations detected in each gene. Recurrent alterations were observed in ATM, BRCA1/2, CHEK2, and FANCD2, reflecting the heterogeneity of genomic defects in DNA repair machinery that may contribute to treatment response variability
Within the PI3K/AKT/mTOR pathway, alterations were identified in 12 of 21 patients with pathway involvement (57.1%). Changes involved both catalytic (C) and regulatory (R) subunits of the PI3K family. Upstream receptor tyrosine kinase (RTK) alterations (e.g., FGFR2/3/4, ERBB2/3) co-occurred in several cases, reflecting convergent activation of the PI3K/AKT/mTOR axis. Among non-RTK pathway genes, MTOR was the most frequently altered (4/12, 33.3% of pathway-altered cases), and AKT variants were detected in 2/12 (16.7%).
In the DDR pathway, recurrent alterations were noted in BRCA1 (7/26; 26.9%) and BRCA2 (8/26; 30.8%), with additional events in MLH1 (5/26; 19.2%), ATM (4/26; 15.4%), and FANCD2 (4/26; 15.4%). Multi-hit events within the same gene were observed in selected individuals—for example, one patient harbored both BRCA1 p.Trp1837Ter and BRCA1 p.Gly1232Asp, and another carried multiple BRCA2 variants including p.Trp2990Ter, p.Gly2528Glu, p.Arg245Lys, p.Ala216Val—suggesting compound impacts on homologous recombination capacity in a subset.
For the cell-cycle regulation pathway, TP53 mutations were most frequent (7/10, 70.0%), including 4 of 5 (80.0%) with grade 3 tumors. CDKN1A variants were present in 4 patients (4/10, 40.0%). Alterations in other canonical cell-cycle effectors (e.g., RB1) were less common.
In the MAPK network, alterations were dominated by RTK-associated events with overlap across signaling cascades, while downstream MAPK-core lesions (e.g., KRAS, NRAS, BRAF, NF1) were less frequent. This pattern is consistent with RTK-driven activation feeding into both MAPK and PI3K/AKT/mTOR nodes and aligns with the cross-pathway grouping framework described in the Methods.
The JAK–STAT pathway featured alterations in JAK2 (1/6; 16.7%), JAK3 (4/6; 66.7%), STAT4 (1/6; 16.7%), and STAT5 (2/6; 33.3%), often co-occurring within individuals.
Among epigenetic regulators, MEN1 was the most frequently mutated gene (5/15 pathway-altered patients, 33.3%). Other chromatin modifiers (e.g., methylation machinery and SWI/SNF components) were altered less frequently and without a dominant hotspot.
Finally, in the developmental signaling pathway (NOTCH/WNT/TGF-β), NOTCH3 variants were identified in 7 of 17 pathway-altered patients (41.2%), and APC in 5 of 17 (29.4%), with additional changes distributed sporadically across other pathway members (including SMAD4).
Taken together, pathway-level analyses revealed that missense variants predominated across pathways, with recurrent alterations in MTOR and AKT (PI3K/AKT/mTOR), BRCA1/2 and MLH1 (DDR), TP53 (cell-cycle), MEN1 (epigenetic), and NOTCH3/APC (developmental), while MAPK alterations were largely RTK-driven (Figure 4A-C, Supplemental Figure 2A-D).
Discussion
In this exploratory study of patients with GEP-NETs treated with everolimus, we evaluated the association between pathway-level genomic alterations and clinical outcomes. The overall cohort demonstrated a median PFS of 26.4 months and an OS of 41.0 months, both longer than those reported in pivotal phase III trials.3,4 This likely reflects the favorable composition of our study population, in which most patients had well-differentiated, grade 2 tumors, consistent with a more indolent clinical course.
Alterations in the PI3K/AKT/mTOR pathway were associated with a significantly higher disease control rate and a numerically greater ORR compared with wild-type tumors. Although survival differences were not statistically significant, patients with pathway alterations showed longer OS (59.0 vs. 40.8 months, p = 0.321) and PFS (26.4 vs. 18.6 months, p = 0.858). This finding is biologically plausible, as everolimus directly targets the mTOR signaling cascade, suggesting that tumors with PI3K/AKT/mTOR alterations may derive enhanced clinical potential benefit. The biological relevance of this pathway is well documented: germline syndromes such as neurofibromatosis type 1 and tuberous sclerosis, caused by NF1, TSC1, and TSC2 mutations, provide established models of mTOR hyperactivation and NET development.8,9 In our gene-level analysis, MTOR was the most frequent non-RTK alteration within this pathway, further in line with a potential link to mTOR inhibitor sensitivity.
By contrast, patients with DDR alterations had longer OS (45.1 vs. 29.2 months, p=0.269) and PFS (26.4 vs. 15.9 months, p=0.392), though neither reached significance, while ORR and DCR were markedly lower. This paradox may reflect the dual impact of DDR dysfunction: genomic instability may promote tumor aggressiveness while simultaneously creating therapeutic vulnerabilities. Frequent BRCA1/2 and MLH1 alterations were observed in our cohort, along with ATM and FANCD2 variants, underscoring the heterogeneity of DDR dysfunction in NETs. Notably, BRCA2 alterations, including multiple recurrent variants, were especially common, suggesting that BRCA2 may represent a key driver of DDR dysfunction in GEP-NETs. While the direct relevance of BRCA2 status to everolimus response remains uncertain, its predominance raises important clinical considerations. In other tumor types, BRCA2 loss has been strongly linked to defective homologous recombination and therapeutic sensitivity to poly (ADP-ribose) polymerase (PARP) inhibitors. The relatively high prevalence of BRCA2 variants in our study therefore highlights a potential avenue for treatment stratification and clinical trial development in NETs. Importantly, if tumors harboring BRCA2 alterations show limited benefit from everolimus, the identification of such variants could inform alternative management strategies, including consideration of DNA damage–targeted approaches or enrollment in biomarker-driven clinical trials. Collectively, these findings suggest that BRCA2 alterations, beyond serving as markers of genomic instability, may carry actionable implications for biomarker-driven strategies in GEP-NETs. 10 However, given the extremely small number of DDR wild-type tumors in this cohort, these observations should be interpreted with caution and considered exploratory.
Alterations in the cell-cycle regulation pathway were consistently associated with poorer outcomes in our cohort. Patients with mutated tumors experienced shorter OS (30.4 vs. 41.0 months, p=0.316) and PFS (25.0 vs. 26.4 months, p=0.684), as well as lower ORR and DCR compared with wild-type. These results were largely driven by TP53 and CDKN1A mutations, both well-recognized adverse prognostic factors across cancers. 11 Notably, all patients with grade 3 tumors in our cohort harbored alterations in the cell-cycle regulation pathway, and 80% of these carried TP53 mutations. While TP53 and RB1 co-alterations are classically observed in NEC, recent studies have demonstrated TP53 mutations in up to 35% of high-grade G3 NETs and occasional RB1 alterations in rare cases of high-grade NENs that progressed from NET.11,12 These findings suggest the need for careful clinical surveillance and raise the possibility that TP53 alterations may signal progression toward carcinoma-like biology even in morphologically well-differentiated tumors. 12
Other pathways, including MAPK, JAK–STAT, epigenetic regulation, and developmental signaling, showed no significant associations with everolimus outcomes (all p > 0.3). Nonetheless, gene-level analyses revealed recurrent alterations of biological interest. Among the developmental pathways (WNT/β-catenin, NOTCH, TGF-β/SMAD), NOTCH3 alterations were the most frequently observed event, ranking second only to BRCA gene alterations in prevalence across the cohort. Although developmental pathway alterations were not associated with clinical benefit from everolimus, the recurrent NOTCH3 and APC variants suggest a potential role in NET pathogenesis. Prior studies implicating NOTCH3 in tumor suppression in medullary thyroid carcinoma and small-cell lung cancer support the need for further investigation into its functional significance in GEP-NETs. 13 Thus, NOTCH3 may represent a biologically relevant gene in GEP-NETs and warrants further investigation in larger cohorts.
Taken together, our results suggest that PI3K/AKT/mTOR alterations may be associated with greater benefit from everolimus, whereas DDR and cell-cycle alterations may be linked to reduced response. At the gene level, recurrent events in MTOR, TP53, BRCA1/2, MEN1, NOTCH3, and APC emerged as potential contributors to GEP-NET biology. Overall, these findings illustrate a heterogeneous yet patterned genomic architecture.
Recent comprehensive reviews on precision medicine in gastroenteropancreatic neuroendocrine neoplasms (GEP-NENs), including the work by Fazio et al, 14 have highlighted the limited success of single-gene biomarkers in predicting treatment response and emphasized the need for integrative, pathway-level approaches that better reflect tumor biology. In line with this unmet need, the present study extends existing literature by applying a pathway-level genomic framework to a real-world cohort of patients with GEP-NETs treated with everolimus. Rather than interrogating isolated genomic events, we grouped alterations across biologically coherent signaling pathways and directly correlated these profiles with clinical outcomes. While prior biomarker analyses from the RADIANT trials did not identify a reproducible single-gene or genomic signature predictive of everolimus benefit, 15 our pathway-level approach offers a complementary strategy that may better capture tumor heterogeneity and signaling cross-talk, which are increasingly recognized as key barriers to effective biomarker development in GEP-NETs. By demonstrating distinct response patterns associated with PI3K/AKT/mTOR, DDR, and cell-cycle regulation pathways, our findings provide empirical support for pathway-level stratification as a pragmatic step toward biomarker-driven therapy.
This study has several limitations, including its retrospective design, small cohort size, and lack of an independent validation dataset. These factors may have limited the statistical power to detect modest associations. To address this, a prospective validation using our institutional registry cohort is planned to confirm the reproducibility of the observed pathway-level trends.
Prospective studies in larger, molecularly annotated cohorts are warranted to validate these pathway-level findings and further refine biomarker-driven strategies for optimizing everolimus therapy in GEP-NETs. Such efforts will be essential to determine whether pathway-level genomic stratification can be translated into clinically actionable precision medicine approaches in this heterogeneous disease.
Conclusion
These findings suggest that pathway-level genomic stratification may yield clinically meaningful insights in GEP-NETs. Clinical outcomes with everolimus appeared more favorable in tumors harboring PI3K/AKT/mTOR alterations, whereas alterations in DDR and cell-cycle regulation were associated with reduced benefit. At the gene level, recurrent events underscore a heterogeneous yet patterned genomic architecture underlying these tumors. Validation in larger, prospective cohorts is warranted to confirm these associations and may help refine biomarker-driven treatment strategies for patients with GEP-NETs.
Supplemental Material
Supplemental Material - Integrative Molecular Analysis to Predict Clinical Benefit of Everolimus in Patients With Gastro-Entero-Pancreatic Neuroendocrine Tumors (GEP-NETs)
Supplemental Material for Integrative Molecular Analysis to Predict Clinical Benefit of Everolimus in Patients With Gastro-Entero-Pancreatic Neuroendocrine Tumors (GEP-NETs) by Miran Han, Eunbyeol Lee, Ji Eun Shin, Min Suk Kwon, Sung Hee Lim, Jung Yong Hong, Seung Tae Kim in Cancer Control
Footnotes
Acknowledgements
The authors thank the clinical and research staff at Samsung Medical Center for their support and assistance. Generative artificial intelligence tools were used solely for language editing and clarity improvement; no scientific content or data were generated or modified.
Ethical Considerations
This study was reviewed and deemed exempt from ethics approval by the Institutional Review Board of Samsung Medical Center (File No. 2025-09-173-001).
Consent to Participate
The requirement for informed consent was waived by the Institutional Review Board due to the retrospective nature of the study and the use of de-identified data.
Author Contributions
Conceptualization: Miran Han.
Methodology: Miran Han.
Formal analysis: Miran Han.
Investigation: Miran Han, Eunbyeol Lee, Ji Eun Shin, Min Suk Kwon, Jung Yong Hong.
Resources: Eunbyeol Lee, Ji Eun Shin, Min Suk Kwon, Jung Yong Hong.
Data curation: Miran Han, Eunbyeol Lee.
Software: Miran Han.
Visualization: Eunbyeol Lee.
Writing—original draft: Miran Han.
Writing—review and editing: Seung Tae Kim, Sung Hee Lim.
Supervision: Seung Tae Kim.
Project administration: Sung Hee Lim.
All authors have read and agreed to the published version of the manuscript.
Funding
The authors received no financial support for the research, authorship, and/or publication of this article.
Declaration of Conflicting Interests
The authors declared no potential conflicts of interest with respect to the research, authorship, and/or publication of this article.
Data Availability Statement
The datasets generated and analyzed during the current study are available from the corresponding author upon reasonable request.
Supplemental Material
Supplemental material for this article is available online.
Appendix
References
Supplementary Material
Please find the following supplemental material available below.
For Open Access articles published under a Creative Commons License, all supplemental material carries the same license as the article it is associated with.
For non-Open Access articles published, all supplemental material carries a non-exclusive license, and permission requests for re-use of supplemental material or any part of supplemental material shall be sent directly to the copyright owner as specified in the copyright notice associated with the article.