
Abstract
Introduction
There is large inter- and intra-country variability in ovarian cancer outcomes. Individuals diagnosed with advanced stage cancer in Nova Scotia have a 3-year net survival of 31.9%, the lowest in the country. This study aimed to identify factors impacting survival, and to investigate evidence of inequities in survival from the point of diagnosis moving forward.
Methods
This population-based retrospective study included all women diagnosed with ovarian cancer in Nova Scotia from Jan 1, 2007, to Dec 31, 2016. Administrative health data were linked to gather individual, tumor, and health system characteristics. Both prognostic and equity factors potentially contributing to variations and inequities in survival were assessed using descriptive and time to event techniques.
Results
This study found no regional differences in survival across Nova Scotia. It revealed that disparities in equity factors do not appear to be significantly associated with survival at the time of diagnosis moving forward. Instead, survival variations were attributed to legitimate prognostic factors, such as cancer stage, subtype, comorbidities, and frailty. However, notable inequities were identified between socioeconomic status and prognostic factors that may contribute to poor survival upstream, rather than at the time of diagnosis.
Conclusion
Though inequities do not appear to directly contribute to differences in ovarian cancer survival at the time of diagnosis, they may influence outcomes by increasing the development of prognostic factors that lead to poorer survival. Future research should capture equity factors not found in administrative data and begin making comparisons between other jurisdictions to determine why survival rates vary worldwide.
Plain Language Summary
Survival rates for ovarian cancer have been found to vary between and within countries, as identified by past research efforts. However, it is unclear what causes these differences in survival or whether issues of fairness (ie, inequities) and access to care might play a role. As such, this study explored why ovarian cancer survival is lower in Nova Scotia, which is the province with the lowest 3-year survival rate for advanced ovarian cancer in Canada. We found that inequities may indeed impact survival, but in relation to the development of factors that affect people’s health and circumstances before they are diagnosed (ie, having other health issues). These findings highlight the need to address broader social and economic inequities that can lead to worse cancer outcomes. They also show that future research should go beyond routinely collected health data to understand what is driving survival differences.
Introduction
Ovarian cancer is the sixth most common type of cancer among women worldwide, and the deadliest type of gynaecological cancer. 1 Though advancements in early detection and treatment continue to improve outcomes for other cancer types, ovarian cancer survival has seen little improvement over time and only half of those diagnosed will survive past 5-years. 2 With that said, ovarian cancer survival rates have been found to differ depending on geographical location. Initiatives like the International Cancer Benchmarking Partnership (ICBP) have demonstrated that survival rates vary both between and within countries. 3 In the second phase of their comparative research, the ICBP found that Canada ranks fourth out of seven high-income countries for ovarian cancer survival. 4 Within Canada, 3-year survival for those with advanced stage disease is highest in Alberta at 38.6%, and lowest in Nova Scotia at 31.9%. 5 To date, no evidence exists to suggest reasons for these variations, or why Nova Scotia has lower survival in comparison to other Canadian provinces. The ICBP has determined that the frequency of major prognostic factors, such as stage at diagnosis, remain relatively constant throughout Canada and worldwide. This differs for other cancer types, as variations in survival are often attributed to factors such as access to screening programs. 6
Identifying the key factors that influence ovarian cancer survival is crucial to understanding both Nova Scotia’s lower survival rates and informing what may be leading to variations in other jurisdictions. Several prognostic factors can influence the development, diagnosis, and management of ovarian cancer, such as genetics, help-seeking behaviour, or access to primary care.7-10 However, there is limited evidence to suggest whether and how factors at the time of diagnosis impact survival moving forward. When individuals present to the healthcare system, they present with prognostic factors that are known to influence survival, such as their cancer stage, sub-type, or health status. 11 However, there are additional equity factors that may also influence outcomes. Equity factors are those that should not have an impact on survival or access to care, though they often do, and whose influence should be amenable to policy. 11 For example, this would include a person’s poverty status, mental illness, or geographical location. Though rarely studied specifically for ovarian cancer, previous research has shown that these factors can have major impacts on survival in other cancer types. For instance, across most cancer types, excess deaths are consistently highest in the most deprived groups.12-15 This is an important gap in ovarian cancer research, as inequities influencing survival and access to healthcare are an important policy target.
To further understand disparities in survival worldwide and improve outcomes, we must discern why these variations occur and if equity concerns are present. Therefore, the objective of this study was to identify which prognostic factors and equity factors are associated with ovarian cancer survival in Nova Scotia, Canada. Not only does this allow us to develop targets for policy change locally, but it helps point to what may be occurring within other jurisdictions.
Materials and Methods
Study Design
This study utilized a population-based retrospective design. The methods followed a similar approach to those defined by Asada at al, which focus on understanding how differences in outcomes occur as a result of equity concerns by isolating their associations with outcomes. 11 Asada et al define prognostic factors as “legitimate factors”, as their impact on survival is not amenable to policy. Equity factors, then, are defined as “illegitimate factors”, as their impact on survival should be amenable to policy. The decision to categorize factors as a “prognostic” or “equity” factor was based on perspective, purpose, and scope. In particular the purpose and scope of this study focused on differences in survival from the point of diagnosis moving forward. Factors such as age at diagnosis, histological sub-type, cancer stage, frailty status, and comorbidities are considered prognostic factors as their impact on survival is not amenable to policy at the time of diagnosis moving forward. Factors such as poverty status, continuity of care, mental health status, and health authority zone of residence at diagnosis are considered equity factors, as the impact that they have on survival should be modifiable or amenable to policy. For the purpose of this analysis, equity and prognostic factors are treated as distinct categories. However, existing literature suggests that these categories may be related as equity factors (ie, poverty) may contribute to the development of prognostic factors (ie, comorbidities) at the time of diagnosis.16,17 That said, this categorization is used to describe whether survival differences are directly associated with clinical characteristics present at diagnosis or equity-related factors, which allows us to better understand how to address these disparities from a policy perspective. For example, if survival differences were mostly explained by frailty (prognostic factor), interventions may include preventative or rehabilitative services targeted towards frail individuals with cancer. Alternatively, if survival differences are explained by equity factors (poverty), policies addressing upstream factors such as income supports and access to care may be more effective. Using Asada’s methods, equity factors are added to regression models that have been fully adjusted for all of the prognostic factors. 11 The purpose of this is to control for the impact of the factors known to influence survival, so that any remaining associations between the equity factors and survival are therefore unexplained and likely are a result of inequities. These methods are descriptive in nature and are intended to identify patterns of association rather than causality. The reporting of this manuscript follows the STROBE guidelines. 18 This study was approved by the Research Ethics Board of Nova Scotia Health on April 11th, 2022 (protocol number 1027899). Informed consent was waived by the Research Ethics Board of Nova Scotia Health as it was determined that obtaining consent would be impossible or impracticable for this study.
Study Population
All women identified from the Nova Scotia Cancer Registry (NSCR) as being newly diagnosed with epithelial ovarian cancer between 2007 and 2016 were included in this study. The NSCR is a population-based provincial cancer registry that includes cancer diagnoses for all individuals in Nova Scotia, Canada; reporting of all new cancer cases is required by legislation. Those without a valid health card, who received primary treatment outside of Nova Scotia, or who were diagnosed via death certificate only were excluded.
Data and Measures
This study utilized multiple linked datasets. Data from the NSCR were linked to a clinical database (held by the Division of Gynecological Oncology at Dalhousie University) and multiple administrative health datasets: hospital discharge abstracts (CIHI DAD), physicians’ claims (MSI Physician Billings), and the provincial health insurance eligibility group (EGROUP) database, which captures individual eligibility and enrollment for publicly funded programs in Nova Scotia. Data were gathered starting 3-years prior to diagnosis and ending up to 3 years post diagnosis, with the exception of EGROUP as this was collected up to 5 years prior to diagnosis.
Survival Time
The main outcome for this study was the overall survival time following an epithelial ovarian cancer diagnosis. The start/study entry point was the date of the diagnosis, and the event of interest/study exit point was the date of overall mortality. Both of these dates were collected from the NSCR. Those who did not pass away from ovarian cancer during the 3-year follow up period were censored at the end of the study.
Prognostic Factors
Cancer stage was collected from the NSCR as defined by the Collaborative Stage Data Collection System. 19 Stage was categorized as I, II, III, IV or unknown. Unknown stage occurred when individuals received limited stage workup and/or limited documentation in their health record.
Ovarian cancer sub-type was collected based on histology codes in the NSCR. Sub-types were categorized as one of the four most common sub-types (serous, endometroid, mucinous, or clear cell), unknown, or “other” if an additional rare subtype. Serous subtype was not subdivided into high grade vs low grade serous due to data limitations, however, based on known prevalence of these subtypes, we expect low grade serous carcinomas to make up less than 10% of all serous cases. 20
Frailty status was collected based on decision rules developed by Urquhart et al. 21 These rules include being a long-term care resident, having received palliative care, or having been identified using items from the Edmonton Frailty Scale, the Clinical Frailty Scale, and/or service utilization based on the following criteria: cognitive impairment, incontinence, falls, nutrition, general health status, functional performance, or targeted health service utilization. 21 Patients who fulfilled one or more of these rules were considered frail. The variable was coded as binary (frailty/no frailty). Those with missing frailty status were coded as having no frailty, as this means they did not meet the criteria to be considered frail. Though this measure has not been fully validated, it has been used across multiple organizations.22-24
A comorbidity count was calculated for each individual using Elixhauser et al’s list of 31 comorbidities, excluding cancer conditions. 25 Co-morbidities were computed from the CIHI DAD, which meant that only comorbidities resulting in or managed during a hospitalization were included. Individuals with “missing” comorbidities were labelled as “no hospitalization”. All other counts were categorized based on the distribution of the data: 0, 1, or 2+.
Age at diagnosis was collected from the NSCR and transformed into a categorical variable of <60 or 60+, based on the distribution of the data and sample size within each group.
Equity Factors
Mental health status was collected using the Canadian Chronic Disease Surveillance System definition of mental illness. 26 This measure captures the use of healthcare services for mental illness per fiscal year (ie, annual prevalence), including both physician visits and hospitalizations using MSI Physician Billings and the CIHI DAD. This variable was coded as binary (mental health comorbidity/no mental health comorbidity). Patients who visited a physician or who had been hospitalized for a mental health condition up to 3 years prior to their ovarian cancer diagnosis were coded as having a mental health comorbidity.
Poverty status was identified through the EGROUP database and defined as having been enrolled in any low-income drug program (ie, seniors pharmacare for those on guaranteed income supplements, community services pharmacare, or family pharmacare) within 5 years prior to their diagnosis date. Poverty was coded as a binary variable (poverty/no poverty).
Health authority zone of residence at diagnosis was derived from postal codes. Postal codes from the date of diagnosis were collected from the NSCR and grouped into one of the four health zones (NSHA Management Zones): Central, Western, Northern, and Eastern.
Finally, continuity of care was calculated using the Usual Provider Continuity (UPC) Index, 27 which is the ratio of the number of times a patient visits their main primary care provider compared to the total number of times they have visited any primary care provider, within 6-30 months prior to diagnosis and excluding hospital and emergency department visits (using MSI physician billing). A continuity of care score equal to or greater than 0.75 was categorized as high continuity of care whereas a score of less than 0.75 was deemed low continuity of care. Those with less than 3 visits were included as a category labelled “missing” as a score could not be calculated.
Analysis
All statistical analyses were completed using STATA/MP 15.1. Descriptive statistics were used to summarize overall patient characteristics, and within each health zone to determine if variations in prognostic factors existed. Simple survival estimate techniques (ie, Kaplan Meier curves and log rank tests) were used to visualize and assess statistical significance of associations between patient characteristics and overall survival.
Multivariable proportional hazard regression models were used to assess differences in overall survival by health zone, poverty, continuity of care, and mental illness. Cox models were chosen to identify associations between equity factors and survival, and to identify any regional variations in survival, by computing hazard ratios (HR), standard errors (SE) and 95% confidence intervals (CI) with the statistical significance set to alpha level = 0.05. Reference categories were chosen based on the distribution of the data (ie, sample size within each group). Multi-collinearity between predictor variables was assessed before running multivariate models and no significant multi-collinearity was detected.
Aligned with Asada et al’s approach, we first ran a series of univariate regression models with both the prognostic factors and equity factors with survival as the outcome. This was done to provide context for the study and provide a point of comparison for future studies. As mental illness and continuity of care were found to have insignificant associations with survival in both the descriptive statistics and univariate regression models (P-value > .2), these variables were not included in any multivariate models. Multivariate models were then developed with zone and poverty both singly and in combination with one another, adjusted for the prognostic factors. Based on the results of these models, some supplemental descriptive statistics were generated to explore any potential explanations between the associations or lack thereof.
Results
Frequency and Prevalence of Prognostic Factors and Equity Factors
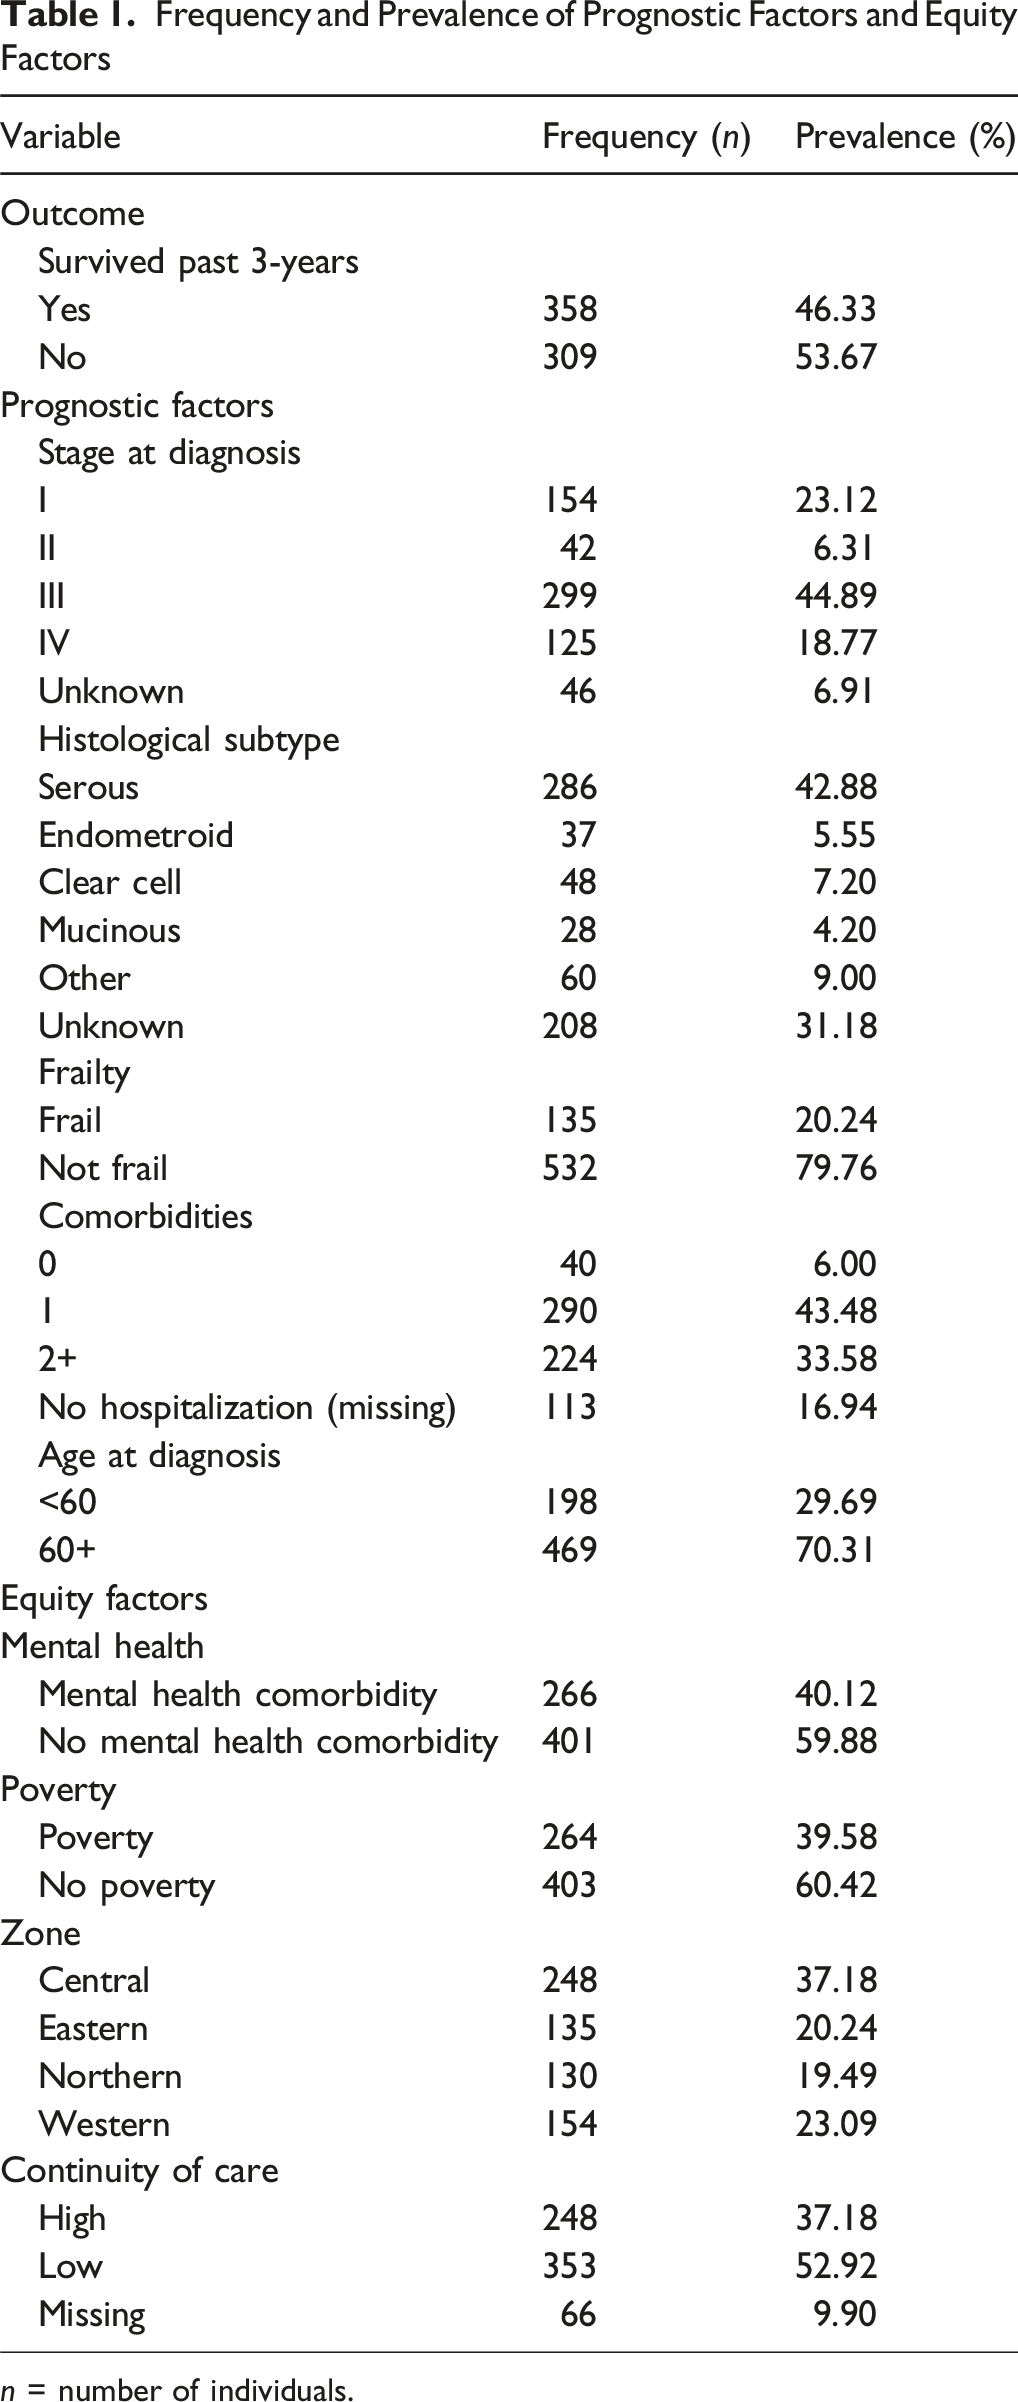
n = number of individuals.
For a factor to contribute to regional variations in survival, it must also vary between regions itself. As such, we conducted a series of X 2 tests between zones and each of the prognostic factors and equity factors. These results are shown in Appendix A. In summary, we found that comorbidity count, age, continuity of care, and poverty status differed between health zones. The eastern zone had the highest level of comorbidities, the highest number of those diagnosed above the age of 60, and the highest level of poverty. The central zone had the highest frequency of those with low continuity of care.
To determine which of these factors were associated with survival differences, we estimated Kaplan-Meier survival curves and used log-rank tests to assess the statistical significance of survival difference between groups. The Kaplan-Meier curves illustrating the significant associations can be found in Figure 1. Overall, it was found that sub-type, stage, comorbidity count, age at diagnosis, frailty status, and poverty status resulted in survival differences. Kaplan-Meier Survival Curves Stratified by Subtype, Stage, Age at Diagnosis, Comorbidity Count, Frailty Status, and Poverty. Survival Probability (y-axis) is Shown Over Time in Days (x-axis), With P-values From Log-Rank Tests
Univariate Cox Regression Models
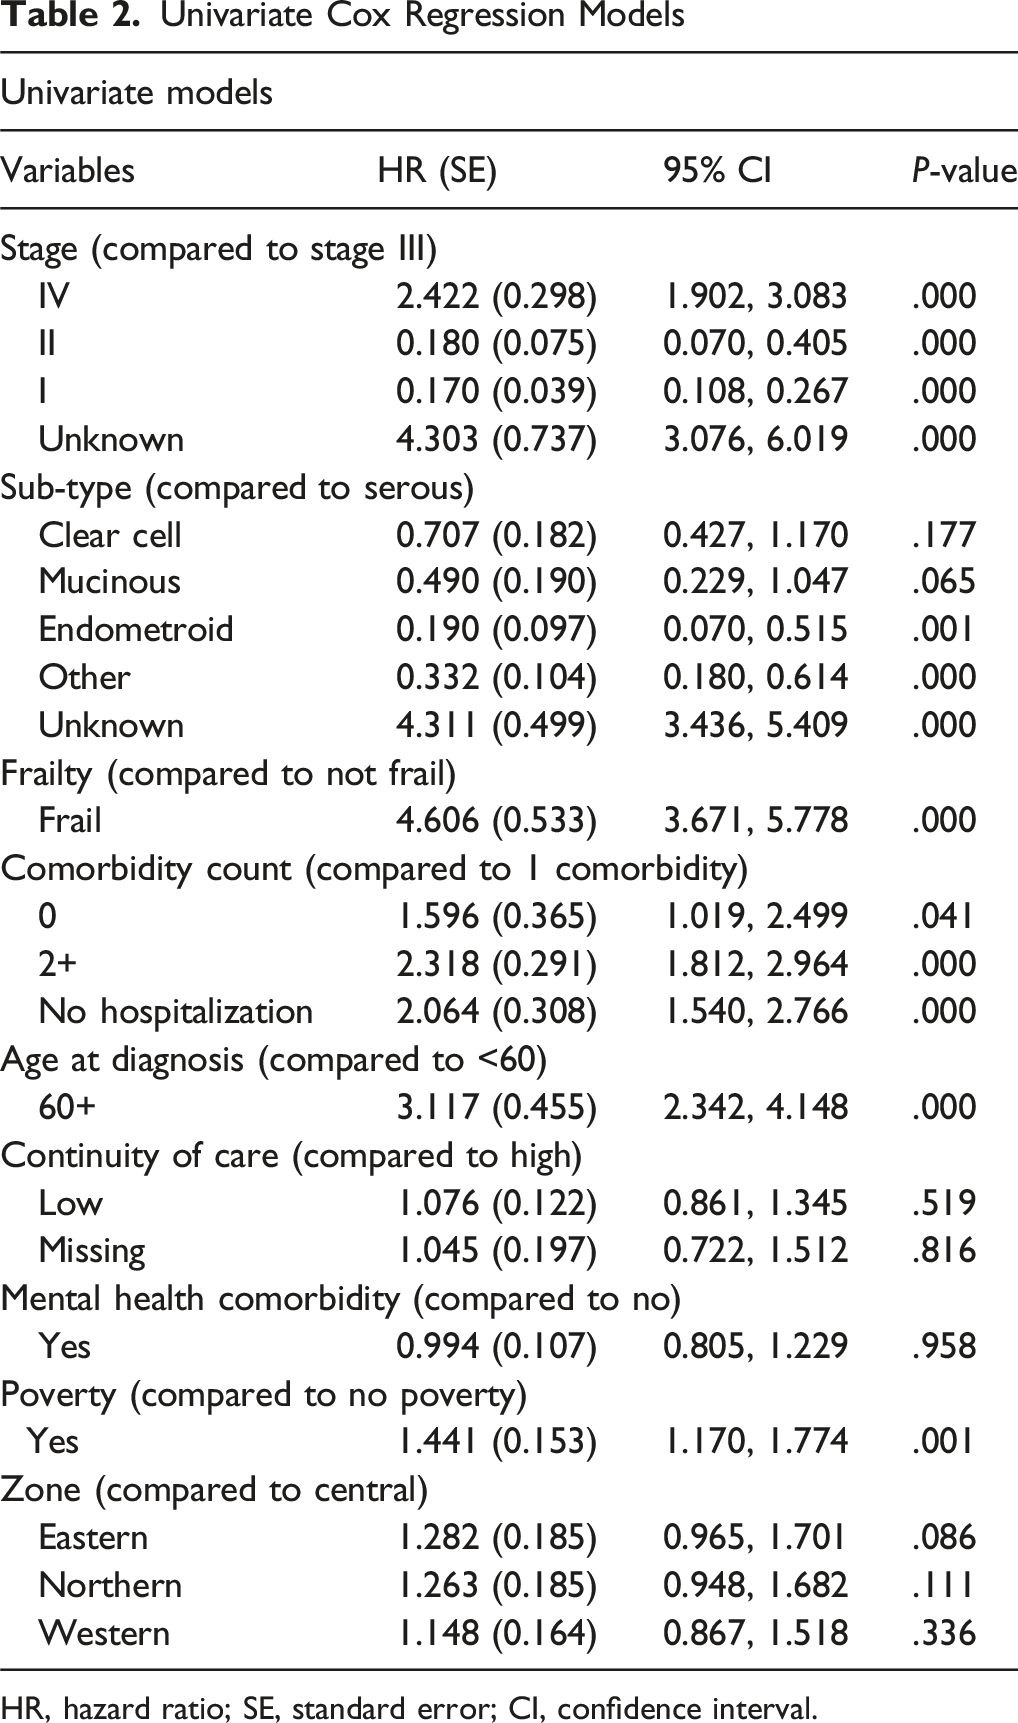
HR, hazard ratio; SE, standard error; CI, confidence interval.
Multivariate Cox Regression Models With Equity Factors Adjusted for Prognostic Factors
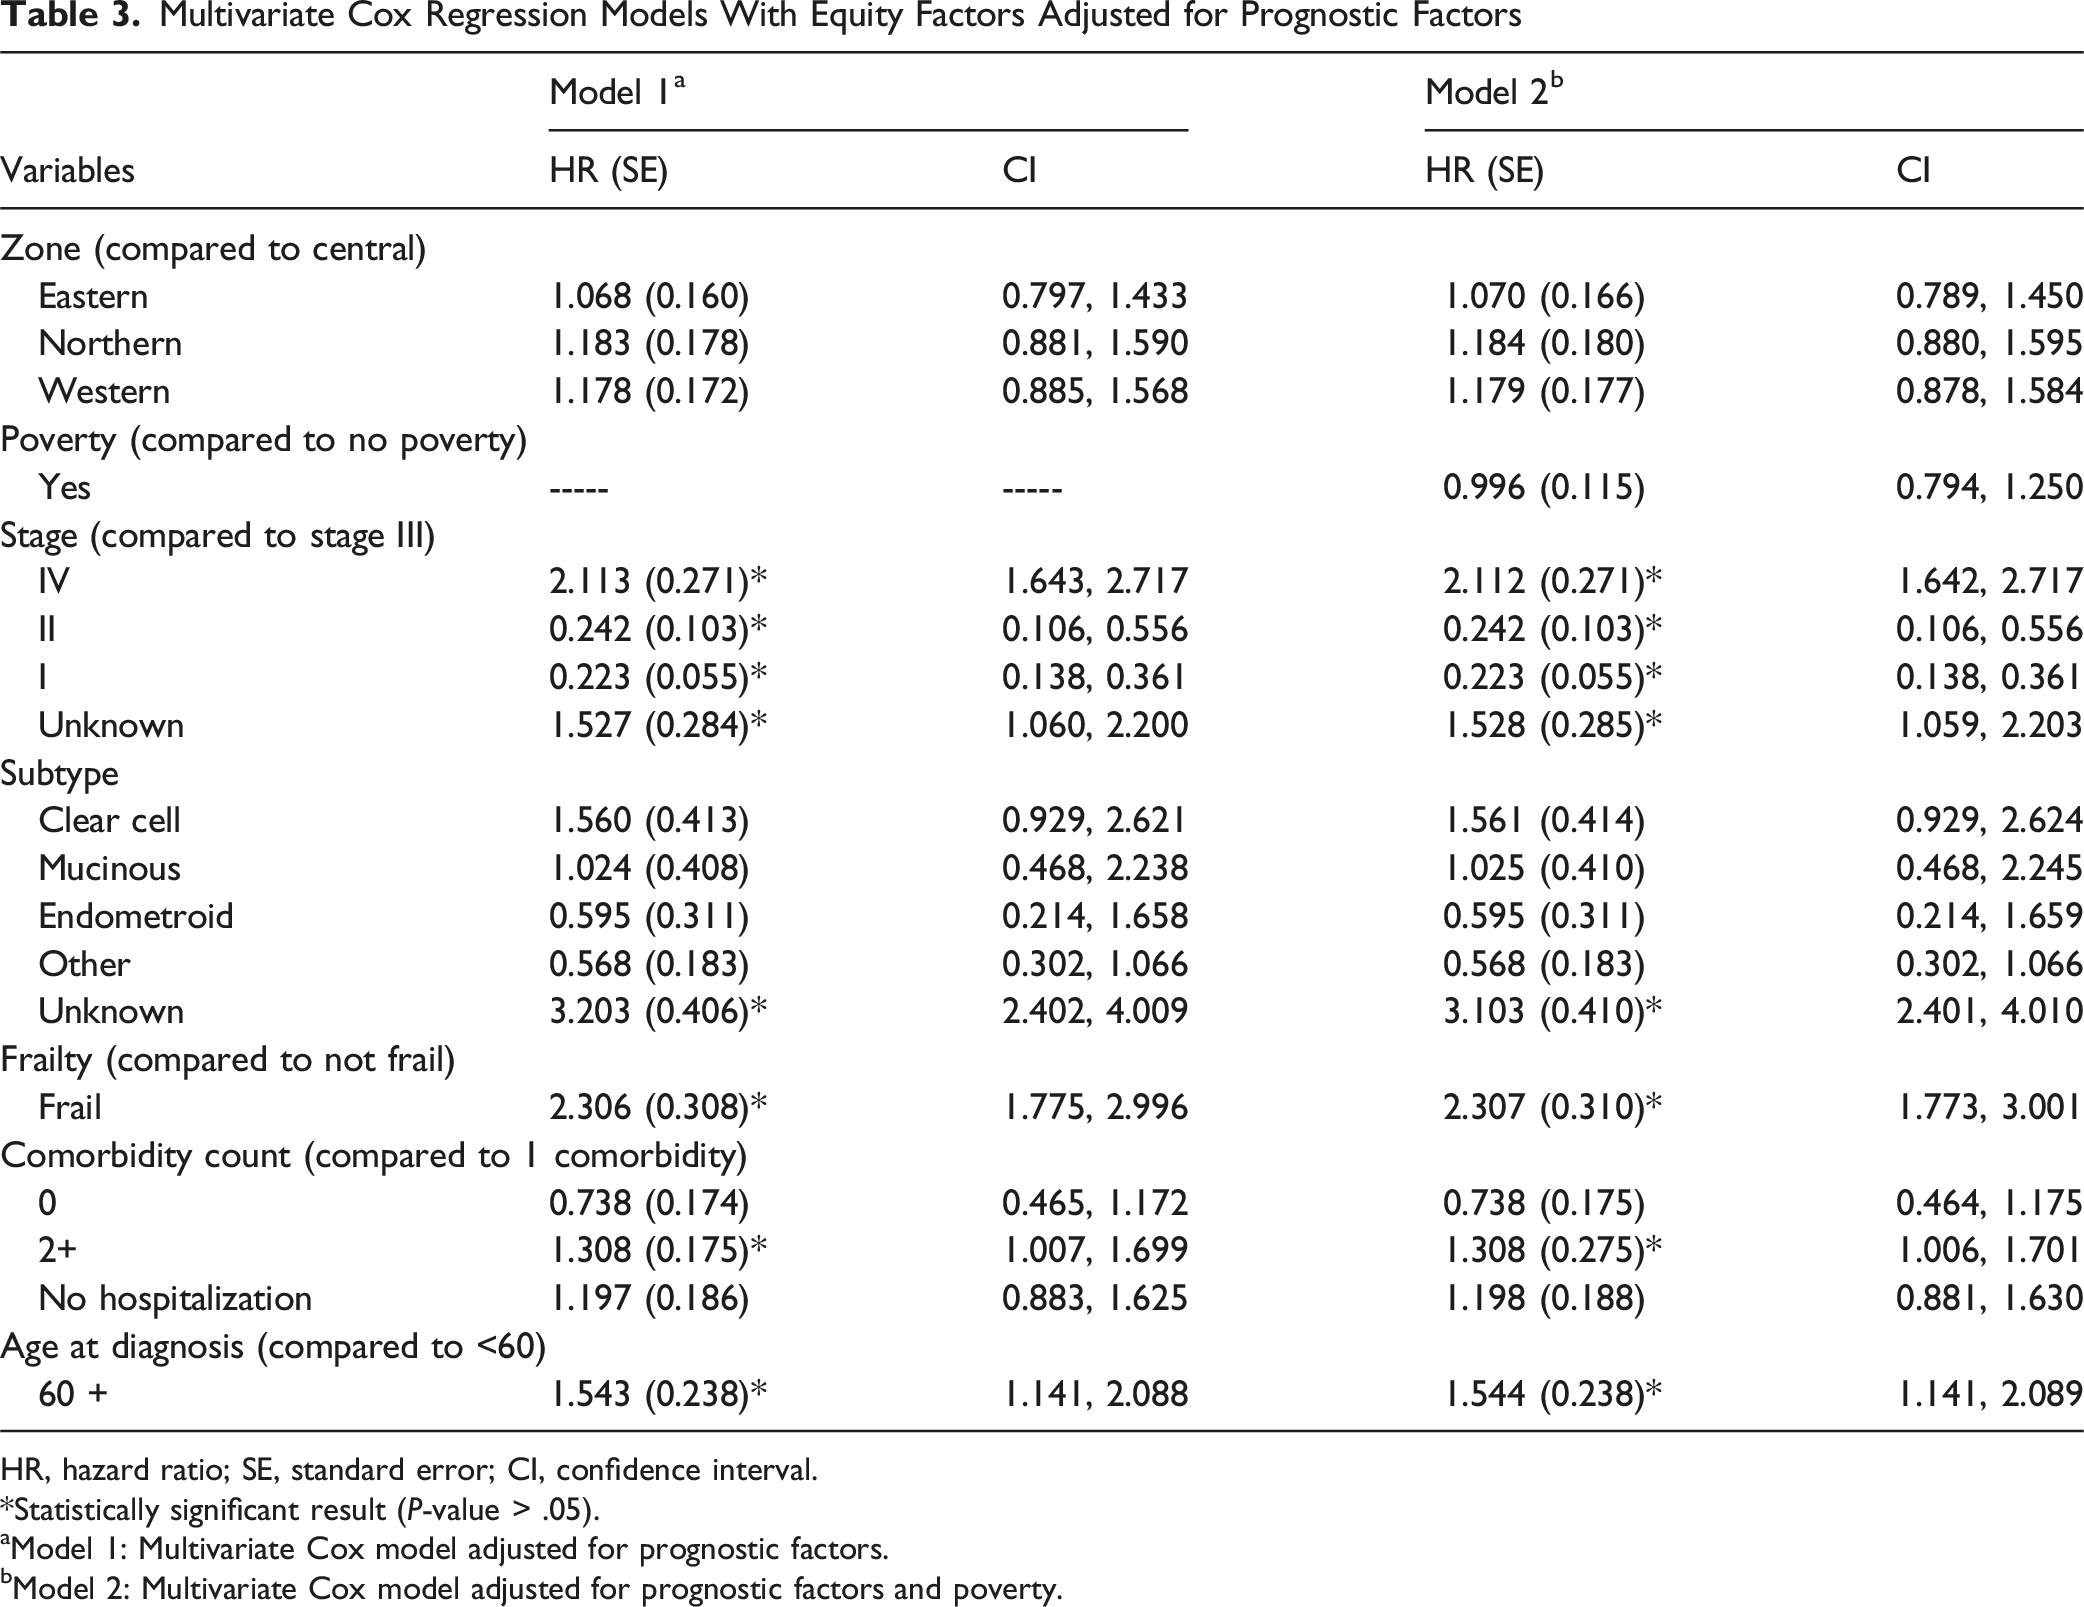
HR, hazard ratio; SE, standard error; CI, confidence interval.
Statistically significant result (P-value > .05).
aModel 1: Multivariate Cox model adjusted for prognostic factors.
bModel 2: Multivariate Cox model adjusted for prognostic factors and poverty.
Frequency and Prevalence of Prognostic Factors Based on Poverty Status

n = number of individuals.
Discussion
Our findings suggest no direct contribution of equity factors to 3-year survival in ovarian cancer patients at the time of diagnosis. Within Nova Scotia, initial log-rank tests showed slight geographical variations in survival across the province, but regression analyses revealed no significant associations between geographical location and survival time, before or after adjustment for prognostic factors. We found that individual survival differences were fully explained by prognostic factors at the point of diagnosis moving forward. Notably, equity measures of mental illness and pre-diagnostic continuity of care had no discernible impact on survival.
Poverty showed a univariate association with survival that disappeared once adjusted for prognostic factors. Instead of making the conclusion that survival is not associated with poverty, a supplemental analysis was done to explore whether such associations potentially exist upstream, rather than at the time of diagnosis. This was important to illustrate, as a substantial relationship between socioeconomic status and cancer survival has been clearly demonstrated throughout existing literature, though there is a lack of ovarian-cancer specific research on this topic.29-31 Indeed, as shown in Table 4, the analysis showed how poverty may be associated with an increased prevalence of the prognostic factors that lead to poorer survival at the time of diagnosis. Specifically, our analyses demonstrated those experiencing poverty were more often diagnosed at an unknown stage, and less often diagnosed at stage I compared to those who were not experiencing poverty. The proportion of those diagnosed at stage III or IV were similar between the two groups, but this is likely due to the fact that almost all ovarian cancer patients are diagnosed at a late stage due to a lack of symptoms during earlier stages and a lack of effective screening methods. As such, socioeconomic disparities in stage distribution (and therefore survival) may be less pronounced compared to other cancer types.29-31 This supplemental analysis also showed that poverty is associated with higher levels of frailty and multiple comorbidities. Previous research has shown that poverty may indeed lead to the development of these prognostic factors.16,28 For instance, a comprehensive review by Pathirana and Jackson, 17 including studies worldwide, found that increased deprivation is consistently associated with an increased risk of developing comorbidities. Similarly, the Women’s Health and Aging Studies in the United States found that those with low socioeconomic status had double the risk of developing frailty compared to those with high socioeconomic status. 32 This points to the need for future interventions targeting underserved areas to improve earlier diagnosis and address comorbidities before they worsen chances at survival, such as improved supportive care in low-income communities. In addition, community-based interventions that address frailty in individuals, such as physical activity interventions, nutrition support, or prehabilitation, could potentially impact outcomes. 33 As these factors directly impact survival, it is important to understand how poverty may indirectly contribute to an elevated risk of death. These findings likely partly explain Nova Scotia having the poorest survival in the country for those with advanced cancer, as Nova Scotia also has the highest poverty rate in the country at 13.1% in 2022 (excluding the territories). 34 While this analysis distinguishes prognostic and equity-related factors, it is difficult to separate the various factors in any explanatory way, particularly as poverty is associated with many of the prognostic factors. Though this study is descriptive and does not examine causality, future research should explore how prognostic factors may be influenced by equity factors prior to diagnosis.
It is challenging to compare our findings on regional variations in ovarian cancer survival to existing literature due to the scarcity of relevant studies, as most research on geographical differences in survival has focused on other cancer types. For colorectal, prostate, and breast cancers, regional survival variations are more consistent and often explained by differences in stage distribution. 35 With that said, it is difficult to make comparisons to variations in survival in other areas due to the unique nature of Nova Scotia’s healthcare system. For example, a study done by Dehaeck et al in British Columbia contradicts our findings as they identified regional variations in survival. 36 However, although British Columbia has a similar number of health regions to Nova Scotia (five vs four), there are more than eight tertiary care centers throughout their province whereas Nova Scotia only has one. This may point to the fact that regional variations in survival do not exist because those who choose to receive treatment for their cancer are mostly treated at the same location, and therefore more likely to receive coordinated and timely care. Another potential explanation for the lack of regional variation is that we did not see regional variations in the distribution of the most direct predictors of prognosis, such as stage or frailty.
Our study found no links between an elevated risk of death and poor mental health, even before controlling for the prognostic factors. While the association between poor mental health and increased cancer mortality is well-documented, many studies do not explore the impact of pre-existing mental health issues on survival post-diagnosis.37-39 Instead, they often measure mental health after diagnosis, a period when individuals may develop anxiety or depression as a result of their cancer.39,40 We also need to consider how the measure of mental illness may have contributed to our findings. First, we used a broad measure of mental illness that captured common mental conditions such as anxiety, which may have less of an impact on survival compared to more severe mental health diagnoses. Indeed, a study by Chang et al found that cancer mortality is significantly worse for those with more severe mental disorders. 41 Similarly, a review by Davis et al found that pre-diagnosis mental health associations with survival, across various cancer types, are most pronounced for those with schizophrenia. 42 Second, our measure of mental health status would not have captured all individuals who experienced mental illness, such as those who did not receive healthcare services for their mental illness or those whose care was not captured in administrative health databases. 26
Finally, we found no survival differences based on pre-diagnosis continuity of care, a topic rarely studied for ovarian cancer. While higher continuity of care is generally associated with reduced hospitalizations and improved coordination between specialists, our findings suggest it may not be a significant factor for ovarian cancer, or rather specifically within the context of Nova Scotia.10,43,44 Future research should investigate whether pre-diagnosis continuity of care impacts survival rates for other cancer types, or if this association exists within other healthcare systems.
Strengths and Limitations
This study was strengthened by its population-based design, capturing every woman diagnosed with ovarian cancer within the time frame, and the use of comprehensive administrative datasets, enhancing its generalizability. Collaborations with gyne-oncologists in Nova Scotia and a patient advocacy organization (Ovarian Cancer Canada) also strengthened the study, ensuring relevant measures and enabling patient-level changes. However, there are important limitations to consider. Administrative data are not captured for research purposes and lack variables that may influence survival (eg, race/ethnicity, patient choice). The data do not provide the granularity needed for an ideal analysis, such as differentiating between high and low-grade serous histologies or capturing less severe comorbidities. In addition, measures of equity are often imprecise in administrative datasets. As stated above, the mental health status measure excludes individuals who did not seek care for their mental illness or those who have not received a mental illness diagnosis. Conversely, it may also exclude individuals who did seek care for mental illness, but whose healthcare services were not captured by administrative data. This limitation may reflect inequitable access to mental healthcare, particularly among populations experiencing poverty who may face barriers to seeking mental health services in the first place. For example, as described by the Public Health Agency of Canada, this may include services provided in a private setting, services in hospitals that do not submit discharge abstract data, or individuals who are not covered by CCDSS (ie, refugee protection claimants) [24]. Similarly, our measure of poverty only captured those who were flagged within provincial drug coverage programs as being low income, which may have led to an over or under prediction of true poverty levels within the cohort. Moreover, by capturing poverty within 5 years of diagnosis rather than 3 years, we may have captured individuals who were once impoverished but later in a better financial position. Nonetheless, socioeconomic status has been shown to have lasting effects on health regardless of any changes. Individuals often fluctuate in and out of poverty, meaning that if we had chosen a shorter time frame, we may exclude those who only recently were considered not impoverished or those who would re-enter poverty shortly after diagnosis. Despite these limitations, this individual-level measure still provides a better indicator of poverty than area-level measures such as the deprivation index, as neighborhood is often only weakly associated with individual income. Finally, some data may be missing, such as individuals who had surgery outside the province.
Conclusion
Overall, this study identified factors associated with variations in ovarian cancer survival and areas for intervention to improve outcomes. Specifically, we found that while prognostic factors explained differences in survival, equity factors such as poverty may contribute indirectly by influencing those prognostic factors prior to diagnosis. Future research should focus on capturing potentially important factors not captured in administrative data, such as patient and physician decision-making. This would provide a deeper understanding of how social and systemic inequities shape cancer outcomes and help identify points of intervention prior to diagnosis. This will also reveal key insights into survival rate variations between Canadian provinces, and indeed other jurisdictions, and inform targeted interventions and policy changes to improve outcomes for ovarian cancer patients in Canada and beyond.
Footnotes
Ethics Approval
This study was approved by the Research Ethics Board of Nova Scotia Health on April 11th, 2022 (protocol number 1027899).
Consent to Participate
Informed consent was waived by the Research Ethics Board of Nova Scotia Health as it was determined that obtaining consent would be impossible or impracticable for this study.
Author Contributors
All authors took part in study conceptualization. RU acquired funding for the study. SS, RU, and GK designed the methods. SS cleaned the data and completed the statistical analysis. RU and GK provided analysis support. LS provided clinical interpretation. SS drafted the original manuscript. All authors reviewed and edited the paper. All authors have agreed to the published version of the manuscript.
Funding
The authors disclosed receipt of the following financial support for the research, authorship, and/or publication of this article: Funding was provided by the Province of Nova Scotia to Ovarian Cancer Canada in support of the OvCAN research initiative.
Declaration of Conflicting Interests
The authors declared no potential conflicts of interest with respect to the research, authorship, and/or publication of this article.