
Abstract
Introduction
DNA methylation has emerged as a promising tool for the early detection of ovarian cancer. Consequently, accurate and cost-effective methods for detecting DNA methylation are essential. Although the Infinium Methylation Array provides broad coverage, its high cost limits clinical utility. Bisulfite Sequencing (BS) represents a potential alternative for biomarker validation and diagnostic assay development, provided it can reliably reproduce array-based methylation profiles. This study aims to assess the concordance between BS and Infinium Methylation Array data in ovarian cancer tissues and cervical swabs.
Methods
DNA from 55 ovarian cancer tissues and 25 cervical swabs underwent bisulfite conversion and was analyzed using the Infinium Methylation Array and a custom BS panel. We compared the results, focusing on overall methylation levels, Spearman correlation between beta values, and Bland-Altman analysis. We also assessed whether sample clustering patterns by diagnosis were consistent across methods.
Results
Methylation profiles generated by bisulfite sequencing were consistent with those obtained using the Infinium Methylation Array. We observed strong sample-wise correlation between platforms, particularly in ovarian tissue samples. Agreement was slightly lower in cervical swabs, likely due to reduced DNA quality. Diagnostic clustering patterns were broadly preserved across both methods.
Conclusion
Our results show that BS can reliably replicate results from the Infinium Methylation Array and presents a cost-effective option for analyzing larger sample sets. Moreover, our work may serve as a best-practice guide, as it highlights key challenges associated with working with sequencing library preparation.
Plain Language Summary
DNA methylation is a natural chemical modification of DNA that can influence how genes are switched on or off. Changes in methylation patterns are often seen in cancers, including ovarian cancer, which makes DNA methylation a promising marker for cancer detection. In this study, we compared two different laboratory methods for measuring DNA methylation: the Infinium Methylation Array (Illumina) and bisulfite sequencing. These techniques differ in cost, the amount of DNA required, and whether they focus on pre-selected or custom targets. We tested both methods using DNA from ovarian tissue samples and cervical swabs collected during routine cervical cancer screening. Our results show that the two methods produce comparable results, suggesting that bisulfite sequencing may offer a reliable and more affordable alternative for larger studies.
Keywords
Introduction
Early diagnosis of ovarian cancer (OC) continues to represent a major clinical challenge.1,2 DNA methylation in the CpG context is a stable alteration that may serve as a reliable biomarker for early detection.3,4 In our earlier study we identified CpG sites with differential methylation levels between OC patients and patients with benign ovarian disease using fresh-frozen OC tissue samples. 5 However, for early diagnostics purposes, less invasive and more accessible materials such as buccal or cervical swabs, or blood are preferable to tumor tissue. It is therefore important to determine whether these materials can provide meaningful biological information.
Previously, identification of cancer specific CpG sites was performed using Infinium Methylation EPIC array, which interrogates over 850 000 predefined sites. However, in clinical practice, particularly in high throughput screening, a more cost-effective, rapid and versatile platform is required. Targeted bisulfite sequencing (BS) offers such advantages, allowing simultaneous testing of custom targets across many samples, without being restricted by array design. Moreover, targeted sequencing generally requires less input DNA than a methylation array, further supporting its suitability for clinical application.
In this study, we used a previously generated set of methylation profiles obtained by Infinium array and tested whether BS would yield comparable results on the same samples. While diagnostic group comparisons (benign vs malignant) both in tissue samples and in cervical swabs were part of our earlier studies,5,6 the present work focuses solely on cross-platform performance. In addition to tissue samples, we included a set of cervical swabs to assess whether this material can be successfully used for sequencing analysis for diagnostic purposes.
Finally, we provide technical recommendations and propose solutions to common challenges encountered during sequencing library preparation.
Materials and Methods
Sample Collection and Preparation
Fresh frozen OC tissue samples (N = 55) and cervical swabs (N = 25) were collected from patients included in the Pelvic Mass/GOVEC study which were admitted to Gynecologic Clinic at Rigshospitalet (Copenhagen, Denmark). Patients were diagnosed with benign ovarian disease, borderline tumor, or ovarian cancer (Suppl. Table S1). Final diagnoses were retrieved from the Danish Gynecologic Cancer Database (DGCD, https://www.dgcg.dk/). Database. The study was carried out according to the guidelines of the Declaration of Helsinki, including written informed consent from all subjects, and it was approved by the Danish National Committee for Research Ethics, Capital Region (approval codes KF01-227/03, KF01-143/04 and H-15020061).
Tissue samples corresponded to the set used in our earlier study. 5 Cervical swabs were collected with the aim of including both benign and HGSOC cases. It was not possible to collect a swab for each tissue sample, so the two sets are only partially overlapping. Diagnosis was the only information obtained for inclusion in this study. As the present work focuses on technical comparison of methylation platforms rather than diagnostic model development, no further inclusion or exclusion criteria were applied.
DNA from tissue samples was extracted with Maxwell® RSC Tissue DNA Kit (Promega, Madison, WI) and from cervical swabs with QIAamp DNA Mini kit (QIAGEN GmbH, Hilden, Germany). Prior to performing methylation analysis, DNA was bisulfite converted using EZ DNA methylation kit (Zymo Research, Irvine, CA) for Infinium array and using EpiTect Bisulfite kit (QIAGEN) for BS.
Methylation Profiles Generated by Infinium Array – Reference Data
The methylation profiles of 55 ovarian cancer tissues and 25 cervical swabs generated using the Infinium array served as reference data for comparison with the sequencing results. Specifically, OC tissue samples were subjected to methylation analysis on the EPICv1 BeadChip platform (based on human genome 19; hg19, containing 865 859 probes) while cervical swabs were analyzed on the EPICv2 BeadChip (hg38, 930 075 probes). The Bioinformatic pipeline was performed as described, 7 using minfi package. 8 The QC included the removal of samples with an average detection P-value > .05 across all probes, and the removal of individual probes with a detection P-value > .01 in at least one of the samples. Data was further subjected to functional normalization using preprocessFunnorm. 9 Probes affected by common SNPs and cross-reactive probes were filtered out. 7 Beta values were calculated as the ratio between intensities of methylated alleles and total allele intensity. Thus, reference material used for comparison with sequencing data consisted of two sets: one containing 55 OC tissue samples (EPICv1, 711 620 probes kept out of 865 859 following filtering) and the other containing 25 cervical swabs (EPICv2, 873 588 out of 930 075). We limited our analysis to two sets of targets: internal targets (a diagnostic signature previously developed by our research group 5 ; Suppl. Table S2) and external targets (literature-based genome regions; Suppl. Table S3) considering only sites shared between the array and BS panel. The resulting reference data consisted of four matrices with CpG sites as rows (internal or external targets) and samples as columns (tissue samples or cervical swabs): (i) internal targets x tissue samples, (ii) external targets x tissue samples, (iii) internal targets x cervical swabs and (iv) external targets x cervical swabs.
Those four matrices were compared with matching matrices, containing methylation profiles obtained via bisulfite sequencing.
QIAseq Targeted Methyl Panel – Design, Library Preparation, Quality Control, and Sequencing
Our custom-designed sequencing panel (QIAseq Targeted Methyl Custom Panel, Cat. No./ID: 335 602) covered a total of 648 CpG sites. Altogether 119 primers were designed, divided into two main groups. The first group, referred to as internal targets, covered 103 CpGs, however, only 23 were included in the analysis. These 23 single CpG sites were previously reported to have diagnostic potential. 5 The remaining 80 CpG sites, adjacent to the 23 CpGs sites of interest, were excluded from the final analysis. The second group, external targets, contained DNA regions with literature-based cancer-related methylation patterns, added to enhance panel stability (Suppl. Table S3). Fragments amplified by primers designed for external targets covered 545 CpG sites, of which 58 (EPICv1) or 60 (EPICv2) overlapped with probes found in the Infinium arrays, and these were included in the comparison analysis. Of the 648 CpG sites interrogated by the sequencing panel 83 CpG sites (23 internal + 60 external) were included in the final comparison analysis. The remaining CpG sites were excluded because they were either absent from the array, or not directly relevant for diagnostic purposes.
QIAseq targeted methyl libraries were prepared using bisulfite-converted DNA as a starting material (see paragraph Sample collection and preparation) with QIAseq Targeted Methyl Custom Panel kit (QIAGEN) according to manufacturer’s instructions (QIAGEN). Library concentration was estimated with QIAseq Library Quant Assay Kit (QIAGEN). Library size and initial quality control were evaluated using Bioanalyzer High Sensitivity DNA Kit (Agilent Technologies, Santa Clara, CA). Rescue of overamplified libraries (reconditioning) was done using GeneRead™ DNA Library Prep I Kit (QIAGEN; for details see supplementary information).
Libraries were pooled in equimolar concentration and 10 pM pooled libraries, spiked with PhiX (Illumina, San Diego, CA), were sequenced on the Illumina MiSeq instrument using the MiSeq v2 Reagent Kit (300 cycles, Illumina).
BS results (.fastq format) were imported into QIAGEN CLC Genomics Workbench (ver. 23.0.5) and analyzed using a custom workflow (see Suppl. Fig. S1). The final output was a dataset containing methylation levels for 648 CpG sites covered by the panel, interrogated in 80 samples (55 OC tissue samples and 25 cervical swabs). From the output, we extracted four smaller datasets, matching the matrices containing array data.
Data Curation. The Eight Datasets (CpGs x Samples) Used for the Four Comparisons (See Top Row of the Table) Were Generated Using Two Platforms: The Infinium Methylation Array and Bisulfite Sequencing (BS). The Size of These Datasets was Reduced at Several Stages due to Various Selection Criteria, Such as Quality Control During BS, Array Filtering, and Array Format Limitations

Statistical Analysis
We compared the overall methylation levels detected by Infinium arrays vs BS. Spearman correlation was used to assess the relationship between methylation profiles across platforms following normality testing. The extent of differences between the two methods was evaluated using Bland-Altman (B&A) plots (for details see supplementary information).
To assess whether the discriminative power of internal and external targets was preserved when switching from the Infinium array to BS-seq, we trained a regression model on Infinium array data and tested it on the corresponding BS-seq dataset. Given the high number of predictors (CpG sites), we used penalized logistic regression with elastic net regularization and 10-fold cross-validation, rather than standard logistic regression, to reduce overfitting. The trained model was then used to assess consistency between the two platforms by calculating the area under the receiver operating characteristic curve (ROC-AUC). Specifically, we applied the model trained on array data to predict sample classes (benign + borderline vs HGSOC) in the BS-seq dataset and evaluated the accuracy of these predictions. High predictive accuracy would indicate strong concordance between the analytical methods, suggesting that the discriminative signal is preserved across platforms.
All statistical analyses were performed using R programming language (version 4.2).
Results
Quality Control Preceding the Sequencing Run and Troubleshooting
To ensure reliable sequencing results and sufficient coverage, samples must meet specific criteria. Following the manufacturer’s recommendations, we implemented Bioanalyzer analysis as a standard procedure to identify libraries suitable for sequencing runs and those requiring re-preparation or rescue. Figure 1A illustrates a high-quality library, with a distinct peak between 200 bp and 1000 bp. The peak should be smooth, without “dented”, which indicate uneven fragment amplification. Both markers should be visible (at 35 bp and 10 380 bp) and the area between 50 bp and 200 bp should be empty. Figure 1B shows an adapter-dimer peak (between 50 and 200 bp), a relatively common occurrence, particularly with low-input samples. This was frequently observed when using 10 ng DNA isolated from purified cervical swabs as input, which we resolved by increasing the input to 50 ng. Such libraries, if sequenced, will result in low coverage. Adapter dimers, which do not contain a sequence of interest, will occupy the flow cell, thus reducing its capacity for the library fragments. Figure 1C shows library overamplification, which may occur if during the library amplification the primer-to-template concentration ratio is too low. This can be remedied by resolving the overamplification artifacts by an additional PCR cycle with Illumina primers (see supplementary information). Figure 1D shows the same sample after library rescue. Another pitfall is the Bioanalyzer software incorrectly recognizing the upper marker, which prevents correct estimation of the average library size (Figure 1E). To fix this issue, it suffices to manually redefine the upper marker in the Bioanalyzer software (Figure 1F). Examples of Bioanalyzer Images of QIAseq Libraries (A) Good Quality Sequencing Library (B) Library With an Adapter-Dimer Peak Visible in the 50 – 200 bp Region (C) Overamplified Library (D) the Same Library, Subjected to a Rescue Procedure, by an Extra PCR Cycle With Illumina Primers (E) Upper Marker Wrongly Placed by the Bioanalyzer Software (F) the Same Run, With Corrected Upper Marker Placing
Before performing the sequencing run, we verified that all samples met the criteria, with the total primer-dimer content not exceeding 1%.
Comparison Between Methylation Array and Bisulfite Sequencing Results
Out of 25 cervical swab samples, respectively 28% and 40% (7 for internal and 10 for external targets) failed the quality check, compared to about 15% of ovarian cancer tissue samples, where 8 and 9 samples were excluded respectively for internal and external targets. Cervical swabs also performed poorer during the quality control on the level of CpG sites (Table 1). These observations show that they are challenging to work with, as reflected by higher failure rates and poorer quality control performance.
Importantly, both platforms, Infinium array and BS by QIAseq, provided comparable overall methylation levels (Figure 2A). Methylation levels, expressed as beta values, did not differ significantly between the respective samples analyzed using both platforms. Methylation Infinium Array (EPIC) and BS (Done by QIAseq) Give Similar Results Both in Tissue Samples and Cervical Swabs (A) Comparison of Overall Methylation Levels as Beta Values (B) Spearman Correlation Coefficients Across Different Comparisons and in Different Patient Groups (Benign, Borderline and Tumor) (C) Examples of Spearman Correlation Results (D) Bland-Altman Analysis; Horizontal Lines in the Plots Show Upper and Lower Limits of Agreement, and Bias (Median Differences Between Measurements); Trend in the Data (Extent of Bias Depending on the Methylation Level) is Shown as Sinusoidal Line
We then assessed correlation between methylation profiles obtained from the two platforms. Since the data were not normally distributed, we performed Spearman correlation analysis. Correlation coefficients between methylation profiles of tissue samples were generally higher than those of swab samples (R = 0.83 for tissue samples vs R = 0.72 for cervical swabs, P value = 0.00023). At the same time, we observed no pattern across patient groups (benign, borderline, tumor samples; Figure 2B). Specific examples, accompanied by the correlation coefficient values and P-values, can be seen in Figure 2C.
A more detailed analysis of differences between both methods was performed with Bland-Altman (B&A) plots. B&A analysis is recommended for assessing comparability between analytical methods.10,11 Results of the B&A analysis can be seen in Figure 2D and Suppl. Table S4. In general, both methods gave comparable results, with beta values being overall slightly higher (bias) in samples interrogated by the Infinium array rather than by BS using QIAseq. In our case, due to the presence of outliers, differences between measurements were not normally distributed. Therefore, we expressed the bias as a median, which was approximately 0.03. Trend in bias is shown as a sinusoidal line (Figure 2D, Suppl. Table S4).
Of note, in some samples (mostly tissue samples) several sites were reported as completely unmethylated by QIAseq, despite pronounced methylation reported by the Infinium array. Those data points can be seen as a straight diagonal line pointing upwards, above the upper limit of agreement (see two first plots in the Figure 2D). This picture was not restricted to one sample or even one patient group, but rather observed in a few isolated cases. In total, in the ovarian tissue sample datasets, we observed 11 such instances out of 1064 interrogated data points for internal targets and 12 instances out of 2451 for external targets. Although worrying, this phenomenon was rare. We speculate that it may result from differences in chemistry of bisulfite conversion kits used (EZ DNA methylation kit vs EpiTect Bisulfite kit for EPIC array and QIAseq). Selection of the bisulfite conversion kit was made according to the manufacturer’s recommendations.
Diagnostic Utility of the Sequencing Panel
The ultimate goal is to use the panel for diagnostic purposes, so the sequencing data should differentiate patients from controls as effectively as the array-based measurements. Our previous work demonstrated that the internal targets allow separating samples from patients with benign and borderline ovarian disease from OC samples.
5
Here, we demonstrate that this separation pattern is retained in the BS data generated with QIAseq, with OC samples clearly clustering apart from benign and borderline cases (Figure 3A,B). The clustering suggests that the methylation patterns captured by BS are consistent with those identified by the array, reinforcing its potential for diagnostic application. External targets did not allow a clear separation, but the samples still clustered depending on the patient group, using both methods, Infinium array (EPIC) and BS (QIAseq) (Figure 3C,D). Nevertheless, models based on internal and external targets achieved very good discrimination between benign + borderline vs OC groups Next, we examined whether the discriminative power of internal and external targets was retained across platforms. Two models were constructed, one based on internal, the other on external targets. Infinium array (EPIC) data served as the training set, and BS-seq data as the testing set. Both models preserved predictive performance in BS-seq, with ROC-AUC values of 1.00 and 0.93 for internal and external targets, respectively (Figure 3E). Importantly, these high ROC-AUC values indicate comparable performance across analytical platforms, but do not imply diagnostic accuracy in an independent patient cohort. BS (by QIAseq) Recapitulates the Diagnostic Potential Analyzed by Infinium Arrays (EPIC) Observed in Tissue Samples. MDS Plots Show that Patient Samples Cluster according to Diagnosis (Benign/Borderline vs OC Tumor), Regardless of the Platform Used for Methylation Profiling (A) Internal Targets Interrogated by Infinium Array (EPIC) (B) Internal Targets by BS (QIAseq) (C) External Targets by Infinium Array (EPIC) (D) External Targets by BS (QIAseq) 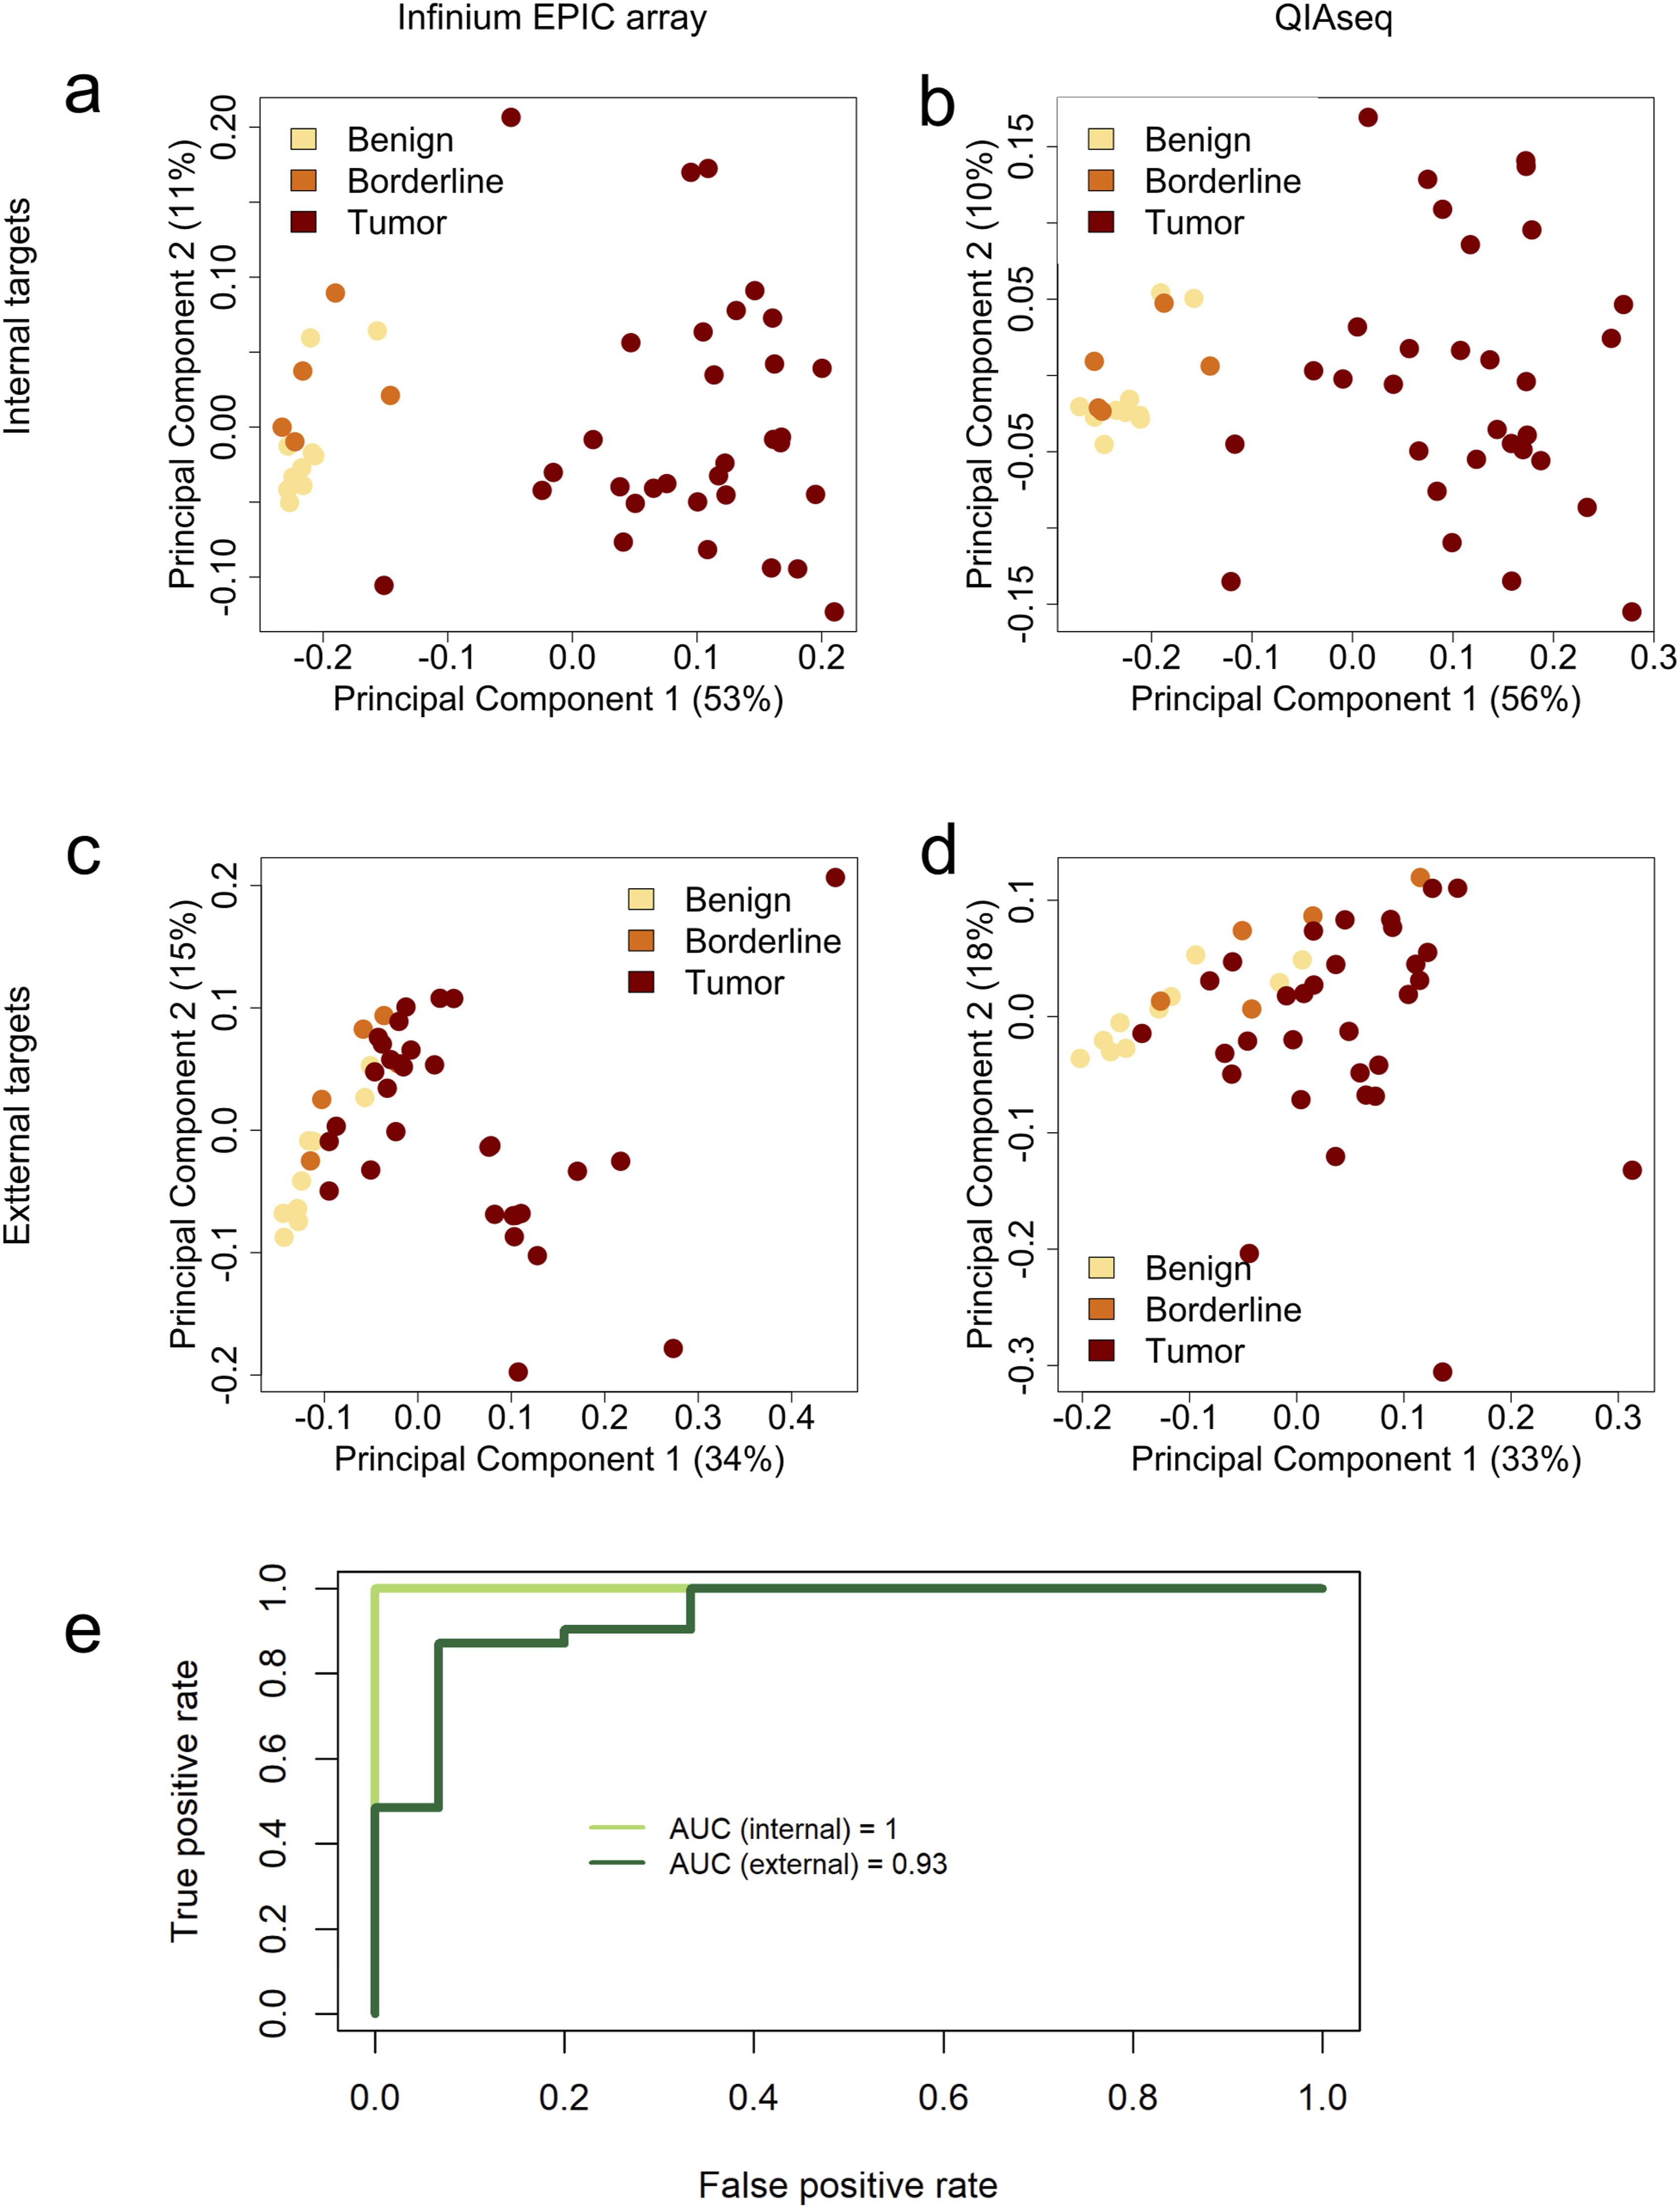
Since both internal and external targets were selected using tissue samples, we did not expect them to have a discriminatory potential in cervical swabs. Consistently, no clustering by patient group was observed (Suppl. Fig. S2). Because the cervical swab dataset contained too few samples to construct a stable regression model, these samples were not included in this part of the analysis.
Discussion
High-quality material is a prerequisite to obtaining credible data as BS is a sensitive technique. Bioanalyzer can provide information about sample quality, and samples that do not meet the desired criteria can either be removed or potentially rescued. The presence of adapter-dimers is a common pitfall, especially in the case of low-input samples. 12 We addressed this issue by changing the purification protocol and increasing the amount of input DNA. If that is not possible, another option may be to dilute adapters before their addition as suggested by Truelsen et al.. 12 Alternatively, pooling several libraries with high adapter-dimer content and performing an additional magnetic bead cleanup can help reduce adapter dimers content and enhance library pool complexity (QIAGEN-internal note).
Another key factor is an accurate library quantification using RT-qPCR. All measurement points must fall within the standard curve range; even small deviations outside this range can cause inaccurate quantification, leading to inflated concentration estimates and over-diluted libraries.
A few other groups have compared the performance of BS and the Infinium methylation array, reporting findings that generally align with ours. For example, two studies reported good agreement between BS and array measurements, although both used the older 450K format, which covers fewer methylation sites than the EPIC array.13,14 Shu et al compared the performance of the Infinium EPIC array and methylation capture sequencing (MC-Seq), which involved bisulfite sequencing following fragment capture and library enrichment. They reported a high concordance between the two methods, with beta value correlations exceeding r = 0.98. This higher correlation, compared to our observations, may partly be due to the larger number of interrogated CpG sites in their study (472 540 shared by both platforms), which provided a more comprehensive and stable assessment of the methylation patterns. In contrast, our comparisons were based on a smaller dataset, involving a maximum of 54 CpG sites per sample (Table 1, final matrix dimensions), which may not fully capture the broader methylation landscape. Additionally, Shu et al. identified 239 CpG sites where the discordance between platforms exceeded a 0.5 beta value and a further 60 514 sites with a discordance greater than 0.1 beta value. 15
Zhou et al also performed a Bland-Altman (B&A) analysis to assess the bias between beta values reported by both platforms. Unlike correlation studies, which only indicate the agreement between datasets, B&A analysis provides insight into any systematic bias - indicating whether one method consistently over- or underestimates values. Additionally, correlation coefficients are influenced by the data range, with wider ranges often producing higher correlation values.10,11
Zhou et al. observed that the bias between methods depended on the degree of site methylation: for sites with low methylation (beta values below 0.5), the array typically reported higher values than the BS, and vice versa, producing a sinusoidal shape in the B&A plot. 13 In our study, only a slight trend was observed and only for internal targets (see the trend lines in Figure 2C and bias values for low and highly methylated sites in Suppl. Table S4). The discrepancy can be related to the choice of CpG sites interrogated, as Zhou and colleagues performed WGBS vs full 450K array rather than restricting their analysis to CpG sites included in a panel. 13 Yu et al, who specifically used QIAseq targeted methyl panel vs 450K array, did not observe a similar pattern either, aligning with our findings. 14
Importantly, caution is warranted when working with low-input material, such as cervical swabs, as their integrity may be compromised. We observed that the correlation between QIAseq and the EPIC array was generally lower for cervical swabs compared to tissue samples. One possible explanation is that the DNA input for the array is lower for swabs than for tissue samples (250 ng vs 500 ng), which could potentially affect the fidelity of the array results. However, the DNA input for QIAseq is identical for both types of samples (50 ng). Despite this, a higher number of swab samples failed the quality check, indicating that this material is generally more challenging to work with. Another possible explanation is that DNA isolated from cervical swabs may contain a higher microbial content. The co-purified microbiome would then inflate total DNA yield, while the proportion of human or tumour-derived DNA remains low. As a result, although we input 50 ng, the effective amount of relevant DNA is lower, potentially leading to reduced coverage, and increased variability.
To our knowledge, there is no study comparing these two platforms using DNA purified from cervical swabs. However, Teh et al compared methylation profiles obtained by Infinium 450K array and MC-Seq using DNA extracted from a different type of surrogate material, namely buccal swabs, obtaining generally good results. They also reported that MC-Seq provides higher density coverage (i.e., more CpGs per region) than the array. This agrees with our findings: out of 545 CpGs specific to our external targets and covered by bisulfite sequencing, only 58 (or 60, depending on the array format) were present on the Infinium array. 16
Our study has several limitations. We only analyzed one surrogate material – cervical swabs. Ideally, future studies should include cfDNA from plasma or buccal samples, which are better suited for non-invasive diagnostics. Since surrogate materials, not tissue, will be used in clinical settings, it’s important to ensure their consistency across platforms. Obtaining reference array data may be challenging, particularly with bisulfite conversion, as Illumina arrays require 250 ng input DNA, a quantity often difficult to obtain from cfDNA. We found no studies comparing cfDNA methylation across platforms. Additionally, our study only includes data for a limited number of CpG sites and lacks a systematic analysis of technical reproducibility on a single platform. Unfortunately, since the diagnostic signature was developed using tissue samples, we were not able to assess its performance in cervical swabs. While we acknowledge the challenges of developing a diagnostic signature from swabs, the present study focuses solely on technical feasibility, specifically comparing the performance of BS and Infinium array in assessing DNA methylation at selected CpG sites.
Conclusions
Overall, our findings suggest that bisulfite sequencing can reproduce results from the Infinium methylation array, particularly in tissue samples with high-quality DNA. While it also performed well in cervical swabs, the agreement was generally stronger in tissue. Importantly, BS-seq allows simultaneous processing of larger sample sets at lower cost, making it well-suited for broader clinical implementation.”
Supplemental Material
Supplemental Material - Comparative Performance of Methylation Array and Bisulfite Sequencing in Ovarian Tissue Samples and Cervical Swabs
Supplemental Material for Comparative Performance of Methylation Array and Bisulfite Sequencing in Ovarian Tissue Samples and Cervical Swabs by Edyta Biskup, Ioanna Andreou, Tim Svenstrup Poulsen, Joanna Lopacinska-Jørgensen, Estrid Høgdall in Cancer Control
Footnotes
Acknowledgements
The authors would like to thank Julie L. Hentze and Douglas V.N.P. Oliveira for their contribution to array preparation. We are also grateful to Jesper B. Andersen and Colm J. O'Rourke from Biotech Research & Innovation Centre, University of Copenhagen, Copenhagen, Denmark, for granting permission to use their facilities and for their assistance with array preparation and scanning. Special thanks to Kristine Vorborg from Department of Clinical Microbiology, Herlev Hospital for her support with sequencing and access to the equipment. We extend our thanks to QIAGEN, particularly to Kristian Kyed, for their technical consultations and troubleshooting support. We are also grateful to Corrie Lynne Madsen for assistance with proofreading and language editing. Additionally, we acknowledge The Danish CancerBiobank for providing the biological material and data on handling and storage.
ORCID iDs
Ethical Considerations
The study was carried out according to the guidelines of the Declaration of Helsinki, including written informed consent from all subjects, and it has been approved by the Danish National Committee for Research Ethics, Capital Region (approval codes KF01-227/03, KF01-143/04 and H-15020061).
Consent to Participate
Informed consent was obtained from all individual participants included in the study.
Author Contributions
Conceptualization: EB, IA, EH; Data curation: EB, Formal analysis: EB, IA; Investigation: EB; Methodology: EB, IA, TSP, EH, Supervision: EH; Writing – original draft: EB; Writing – review & editing: EB, IA, TSP, JLJ, EH. Funding acquisition: EH.
Funding
The authors disclosed receipt of the following financial support for the research, authorship, and/or publication of this article: The Molecular Unit was granted from the Mermaid III foundation and from Købmand Niels Erik Munk Pedersen Fonden (no. 2022-32-140-1).
Declaration of Conflicting Interests
The authors declared the following potential conflicts of interest with respect to the research, authorship, and/or publication of this article: One of the coauthors,
Data Availability Statement
The datasets (raw data) generated during and/or analyzed during the current study are available from the corresponding author on reasonable request.
Supplemental Material
Supplemental material for this article is available online.
References
Supplementary Material
Please find the following supplemental material available below.
For Open Access articles published under a Creative Commons License, all supplemental material carries the same license as the article it is associated with.
For non-Open Access articles published, all supplemental material carries a non-exclusive license, and permission requests for re-use of supplemental material or any part of supplemental material shall be sent directly to the copyright owner as specified in the copyright notice associated with the article.