
Abstract
Introduction
The prototype DNA hypomethylating agents 5-azacytidine (5AC) and decitabine (DAC) are currently FDA-approved for treatment of blood and bone marrow disorders like myelodysplastic syndrome. 5AC and DAC are considered similar drugs and were shown to induce histone modifications that modulate gene expression. The aim of this study is to compare the effect of both drugs on histone acetylation and methylation at multiple histone amino acids residues.
Methods
Mass spectrometry was used to compare the effect of both drugs on 95 different histone posttranslational modifications (PTMs) in leukemia cells. ChIP-Seq analysis was used to compare the impact of both drugs on the genome-wide acetylation of the H3K9 mark using primary leukemia cells from six de-identified AML patients.
Results
Both DAC and 5AC induced histone PTMs in different histone isoforms like H1.4, H2A, H3, H3.1, and H4. Changes in both histone methylation and acetylation were observed with both drugs; however, there were distinct differences in the histone modifications induced by the two drugs. Since both drugs were shown to increase the activity of the HDAC SIRT6 previously, we tested the effect of 5AC on the acetylation of H3K9, the physiological substrate SIRT6, using ChIP-Seq analysis and compared it to the previously published DAC-induced changes. Significant H3K9 acetylation changes (P< .05) were detected at 925 genes after 5AC treatment vs only 182 genes after DAC treatment. Nevertheless, the gene set modified by 5AC was different from that modified by DAC with only ten similar genes modulated by both drugs.
Conclusion
Despite similarity in chemical structure and DNA hypomethylating activity, 5AC and DAC induced widely different histone PTMs and considering them interchangeable should be carefully evaluated. The mechanism of these histone PTM changes is not clear and may involve modulation of the activity or the expression of the enzymes inducing histone PTMs.
Introduction
The prototype nucleoside analogs 5-azacytidine (5AC) and decitabine (DAC) are DNA hypomethylating agents (DHAs) and FDA-approved for the treatment of myelodysplastic syndrome (MDS).1-4 Both drugs were used initially as antimetabolites until their DNA hypomethylating effect and induction of differentiation were discovered. 5 The two drugs are considered similar and interchangeable being structural analogs and due to the similarity of their mechanism of reversing DNA methylation.6-8 However, two major differences exist between DAC and 5AC. First, DAC incorporates into DNA only, while 5AC mainly incorporates into RNA leading to protein translation interference and consequent cytotoxicity. The full incorporation of DAC into DNA was thought to be an advantage over 5AC but it did not translate into any superior clinical effect.9,10 Nonetheless, in lower risk MDS, overall response rates and progression free survival were recently reported to be significantly better with DAC than 5AC treatment. 11 Second, the phosphorylation of both nucleosides is catalyzed by two different enzymes, deoxycytidine kinase for DAC and uridine-cytidine kinase for 5AC. 12
The off-target effects of DNA hypomethylating agents are numerous. 5AC and DAC were reported to induce DNA damage,13-15 apoptosis, reactive oxygen species induction,12,16 and histone posttranslational modifications (PTMs) like histone acetylation and methylation.17,18 In this study, we explore the differences between 5AC and DAC on 95 different histone PTMs and their effect on the genome-wide H3K9 acetylation changes in primary leukemia cells. Distinct differences were observed between the two drugs supporting the paradigm the two drugs are not similar and should not be considered as interchangeable.
Materials and Methods
Histone Extraction and Preparation for Mass Spectrometry
Bulk histones were acid-extracted from Kasumi-1 leukemia cell pellets after treatment with 500 nM of either 5AC (MilliporeSigma, MA) or DAC (MilliporeSigma), propionylated, and subjected to trypsin digestion as described previously.19,20 Briefly, acidic extraction of histones was performed followed by propionylation of the pellet and subsequent drying in a SpeedVac concentrator. The histones pellet was digested by trypsin followed by a second time propionylation and resuspension in .1% TFA in H2O for mass spectrometry analysis.
Mass Spectrometry and Data Analysis
Samples were analyzed on a triple quadrupole (QqQ) mass spectrometer (Thermo Fisher Scientific TSQ Quantiva) directly coupled with an UltiMate 3000 Dionex nano-liquid chromatography system as described previously. 20 Targeted analysis of unmodified and various modified histone peptides was performed three separate times for each sample. Raw MS files were imported and analyzed in Skyline with Savitzky–Golay smoothing. 21
To generate the heatmap, raw data for each replicate was transformed into z-scores for each PTM (rows) followed by cluster analysis using Pearson’s correlation coefficient as the distance measure. PCA was then performed on the transformed data using the scikit-learn and bioinfokit packages in Python.
Patient Samples, Chromatin Immunoprecipitation (ChIP), and Next Generation Sequencing
Mononuclear cells derived from the bone marrow from six de-identified naïve acute myeloid leukemia (AML) patients were obtained from the tissue bank of Cleveland Clinic. Cells were cultured in RPMI medium/10% FBS for 24 hours prior to the experiment in a humidified incubator with 5% carbon dioxide supply. Each patient sample was divided into three groups, the first group (control) treated with DMSO, the second group treated with 5AC (500 nM), and the third group treated with DAC (500 nM) for 72 hours. The data for the third group vs the control was previously published. 18 The cell viability and ChIP-Seq were performed as described previously. 18 Briefly, a ChIP-validated acetylated-H3K9 (H3K9ac) monoclonal antibody (Active Motif, catalogue # 61251) was used for chromatin immunoprecipitation followed by Next Generation Sequencing (NGS) at the Marshall University Genomics Core (MUGC) facility. Sequence reads were aligned to the reference human genome (hg38) using Bowtie v2.3.4.1 in an end-to-end alignment mode. The differentially enriched regions between 5AC-treated and control samples were identified using G-test and negative binomial test for Statistical significance for comparisons within each patient sample and for comparisons using all patient samples as replicates, respectively. 18
Results
DHAs Induce a Variety of Histone PTMs in Leukemia Cells
Histone PTMs like acetylation and methylation are known to modulate gene expression.
22
DHAs modulate gene expression by reversing DNA methylation but can also induce histone acetylation changes and possibly other histone methylation PTMs.
18
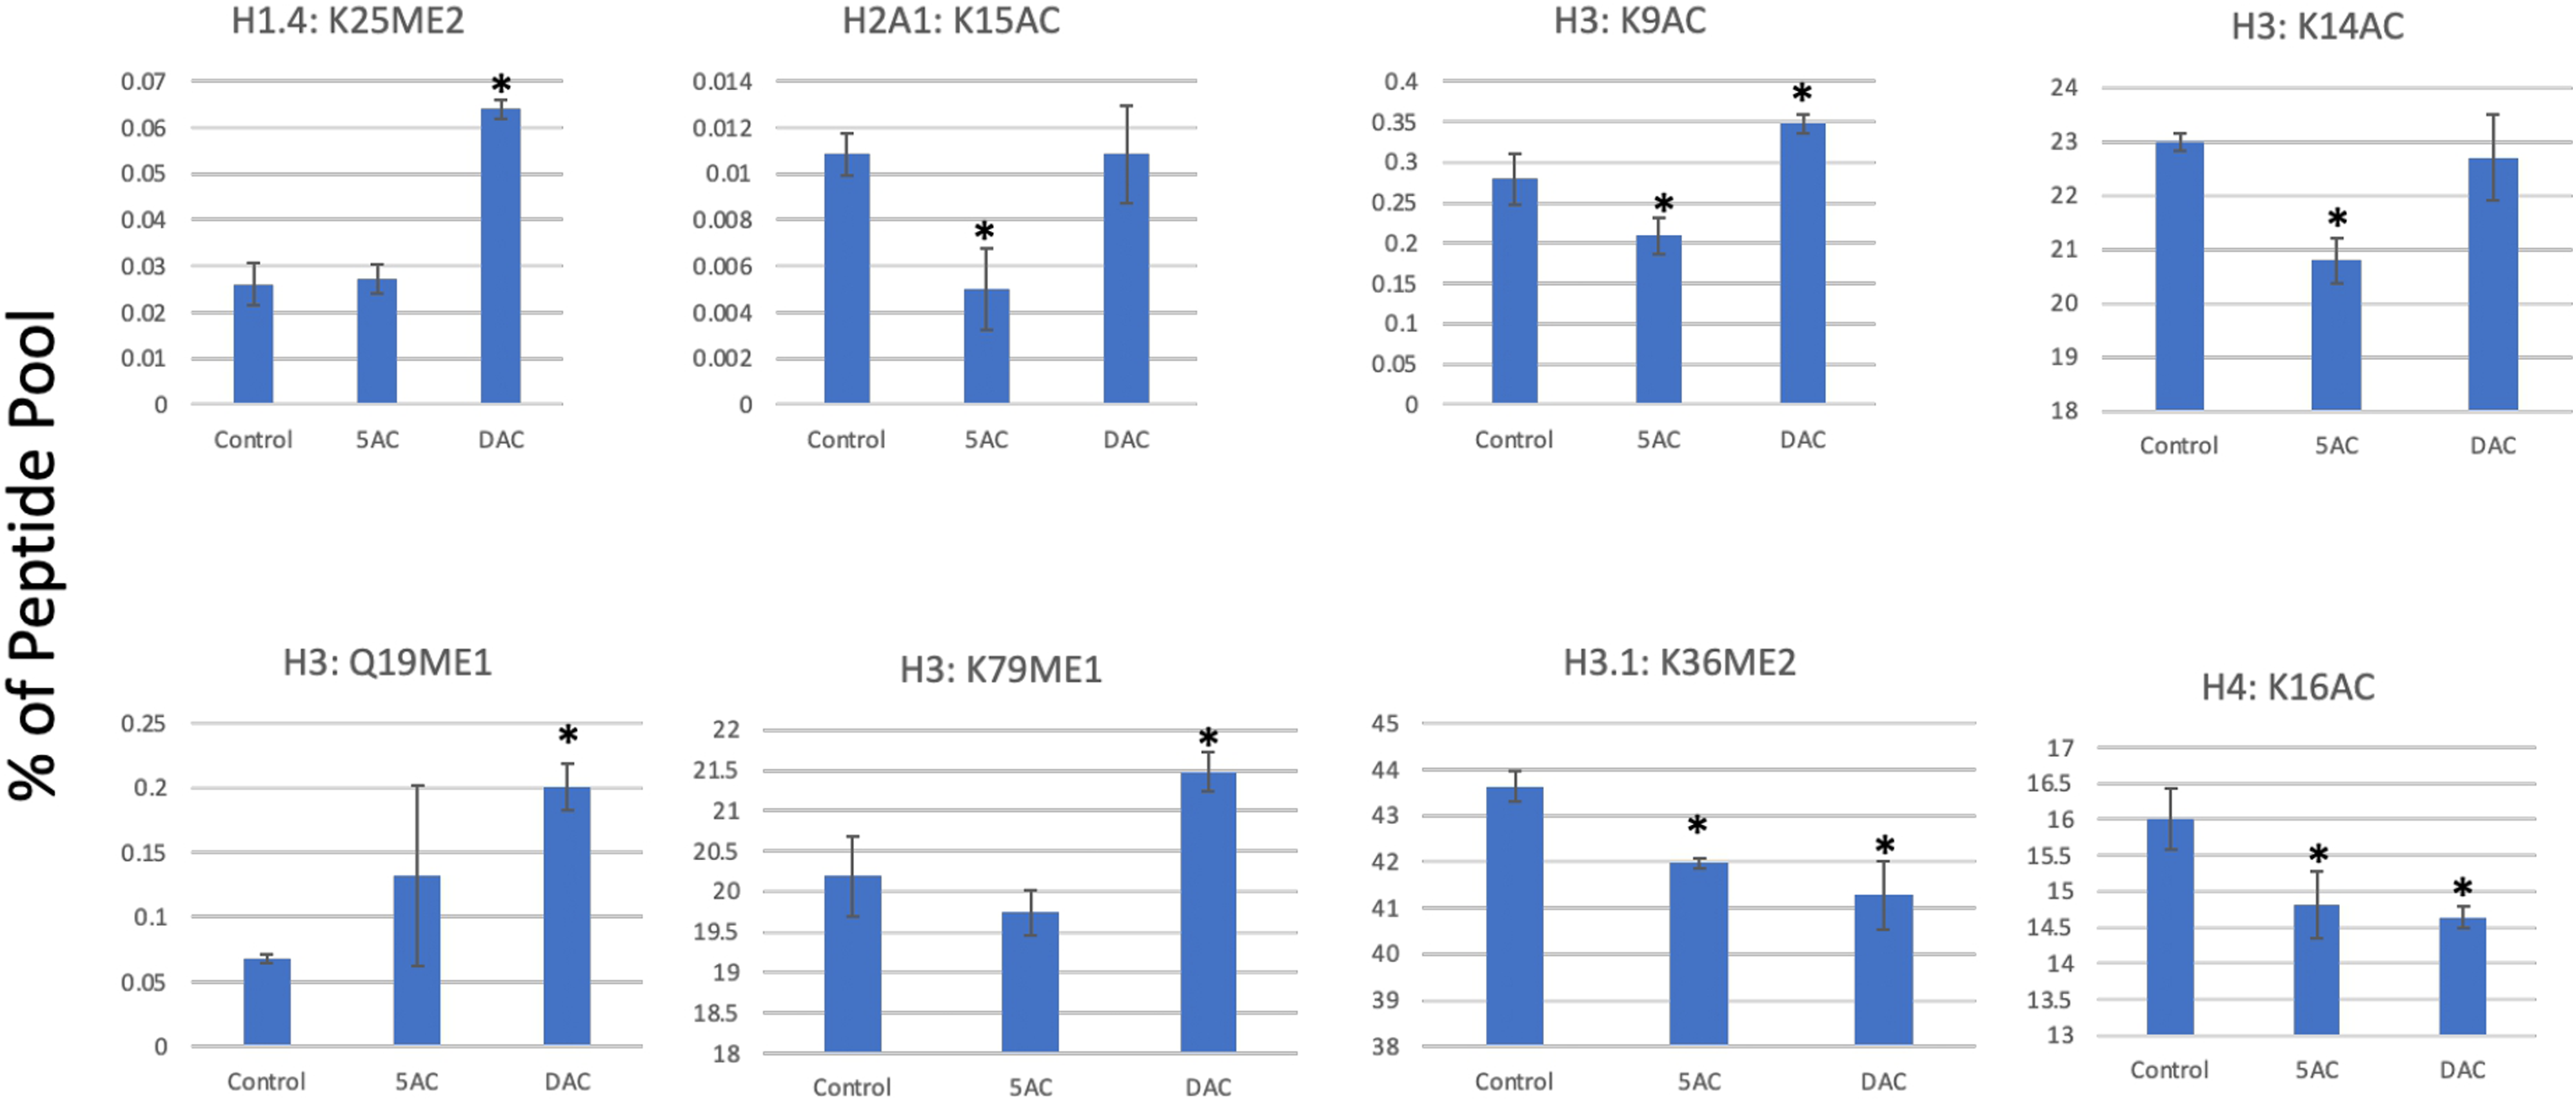
To explore this, we treated Kasumi-1 leukemia cells with 5AC and DAC and analyzed 95 different histone PTMs using mass spectrometry as described under methods. Both drugs induced a variety of histone acetylation and methylation changes in the histone isoforms H3, H4, H2A, and H1.4. The heatmap and cluster analysis in Figure 1 summarizes the histone acetylation and methylation changes detected after treatment with 5AC or DAC. There were distinct differences between the two drugs with minor similarities. For instance, the average of the three replicates shows that DAC induced significant increases in histone methylation at H1.4:K25me2, H3:K18me1, and H3:Q55me1, while 5AC did not change any of these marks. The same was observed with histone acetylation, where DAC induced H2A1:K13, H3:K56, H3.1:K27, and H3.1:K36 marks, while 5AC did not induce a significant change in any of them. Several PTMs were also similarly induced by both drugs but to a different extent like H1.4:K25me3, H2A3:K13ac, H2A3:K15ac, H3:Q19me1, H3:R49me2, H3:K122ac, H4:K20me1, and H4:K20ac. On the other hand, cluster analysis revealed several PTMs that were oppositely modulated by both drugs like H2A:K36ac, H3:R2UN:K4ac, H3:K9ac, H3:R42me2, and H3:K79ac. Figure 2 shows examples of significant acetylation and methylation changes in the H1, H2A, H3, and H4 histone isoforms. Global changes in histone acetylation and methylation induced by DHAs. Kasumi-1 leukemia cells were treated with 500 nM of either 5AC or DAC followed by bulk histone extraction, propionylation, and trypsin digestion for mass spectrometry analysis as described under methods. The data represent the three separate mass spectrometry runs. The heatmap rows show the raw data of each histone PTM for each replicate after transforming to z-scores followed by cluster analysis as described under methods. CTL indicates the DMSO-treated control sample, 5AC indicates 5-azacytidine, and DAC indicates decitabine. Representative changes in histone PTM after 5AC treatment. Kasumi-1 leukemia cells were treated with 500 nM of either 5AC or DAC followed by bulk histone extraction, propionylation, and trypsin digestion for mass spectrometry analysis as described under methods. Each modification is represented as a percentage of the total pool of modifications of that residue. For example, the K9 residue on H3 is either acetylated or unmodified, if H3K9 acetylated is .5% of the peptide pool, this indicates that the unmodified H3K9 is 99.5%. * indicates significant difference from the control at P<.05 using t-test.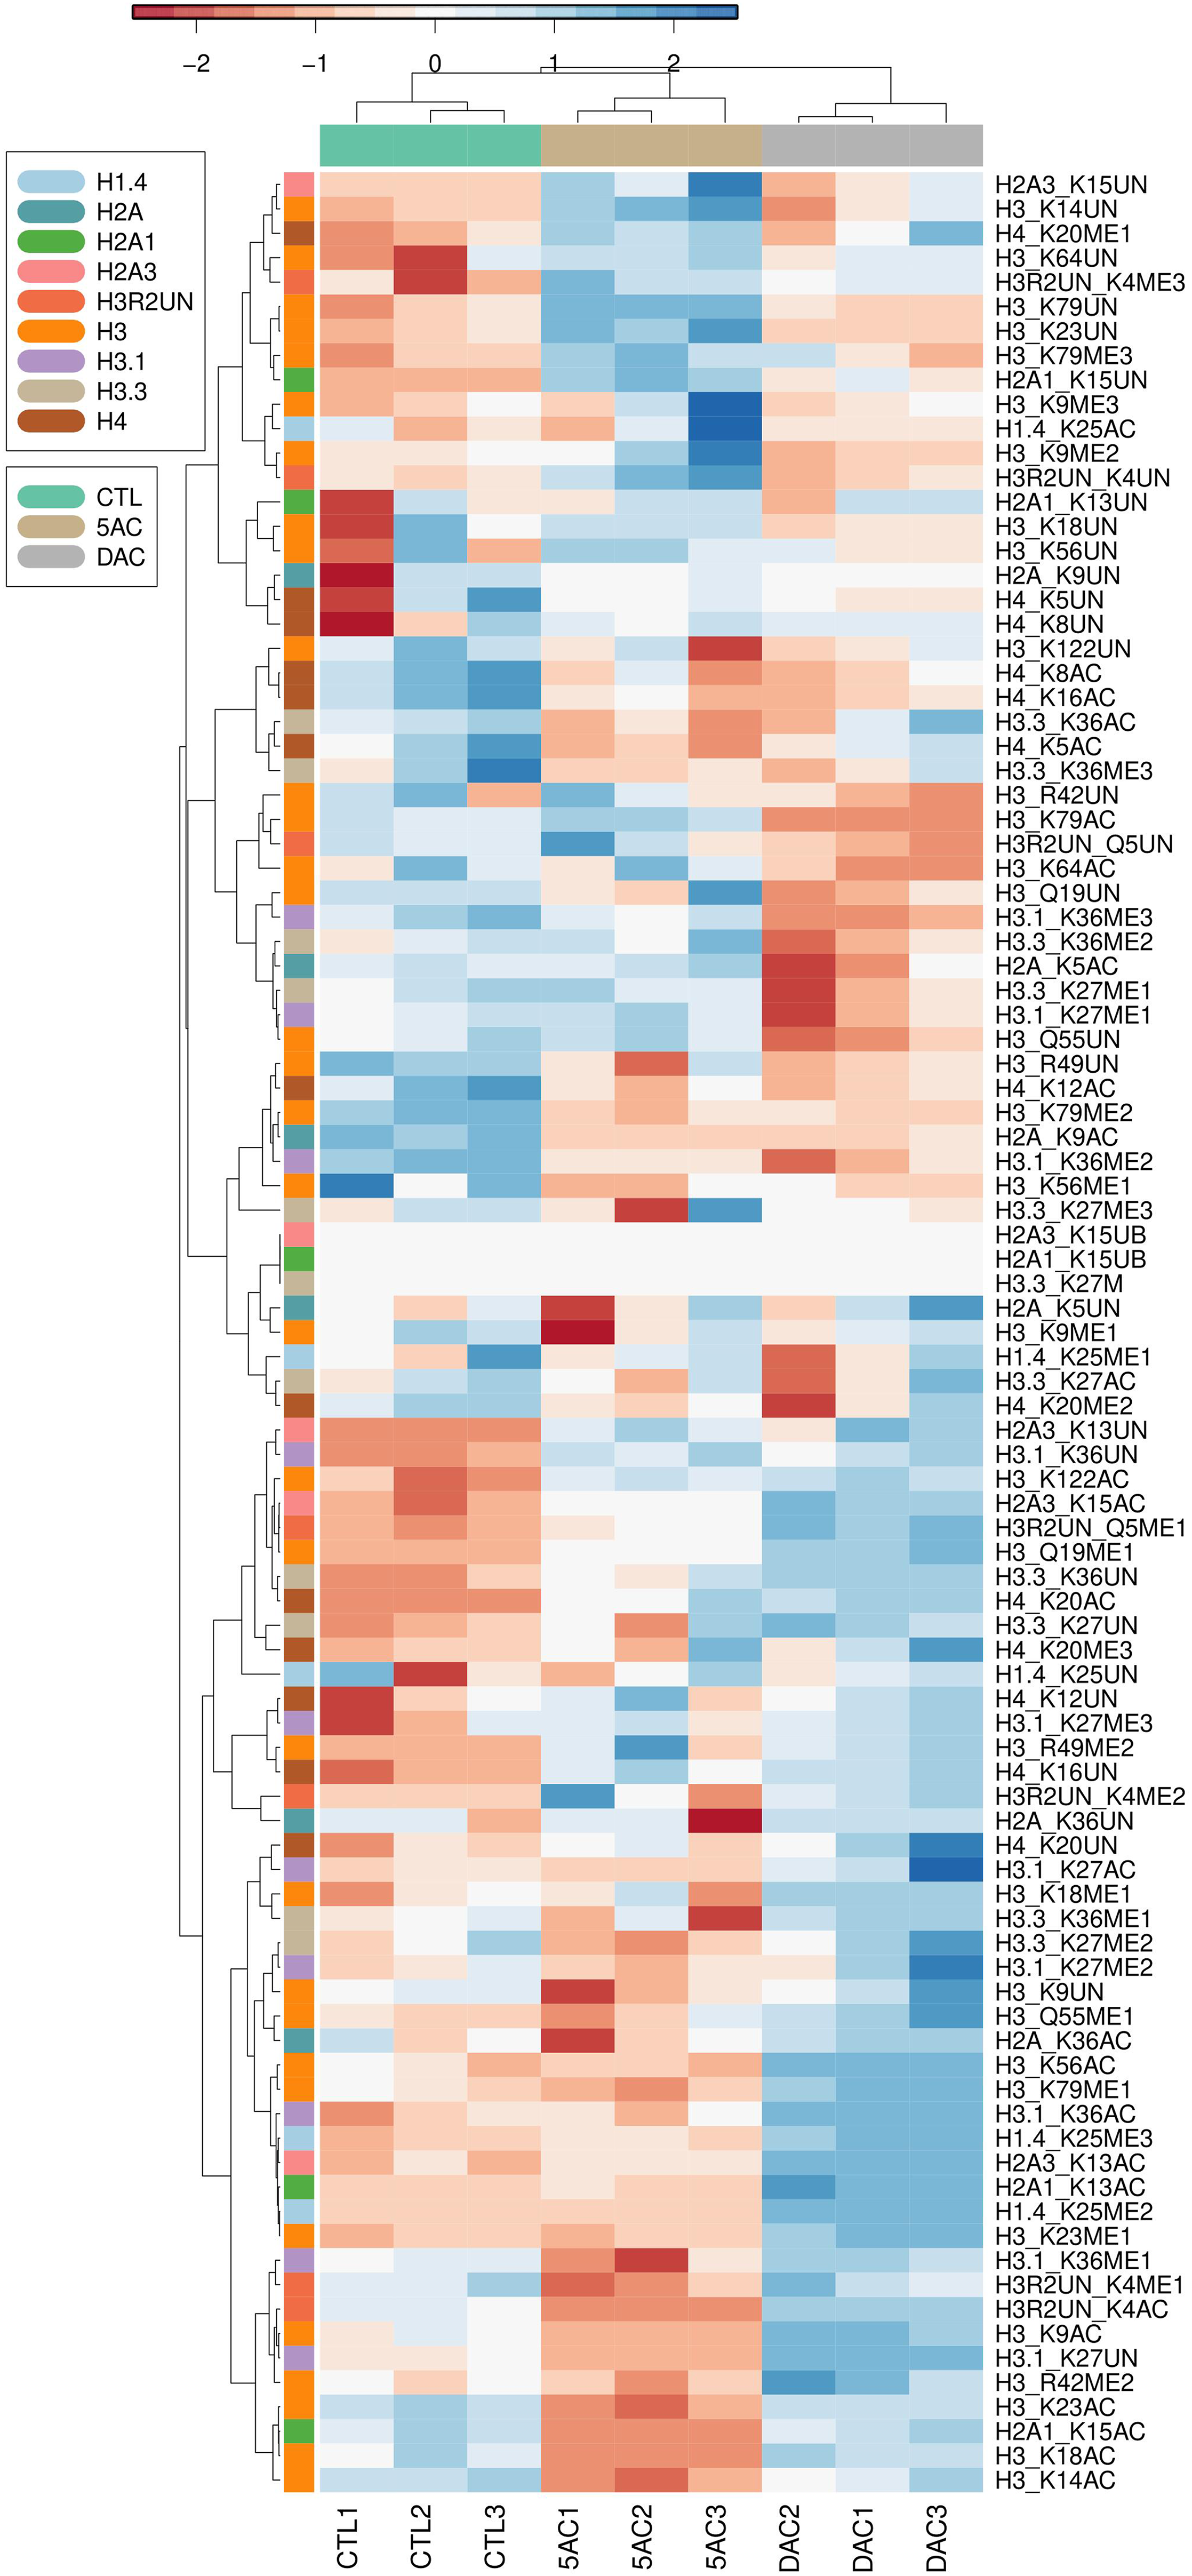
To further emphasize the differences between the two drugs, we used Principal Component Analysis (PCA) to visualize the variation in the data and bring out differences between the control and the drug samples. In PCA, the distance between samples is inversely proportional to their similarity. Figure 3 shows that DAC is separated from the control sample along the PC1 component, while 5AC is separated from the control along the PC2 component. About 71.31% of variation can be explained using the first two principal components. The induced histone PTMs by DAC and 5AC show major differences in their relative abundance as they are separated and inversely correlated along PC1. Overall, both drugs modulated several PTMs with no common pattern of change except for few histone methylation and acetylation marks. Principal Component Analysis (PCA) of the mass spectrometry data. PCA was performed using the scikit-learn and bioinfokit packages in Python as described under methods. The colored dots represent the 95 different histone PTMs in the different histone isoforms.
5AC Induces Gene-specific H3K9 Acetylation Decrease in Leukemia Cells
We previously reported that the nucleoside analog DAC activates the HDAC SIRT6 and modulated H3K9 acetylation,
18
the physiological substrate for SIRT6. In this report, we are exploring the effect of its structural analog 5AC on H3K9 acetylation using primary leukemia cells derived from the same patient samples used in the DAC study. It is noteworthy that the treatment of the patient samples with both drugs and the ChIP-Seq analysis was performed side by side and at the same time. Data pooling from the six patient samples showed significant (P<.05) H3K9 acetylation decrease at 776 genes after 5AC treatment vs 102 genes after DAC treatment. Similar to DAC, 5AC increased H3K9 acetylation in a small percentage of gene loci (149 loci representing 16% of the total H3K9 acetylation changes). 5AC induced H3K9 acetylation changes at different chromosomal regions including promoters, coding exons, introns, and distal intergenic regions. Figure 4 shows the distribution of the acetylation changes around the transcription start site (TSS) after 5AC treatment. H3K9 acetylation in both the control and 5AC-treated cells is enriched around the TSS and the promoter region (between −2000 and 2000 bases). Supplementary Tables 1 and 2 list the genes that showed a decrease and increase in H3K9 acetylation, respectively. They also show the fold change in H3K9 acetylation, the position of acetylation changes relevant to the transcription start site (TSS), the P-value and the adjusted P-value. H3K9 acetylation profiles around the transcription start site (TSS) of genes that showed significant acetylation changes. 4a and 4b show the distribution of H3K9 acetylation decrease and increase around the TSS, respectively. The dashed and the dotted horizontal lines represent the median and modal values for the control (green) and 5AC (red), respectively.
Figures 5A and 5B show the heatmaps for the decrease in H3K9 acetylation after 5AC treatment in the top 10 and 100 genes, respectively. On the other hand, Figures 5C and 5D show the heatmaps for the increase in H3K9 acetylation in the top 10 and 100 genes, respectively. The gene tracks for the top 10 genes showing decreased and increased H3K9 acetylation are shown in Supplementary Figures 1A and 1B, respectively. Comparison of the H3K9 acetylation changes induced by 5AC and DAC identified ten similar genes affected by both drugs (Table 1). While DAC decreased H3K9 acetylation in the ten genes, 5AC decreased H3K9 acetylation in seven genes and increased H3K9 acetylation in the other three genes (PRDM16, RAB3IL1, and TBC1D22 A). The transcription regulators CUX1, PRDM16, DIP2C, and TBL1XR1 were among the similar genes. Heatmaps showing the global changes in H3K9 acetylation in AML patient samples after treatment with 5AC. Purified mononuclear cells from bone marrow samples from six AML patients were treated with 5AC 500 nM for 72 h and H3K9 acetylation was analyzed by ChIP-Seq as described under methods. The heatmaps for the top 10 (5A) and the top 100 genes (5B) showing H3K9 acetylation decrease after 5AC treatment and the heatmaps for the top 10 (5C) and the top 100 genes (5D) showing H3K9 acetylation increase after 5AC treatment are shown. The colored scale at the left side of the heatmap shows the position of acetylation change relative to the Transcription Start Site (TSS). Gene set demonstrating H3K9 acetylation changes after 5AC or DAC treatment. Primary cultured mononuclear cells derived from six AML patients were treated with either 5AC or DC (500 nM) for 72 h. ChIP-Seq analysis was performed with H3K9-specific antibody on chromatin from these cells. Genes whose H3K9 acetylation was modulated by both drugs were identified.

Multiple H3K9 acetylation changes in single genes upstream and downstream the TTS of the gene were detected in 57 genes. For instance, genes like INSL6, JAK2, PDCD1LG2, PTPRF, RCL1, SLC6A9, ST3GAL3, and SZT2 showed 5 or more peaks of decreased H3K9 acetylation upstream and downstream the TTS.
5AC-Induced H3K9 Acetylation Changes Affect Signaling Pathways and the Histone Methylation Machinery
Histone acetylation is known to induce gene expression changes with consequent changes in signaling pathways. The EGF/EGFR Signaling Pathway was shown to affect leukemia cells. Gene set analysis using GeneAnalytics and the data from Supplementary Tables 1 and 2 revealed decrease in H3K9 acetylation in 7 genes that are associated with the EGF/EGFR Signaling Pathway. These genes are JAK2, ATXN2, EPS15L1, PTPN12, EGFR, FOXO1, NEDD4, and GRB2. Another set of 11 genes showed decrease in H3K9 acetylation and was clustered as AML-associated genes. The set included BCR, CCR6, EGFR, FOXO1, INSL6, JAK2, MPL, MYH11, RUNX1, SPI1 and PRDM16. INSL6, JAK2, and MPL showed decreased H3K9 acetylation within their promoter region. H3K9 acetylation changes were also detected in genes related to histone methylation and included the histone lysine methyltransferase DOT1L, PRDM16, and PRDM11 and the histone lysine demethylase KDM2B and KDM4A.
Discussion
In this manuscript, we conducted a comprehensive analysis of the histone PTMs induced by the DHAs 5AC and DAC using mass spectrometry. Both drugs increased and decreased several histone methylation and acetylation marks. The two drugs induced different changes in most of the tested histone PTMs and were distinctly separated by PCA. However, when similar changes existed, DAC produced more pronounced effect. For instance, DAC induced more pronounced methylation and acetylation changes in lysine and glutamine residues like H1.4K25me3, H3Q19ME1, H4K20Ac, and H4K20ME1 compared to 5AC. Further analysis of the effect of the two drugs on H3K9 acetylation using ChIP-Seq emphasized their differential effect on histone PTMs despite their structural similarity. These data highlight the diverse epigenetic changes induced by the nucleoside analogs DHAs and warrant further studies to understand the mechanisms of the reported histone PTMs.
Mass spectrometry has been widely used to study histone PTMs as it provides unbiased, comprehensive, and quantitative investigation of histone PTMs. 23 Traditional methods utilizing antibody-based methods, such as immunoblotting, immunofluorescence and ELISA, to analyze histone PTMs share several limitations like measuring only one or few known modifications at a time, lack of antibodies specificity and epitope masking. On the other hand, mass spectrometry can detect any PTM or combination of PTMs in a quantitative manner and without prior knowledge of the site or type of the modification. A drawback of our histone PTMs analysis using mass spectrometry is the fact that it is reporting the global change in each histone mark. The global change could be misleading because it pools all the increases and decreases of a certain histone mark and add them up. For instance, we detected no changes in H3K14ac after treatment with 5AC or DAC. It is possible that both drugs increased H3K14ac at certain loci and decreased it at different other loci, leading to a net change of zero when pooling the data. Accordingly, it is desirable to confirm the observed changes by mass spectrometry using another method like ChIP-Seq, which can distinguish between the increase and decrease of the histone mark at different loci across the whole genome. A limitation of ChIP-Seq analysis is that it detects only one histone modification at a time.
In this study, mass spectrometry analysis showed that 5AC decreased H3K9ac, while DAC increased H3K9ac. The effect of 5AC on H3K9ac is concordant with our previous finding that nucleoside analogs DHAs activate SIRT6 enzyme, 18 which catalyzes deacetylation of H3K9. However, it is discordant with the observed H3K9ac increase by DAC. An explanation for this discordance, is the fact that we detected both increases and decreases in H3K9ac by ChIP-Seq after DAC treatment and as mentioned-above, mass spectrometry pools all the changes together and add them up without distinguishing between increases and decreases. The observed increases and decreases in H3K9ac after DAC or 5AC treatment despite the expectation of observing only decrease in H3K9ac due to SIRT6 activation was explained previously. 18 Briefly, H3K9ac is a dynamic mark controlled by both histone acetyltransferase (HAT) and the HDAC SIRT6. Activation of SIRT6 could be counteracted by a higher activation of HAT at specific loci leading to an increase in H3K9ac at these loci.
In a comparative gene expression analysis study, it was found that the effect of 5AC and DAC on gene transcription was surprisingly different and showing minimal overlap. 24 Another study revealed distinct differences between the two drugs on cell death and cellular senescence induction. 16 The two studies agree with our findings that the effect of both drugs on histone PTMs and on H3K9 acetylation were significantly different. It was also suggested that the effect of both drugs on the transcriptome was not totally dependent on reversal of promoter DNA methylation since induction of expression of promoter-unmethylated genes was detected. 24 This further supports the relevance of the detected changes in both histone methylation and acetylation in our study because of their impact on gene expression.
In a previous study, we analyzed the effect of DAC on H3K9ac in primary AML cells using ChIP-Seq and we detected decrease in acetylation in 102 genes. 18 In this study, we treated the same AML patient samples with 5AC instead, used same method of analysis and detected decrease in H3K9ac in 776 genes with minimal gene overlap (only ten genes, Table 1). The large differences observed in H3K9ac after treatment with DAC and 5AC were not surprising for us due to the differences in their cellular targets and their processing by cellular enzymes. 25
An important question that arises from the detected changes in histone PTMs after 5AC and DAC treatment is: what are the mechanisms driving these changes? Cytosine methylation-independent mechanisms like changes in enzymes expression or activity of the enzymes involved in histone PTMs are possible and require further investigation. In support of this, the nucleoside analogs DNA hypomethylating agents (5AC, DAC and zebularine) increased the activity of the HDAC SIRT6. 18 Cytosine methylation-dependent mechanisms could also contribute to the observed histone PTMs due to the functional linkage of DNA methylation and histone modifications. 26 In support of that, treatment of bladder cancer cells with 5AC reduced the levels of H3K9me2 and increased levels of H3K4me2 at the methylated p14ARF/p16INK4a locus and induced a rapid and substantial remodeling of the heterochromatic domains. 17
In conclusion, the histone PTMs data reported in this study and previous gene expression data do not support the paradigm that 5AC and DAC are interchangeable DNA hypomethylating agents. These molecular differences could contribute to differences in clinical response to 5AC and DAC, where failure to respond to one agent could be followed by a partial or complete response to the other agent. 27
Supplemental Material
sj-pdf-1-ccx-10.1177_10732748221074051 – Supplemental Material for Differential Histone Posttranslational Modifications Induced by DNA Hypomethylating Agents
Supplemental Material, sj-pdf-1-ccx-10.1177_10732748221074051 for Differential Histone Posttranslational Modifications Induced by DNA Hypomethylating Agents by Sridhar A Malkaram, Aymen Shatnawi, Jun Fan, Hetty Carraway, James Denvir, Donald A Primerano, Zakaria Y Abd Elmageed and Tamer E Fandy in Cancer Control
Footnotes
Declaration of Conflicting Interests
The author(s) declared no potential conflicts of interest with respect to the research, authorship, and/or publication of this article.
Funding
The author(s) disclosed receipt of the following financial support for the research, authorship, and/or publication of this article: Research was supported by a WV-IDeA Network of Biomedical Research Excellence (WV-INBRE) Faculty Research Development Award to TEF. The WV-INBRE program is funded by a grant from the National Institute of General Medical Sciences (NIGMS) of the National Institutes of Health (NIH Award Number P20GM103434). The content is solely the responsibility of the authors and does not necessarily represent the official views of the National Institutes of Health.
Informed Consent
There are no human subjects in this article and informed consent is not applicable.
Supplemental Material
Supplemental material for this article is available online.
References
Supplementary Material
Please find the following supplemental material available below.
For Open Access articles published under a Creative Commons License, all supplemental material carries the same license as the article it is associated with.
For non-Open Access articles published, all supplemental material carries a non-exclusive license, and permission requests for re-use of supplemental material or any part of supplemental material shall be sent directly to the copyright owner as specified in the copyright notice associated with the article.