
Abstract
Objectives
Human cancer is considered to be an important cause of death worldwide. Polypyrimidine tract binding protein 1 (PTBP1) is emerging as a powerful pro-oncogenic factor in bladder and liver cancer; however, no pan-cancer analysis is presently available. Our study aimed to explore PTBP1 expression profiles, prognostic immunological value, and biological functions across various cancers.
Methods
We conducted a comprehensive analysis using multi-omics bioinformatics from public databases, including TIMER, GEPIA2, ProteinAtlas, Kaplan-Meier Plotter, PrognoScan, cBioPortal, STRING, ENCORI, TargetScan, and DAVID.
Results
We found that PTBP1 was overexpressed across multiple cancer types. qRT-PCR results demonstrated that the PTBP1 mRNA was significantly up-regulated in lung adenocarcinoma (LUAD), colon cancer (COAD), and melanoma (SKCM) cell lines, as well as in melanoma-forming mouse models. Higher PTBP1 mRNA levels were associated with poorer survival probabilities in several cancer types. PTBP1 genetic alterations were related to amplification and mutation. PTBP1 significantly modulates tumor immunity by enhancing Tregs infiltration and reducing CD8+ T cell activity, promoting immune evasion and adversely affecting cancer prognosis. GO and KEGG pathway analyses implied that PTBP1 may participate in RNA metabolism, the spliceosome, the cell cycle, and the p53 signaling pathway in cancer development.
Conclusion
Our study is the first to demonstrate the oncogenic role of PTBP1 in a pan-cancer context. PTBP1 might serve as a new biomarker for prognostic prediction and immune cell infiltration across cancers in the future.
Keywords
Introduction
Human cancer is considered to be one of the most frequent public health problems and an important cause of death worldwide. According to the WHO statistics, cancer has been proven as the leading cause of 10 million deaths in 2020. 1 Throughout the world, cancer incidence and mortality are constantly increasing, thus placing a substantial burden on patients, their families, and society. Especially in the midst of the COVID-19 pandemic, cancer patients have a higher risk of COVID-19, severe events, complications, or delayed diagnosis. 2 Prognostic and predictive biomarkers such as PD-L1 expression, tumor mutational load, and neutrophil/lymphocyte ratio have been identified in immunotherapy for renal cell carcinoma. 3 And immunotherapy has broad applicability in oncology.4,5 Yet, appropriate drugs are still to be developed due to the complexity of tumorigenesis, and there are various genes involved in the regulation of migration and invasion of multiple cancers. 6 Therefore, studying the oncogenic role of any interest gene that has diagnostic and prognostic value in cancer is becoming imminent.
A multi-functional RNA binding protein is “Polypyrimidine tract binding protein 1” (PTBP1), which is critical to splicing and expressing in almost all human cell types. PTBP1 has 4 RNA binding domains (RBDs) of the RNA recognition motif (RRM) class. Recently, a minimal but functional PTBP1 has been identified and characterized. 7 PTBP1 plays critical roles in regulating various biological processes, including alternative splice, cell apoptosis and glycolysis, 8 erythrocyte development, 9 and cholesterol biosynthesis procession. 10
In addition to the classical functions mentioned above, recent studies have revealed that PTBP1 is also widely involved in the regulation of many other important physiological and pathological processes, such as stem cell differentiation, cell cycle progression, neural development, immune response, cellular aging, etc. The expression level, subcellular distribution, and activity of PTBP1 are subject to fine multilayered regulation, and the malfunctioning of PTBP1 often leads to the disruption of cellular physiological functions, which is closely associated with the occurrence and development of a variety of human diseases, including neurological diseases, metabolic diseases, autoimmune diseases, genetic diseases, and tumors. 11
PTBP1 shows significant high expression or functionally acquired mutations in a variety of solid tumors (eg, breast cancer) 12 and hematological tumors (eg, leukemia) 13 and is recognized as 1 of the key molecular events driving the progression of many tumors. In-depth mechanistic studies have elucidated that PTBP1 can directly drive various malignant characteristics of tumor cells, including unrestricted proliferation, evasion of apoptosis, infiltration into surrounding tissues, promotion of angiogenesis, and other hallmarks of cancer. This is achieved through the extensive regulation of the splicing and expression of numerous genes closely associated with tumorigenesis, invasion, and metastasis. PTBP1 actively participates in the entire cascade of tumor initiation, progression, and metastasis. 8 Further investigations have demonstrated that the dysregulated expression of PTBP1 in tumor tissues and cancer cells, along with its pro-oncogenic splicing patterns, exhibit significant correlations with clinical parameters such as tumor stage, metastatic status, prognosis, and response to treatment in patients. Consequently, PTBP1 has emerged as a promising candidate for tumor diagnosis, molecular subtyping, and prognosis assessment. These findings underscore the potential utility of PTBP1 as a biomarker to guide clinical decision-making and personalize cancer management strategies. 14
In this study, we first performed pan-cancer analysis using different databases to elucidate the oncogenic role of PTBP1 in cancers. Additionally, gene expression, survival time, genetic alteration, immune infiltration, the related genes and miRNAs prediction, GO, and KEGG pathway enrichment analysis were performed to investigate the mechanism linking PTBP1 to cancer pathogenesis. This study may help to reveal that PTBP1 may work as a diagnostic and prognostic marker in patients with cancers.
Materials and Methods
Evaluation of PTBP1 Expression in TCGA and GTEx Samples
We performed a systematic analysis of PTBP1 expression across the Cancer Genome Atlas (TCGA) and Genotype-Tissue Expression (GTEx) dataset projects. Gene expression analysis was obtained from 2 publicly available servers, TIMER2 (https://timer.cistrome.org/) 15 and GEPIA2 (https://gepia2.cancer-pku.cn/). 16 TIMER2 web server was employed to analyze PTBP1 mRNA expression in thousands of samples of 33 cancer types in TCGA datasets. However, some cancer types lack normal tissues for comparison in TCGA datasets, such as DLBC, LGG, SARC, TGCT, THYM, ACC, BRCA, LAML, OV, and UCS. Then, we used the GTEx dataset as a control and evaluated the mRNA expression level of PTBP1 using GEPIA2. The filters included the gene name, “PTBP1”, P-value, and log2FC (Fold change) cutoff = 1, the datasets of the above 10 cancers, and “Match TCGA normal and GTEx data.”
Distribution of the protein expression levels of PTBP1 in different cancer types was also conducted in clinical proteomic tumor analysis consortium (CPTAC) dataset by using UALCAN (https://ualcan.path.uab.edu/analysis-prot.html).UALCAN provides protein expression analysis for breast cancer, ovarian cancer, colon cancer, clear cell RCC, UCEC, and LUAD. 17 We input PTBP1 in the “CPTAC analysis” module of UALCAN and found PTBP1 protein differential expression difference between 6 primary tumors and their adjacent normal tissues in the CPTAC dataset.
To evaluate whether the PTBP1 expression level was associated with different pathological tumor stages, the violin plots were created based on PTBP1 expression features and different patient pathological stages in GEPIA2. GEPIA2 contains RNA sequencing expression data from tens of millions of tumor and normal samples in TCGA. GEPIA2 provides customizable functions, including gene expression analysis in different cancer types, pathological stages, or patient survival time and similar gene detection analysis. 16 Effective application of GEPIA2 continues throughout the entire study period.
Cell Culture, Mouse Modeling and qRT-PCR
Human bronchial epithelial cells (BEAS-2B), human lung adenocarcinoma cell line (A549), human non-small cell lung adenocarcinoma cell line (H1975), human normal colon epithelial cell line (NCM460), human colon carcinoma cell line (HCT116), mouse normal melanocytes (Normal) and mouse melanoma cell line (B16) were purchased from Fortune Bioscience Co. (Shanghai, China). Human bronchial epithelial cells (BEAS-2B) were cultured in high-glucose Dulbecco’s modified Eagle’s medium (DMEM) supplemented with 10% fetal bovine serum (FBS) and 1% penicillin/streptomycin and human lung adenocarcinoma cell line (A549), mouse normal melanocyte (H817), and human normal colon epithelial cell line (NCM460) were cultured in high glucose Dulbecco’s medium (DMEM) supplemented with 10% fetal bovine serum (FBS). 10% fetal bovine serum (FBS) and 1% penicillin/streptomycin in Dulbecco’s Modified Eagle Medium/Nutrient Mixture F-12 (DMEM/F12), and the human non-small cell lung adenocarcinoma cell line (H1975) and mouse melanoma cell line (B16) were cultured in DMEM/F12 supplemented with 10% fetal bovine serum (FBS) and 1% penicillin/streptomycin in Roswell Park Memorial Institute (RPMI) 1640 medium, and the human colon cancer cell line (HCT116) was cultured in McCoy’s 5A medium supplemented with 10% fetal bovine serum (FBS) and 1% penicillin/streptomycin. All cells were cultured at 37°C in a humidified environment containing 5% CO2.
Healthy and harmless BALB/c Nu nude mice, female mice, 3 to 4 weeks old, weighing 14-20 g, 12 mice, 6 mice in the normal group (Control) and 6 mice in the modeling group (Tumor) were purchased from the Clinical Public Laboratory Center, and were kept in the SPF grade breeding room of the Clinical Public Laboratory Center. The experimental animals used in this study and the operating procedures of animal experiments were in accordance with the regulations on the management of experimental animals of the Ethics Committee of our hospital, and the 3R principles of animal experiments were strictly adhered to. B16 cells in the logarithmic growth phase were taken, washed twice with sterile PBS, digested routinely with trypsin, centrifuged at 1000 r/min for 4 min, then washed 1-2 times with PBS and centrifuged, and then resuspended by sterile PBS to form individual cells, counted, and the concentration of the cells was 2 × 10⁷ cells/mL, and then put on ice. 100 μL of the cell suspension was injected into the right side of nude mice by using a disposable sterile syringe with a capacity of 1 mL. 100ul was injected into the axillary subcutis of the right forelimb of nude mice. When the cell suspension was pushed in, the injection site was bulging, and the needle was left in place for a few seconds or the injection site was gently clamped with tweezers to prevent leakage of the cell solution. After inoculation of the tumor cells, the mice were sent to the animal room for rearing, and after injection, they were free to drink and eat, and the mice were regularly observed for their spirit, diet, and tumor formation. When the tumors grew to about 100 mm3 in size, the tumor volume and the body weight of normal mice were detected, and the body weight and tumor formation were in the supplemental data (Figures S6-S8). All procedures on animals were approved by the Experimental Animal Welfare Ethics Committee of Zunyi Medical University (approval No. zyfy-an-2023-0316). The reporting of this study conforms to ARRIVE 2.0 guidelines. 18
Total RNA was isolated from cells and tissues using the GREENspin Cellular RNA Extraction Kit (ZOMANBIO, China), and then the RNA concentration was detected using a NanoDrop 2000 spectrophotometer (Thermo, USA). After reverse transcription by PrimeScript RT reagent Kit (Takara, Japan), RNA concentration was measured using TB Green Premix Ex Taq II (Takara, Japan) for qRT-PCR by CFX96 real-time system (Bio-Rad, USA). GAPDH was used for standardization. Primers were purchased from Sangon Biotech (Shanghai, China), and the sequences are shown in the supplemental data (Tables S2, S3).
Prognosis Survival Analysis
A tumor patient’s prognosis is usually assessed by survival time, including cancer-specific survival, overall survival (OS), disease-free survival (DFS), or relative survival. 19 Herein, we applied GEPIA2 for statistical analysis of patient DFS and OS and PTBP1 expression levels. The cutoff value to separate low or high level of PTBP1 was 50% in this study.
Survival curves of patients with lung cancer and breast were generated using the Kaplan-Meier Plotter online tool (https://kmplot.com/). The PrognoScan database (https://www.abren.net/PrognoScan/) is also a tool for assessing the biological relationships between gene expression and prognosis.
Genetic Alteration Analysis
Information regarding the genetic alteration features of PTBP1 in pan-cancer was obtained from Cbioportal platforms (https://www.cbioportal.org/). Genetic alterations of PTBP1, including amplification, mutation, fusion, deep deletion, and multiple alterations, were all acquired from TCGA Pan-Cancer Atlas Studies by utilizing cBioPortal.20,21
Immune Infiltration Analysis
To explore the associations between PTBP1 and immune cell infiltration, we employed TIMER2.0, 15 a useful resource for comprehensive analysis of tumor-infiltrating immune cells. The results were represented as heatmaps and scatter plots. Immune cell infiltration was inferred using CIBERSORT, CIBERSORT-ABS, QUANTISEQ, EPIC, MCPCOUNTER, XCELL, TIED, or TIMER algorithm. The P-values and partial correlation values were obtained by applying the purity-adjusted Spearman’s rank correlation test.
Construction of a PPI Network
We derived the human protein–protein interaction (PPI) network from the STRING database (https://string-db.org/), 22 which covered lots of physical and functional interactions between the expressed protein. First, PTBP1 was input into the STRING database to construct a PPI network in homo sapiens. Next, the PPI network, containing 50 PTBP1-binding proteins, was reconstructed under the basic settings: minimum required interaction score = low confidence (0.150), active interaction sources = experiments, meaning of network edges = evidence and max number of interactors to show = no more than 50 interactors).
Collection of PTBP1-Related Genes
According to a previous report, 23 the first 100 most correlated targeting genes were selected by using a similar gene detection module from GEPIA2. The correlation analysis between PTBP1 and the top 5 PTBP1-related genes (DAZAP1, LMNB2, ELAVL1, RFWD3, PRPF40 A) was performed using the Pearson correlation analysis, and results were then displayed as scatter plots. Then, we used TIMER2 to generate a heatmap of PTBP1 with the 5 genes mentioned above. Finally, the intersection of 100 bindings and 50 interacted genes was obtained using the Ugent web tool (https://bioinformatics.psb.ugent.be/webtools/Venn/).
Functional Enrichment Analysis and Pathway Analysis
To reveal the potential roles of the obtained 150 genes, we used DAVID (https://david.ncifcrf.gov/) to perform Gene Ontology (GO) enrichment analysis and Kyoto Encyclopedia of Genes and Genomes (KEGG) pathway enrichment analysis. DAVID is acknowledged as a powerful gene functional annotation tool for annotation, visualization, and integrated discovery. P value less than 0.05 is considered as the cutoff criteria. We used the default parameters throughout the analysis. Finally, the KEGG pathway and GO enrichment (biological process, cellular component, and molecular function) were visualized by https://www.bioinformatics.com.cn/, an online platform for data analysis and visualization.
Identification of PTBP1-Targeting miRNAs
ENCORI (https://starbase.sysu.edu.cn/) is an open-source platform for scientists to explore the interactions of miRNA-ceRNA, miRNA-ncRNA, protein-mRNA based on CLIP-seq, degradome-seq, and RNA-RNA interactome data. 24 TargetScan (https://www.targetscan.com/) is also a widely used target prediction program. 25 We employed these 2 databases to search for miRNAs that are most likely to bind to PTBP1 mRNA. We observed 3 miRNAs (miR-1-3p, miR-206 and miR-133b) presented in each database.
Statistical Analysis
The correlations between gene expression were assessed using the Pearson correlation coefficient. P < 0.05 is considered statistically significant. In figures, the significance levels are presented by asterisks: *P < 0.05, **P < 0.01, ***P < 0.001.
Results
mRNA and Protein Expression Levels of PTBP1 in Different Types of Human Cancers
Accumulating evidence suggests that PTBP1 is strongly associated with diverse cancer types. To explore the expression level pattern of PTBP1 in different tumor tissues, we evaluated the mRNA expression level of PTBP1 across various cancer types or specific cancer subtypes of TCGA by applying TIMER2. Relative to normal tissues, mRNA expression level of PTBP1 was up-regulated in many tumor tissues, including BLCA (Bladder Urothelial Carcinoma), BRCA (Breast invasive carcinoma), CESC (Cervical squamous cell carcinoma and endocervical adenocarcinoma), CHOL (Cholangiocarcinoma), COAD (Colon adenocarcinoma), ESCA (Esophageal carcinoma), GBM (Glioblastoma multiforme), HNSC (Head and Neck squamous cell carcinoma), KIRC (Kidney renal clear cell carcinoma), KIRP (Kidney renal papillary cell carcinoma), LIHC (Liver hepatocellular carcinoma), LUAD (Lung adenocarcinoma), LUSC (Lung squamous cell carcinoma), PRAD (Prostate adenocarcinoma), READ (Rectum adenocarcinoma), STAD (Stomach adenocarcinoma), THCA (Thyroid carcinoma) and UCEC (Uterine Corpus Endometrial Carcinoma) (Figure 1A). Expression profile of PTBP1 in different cancers and pathological stages. (A) The expression level of PTBP1 gene across diverse cancers types and subtypes were systematically analysed by applying TIMER2; (B) Protein level of PTBP1 was investigated through CPTAC dataset; (C) The expression level of different pathological stages in some cancers were also explored based on TCGA data. *P < 0.05. **P < 0.01. ***P < 0.001.
For the cancers lacking normal tissues for comparison in TCGA, we used the GTEx dataset as a control and evaluated the PTBP1 mRNA expression using GEPIA2. Interestingly, BRCA (Breast invasive carcinoma) didn’t show high PTBP1 expression compared to normal tissues from GTEx (Figure S1B), which appears contradictory to the TCGA results in Figure 1A. This discrepancy may be attributable to the different normal tissue sources used in TCGA (adjacent normal) and GTEx (non-tumor tissue), as well as potential batch effects between the 2 datasets. The use of different normal tissue references could lead to the observed inconsistency in PTBP1 expression patterns for BRCA (Breast invasive carcinoma). Other cancer types like ACC (Adrenocortical carcinoma), LAML (Acute myeloid leukemia), OV (Ovarian serous cystadenocarcinoma) and UCS (Uterine carcinosarcoma) also exhibited no significant PTBP1 upregulation vs GTEx normals (Figure S1B). In contrast, 5 cancer types including DLBC (Lymphoid neoplasm diffuse large B-cell lymphoma), LGG (Brain lower grade glioma), SARC (Sarcoma), TGCT (Testicular germ cell tumors) and THYM (Thymoma) displayed relatively higher PTBP1 levels than GTEx normal tissues (Figure 1A, all P < 0.001).
The CPTAC dataset was investigated to evaluate PTBP1 protein levels in human cancers. In breast cancer, ovarian cancer, colon cancer, clear cell RCC, and UCEC, the total PTBP1 protein level of tumor tissue was significantly increased compared to the normal tissues (Figure 1B). Furthermore, we analyzed the expression of PTBP1 in different pathological stages of multiple tumors using GEPIA2. Our results showed that the expression of PTBP1 was significantly correlated with tumor pathological grade of ACC, KICH, KIRC, LIHC, LUAD, OV, PAAD and SKCM (Figure 1C, all P < 0.05) but not others (Figure S2). These results suggested that PTBP1 was abnormally overexpressed in human pan-cancer.
Validation of PTBP1 Expression by qRT-PCR in Cell Lines and Mice after Modeling
We confirmed by qRT-PCR that PTBP1 mRNA was significantly up-regulated in a human lung adenocarcinoma cell line (A549) and a human non-small cell lung adenocarcinoma cell line (H1975) using a human bronchial epithelial cell (BEAS-2B) as a control (Figure 2A), and that PTBP1 mRNA expression was significantly increased in a human colon carcinoma cell line (HCT116) using a normal colon epithelial cell line (NCM460) as a control (Figure 2B), and up-regulation was also seen in a mouse melanoma cell line (B16) using mouse normal melanocytes (Normal) as a control (Figure 2C). Significant upregulation of PTBP1 mRNA expression was also found in a melanoma tumorigenic nude mouse (Tumor) model using normal nude mouse skin (Control) as a control group (Figure 2D). qRT-PCR validation of PTBP1 expression within cell lines and mice after modeling. (A) Expression of PTBP1 mRNA in A549 and H1975 was verified by qRT-PCR and compared with BEAS-2B; (B) qRT-PCR verified the expression of PTBP1 mRNA in NCM460 and HCT116; (C) qRT-PCR to verify the expression of PTBP1 mRNA in mouse normal melanocytes (Normal) and B16; (D) qRT-PCR validation of PTBP1 mRNA expression in normal nude mouse skin (Control) and melanoma tumorigenic nude mouse model (Tumor). GAPDH was used for normalization (*P < 0.05, ****P < 0.0001).
Prognostic Role of PTBP1 in Human Pan-Cancer
To examine the effects of PTBP1 expression on prognostic role in human pan-cancer, we investigated overall survival and disease-free survival of patients with PTBP1 differential expression. Analyses of ACC, KIRP, LGG, LIHC, LUAD, MESO, SARC and SKCM overall survivals showed significant associations with high PTBP1 expression (Figure 3A, p = 0.00042, 0.029, 0.00000095,0.025, 0.029, 0.022, 0.013, 0.0012). For discordant cancer, KIRC cancers showed significant results in the associations with low PTBP1 expression (Figure 3A, p = 0.0042). Disease-free survival analyses from ACC, LGG and LUAD patients also exhibited a significant correlation with high PTBP1 expression (Figure 3B, p = 0.015, 0.000031,0.042). The associations between PTBP1 expression level and patient survival. The patients were divided into high and low expression groups using the median expression level value. The survival curve includes (A) overall survival and (B) disease-free survival.
Simultaneously, the Kaplan-Meier Plotter database revealed a correlation between high PTBP1 expression and poor OS in lung cancer patients (Figure 3A, P = 0.0000051) and breast cancer patients (Figure 3B, P = 0.02). The poor prognosis in lung cancer patients with higher PTBP1 expression (Figure 3B) was in line with the data from the Kaplan-Meier plotter analysis (Figure 3A, OS, P = 0.0000051; PPS, P = 0.00029; FP, P = 0.002). Moreover, analysis of the PrognoScan database showed a significant correlation between PTBP1 expression and the poor prognosis for bladder transitional cell carcinoma, brain astrocytoma, breast cancer, lung adenocarcinoma, ovarian cancer and liposarcoma (Table S1). These results collectively suggested the prognostic value of the PTBP1 expression in human pan-cancer.
Genetic Alteration of PTBP1 in Human Pan-Cancer
Furthermore, we explored the frequency and types of PTBP1 genetic alterations in cancers. TCGA sequencing data from the cBioPortal database were analyzed to investigate PTBP1 gene alterations, including mutations, copy number aberrations, and structural variants such as gene fusions, in 10 967 samples from 32 studies covering the entire TCGA pan-cancer dataset. We observed 104 mutation sites between amino acids 0 and 531 (Figure 4A). In addition to mutations, we detected that 9% of sarcoma patients harbored amplification of PTBP1 (up to 6% of samples in the TCGA), which was the most common alteration (Figure 4B). Data from TCGA pan-carcinoma studies exhibited high mutation rates of PTBP1 in uterine corpus endometrial carcinoma (4%), melanoma (3%), and DLBC (2%) (Figure 4B). Gene fusions involving PTBP1, though infrequent, were observed in a few cancer types, including mesothelioma (around 1% frequency), prostate, and ovarian (Figure 4B). Mutation information of PTBP1 in different tumors of TCGA in the cBioPortal website. (A) Mutation site; (B) Mutation type.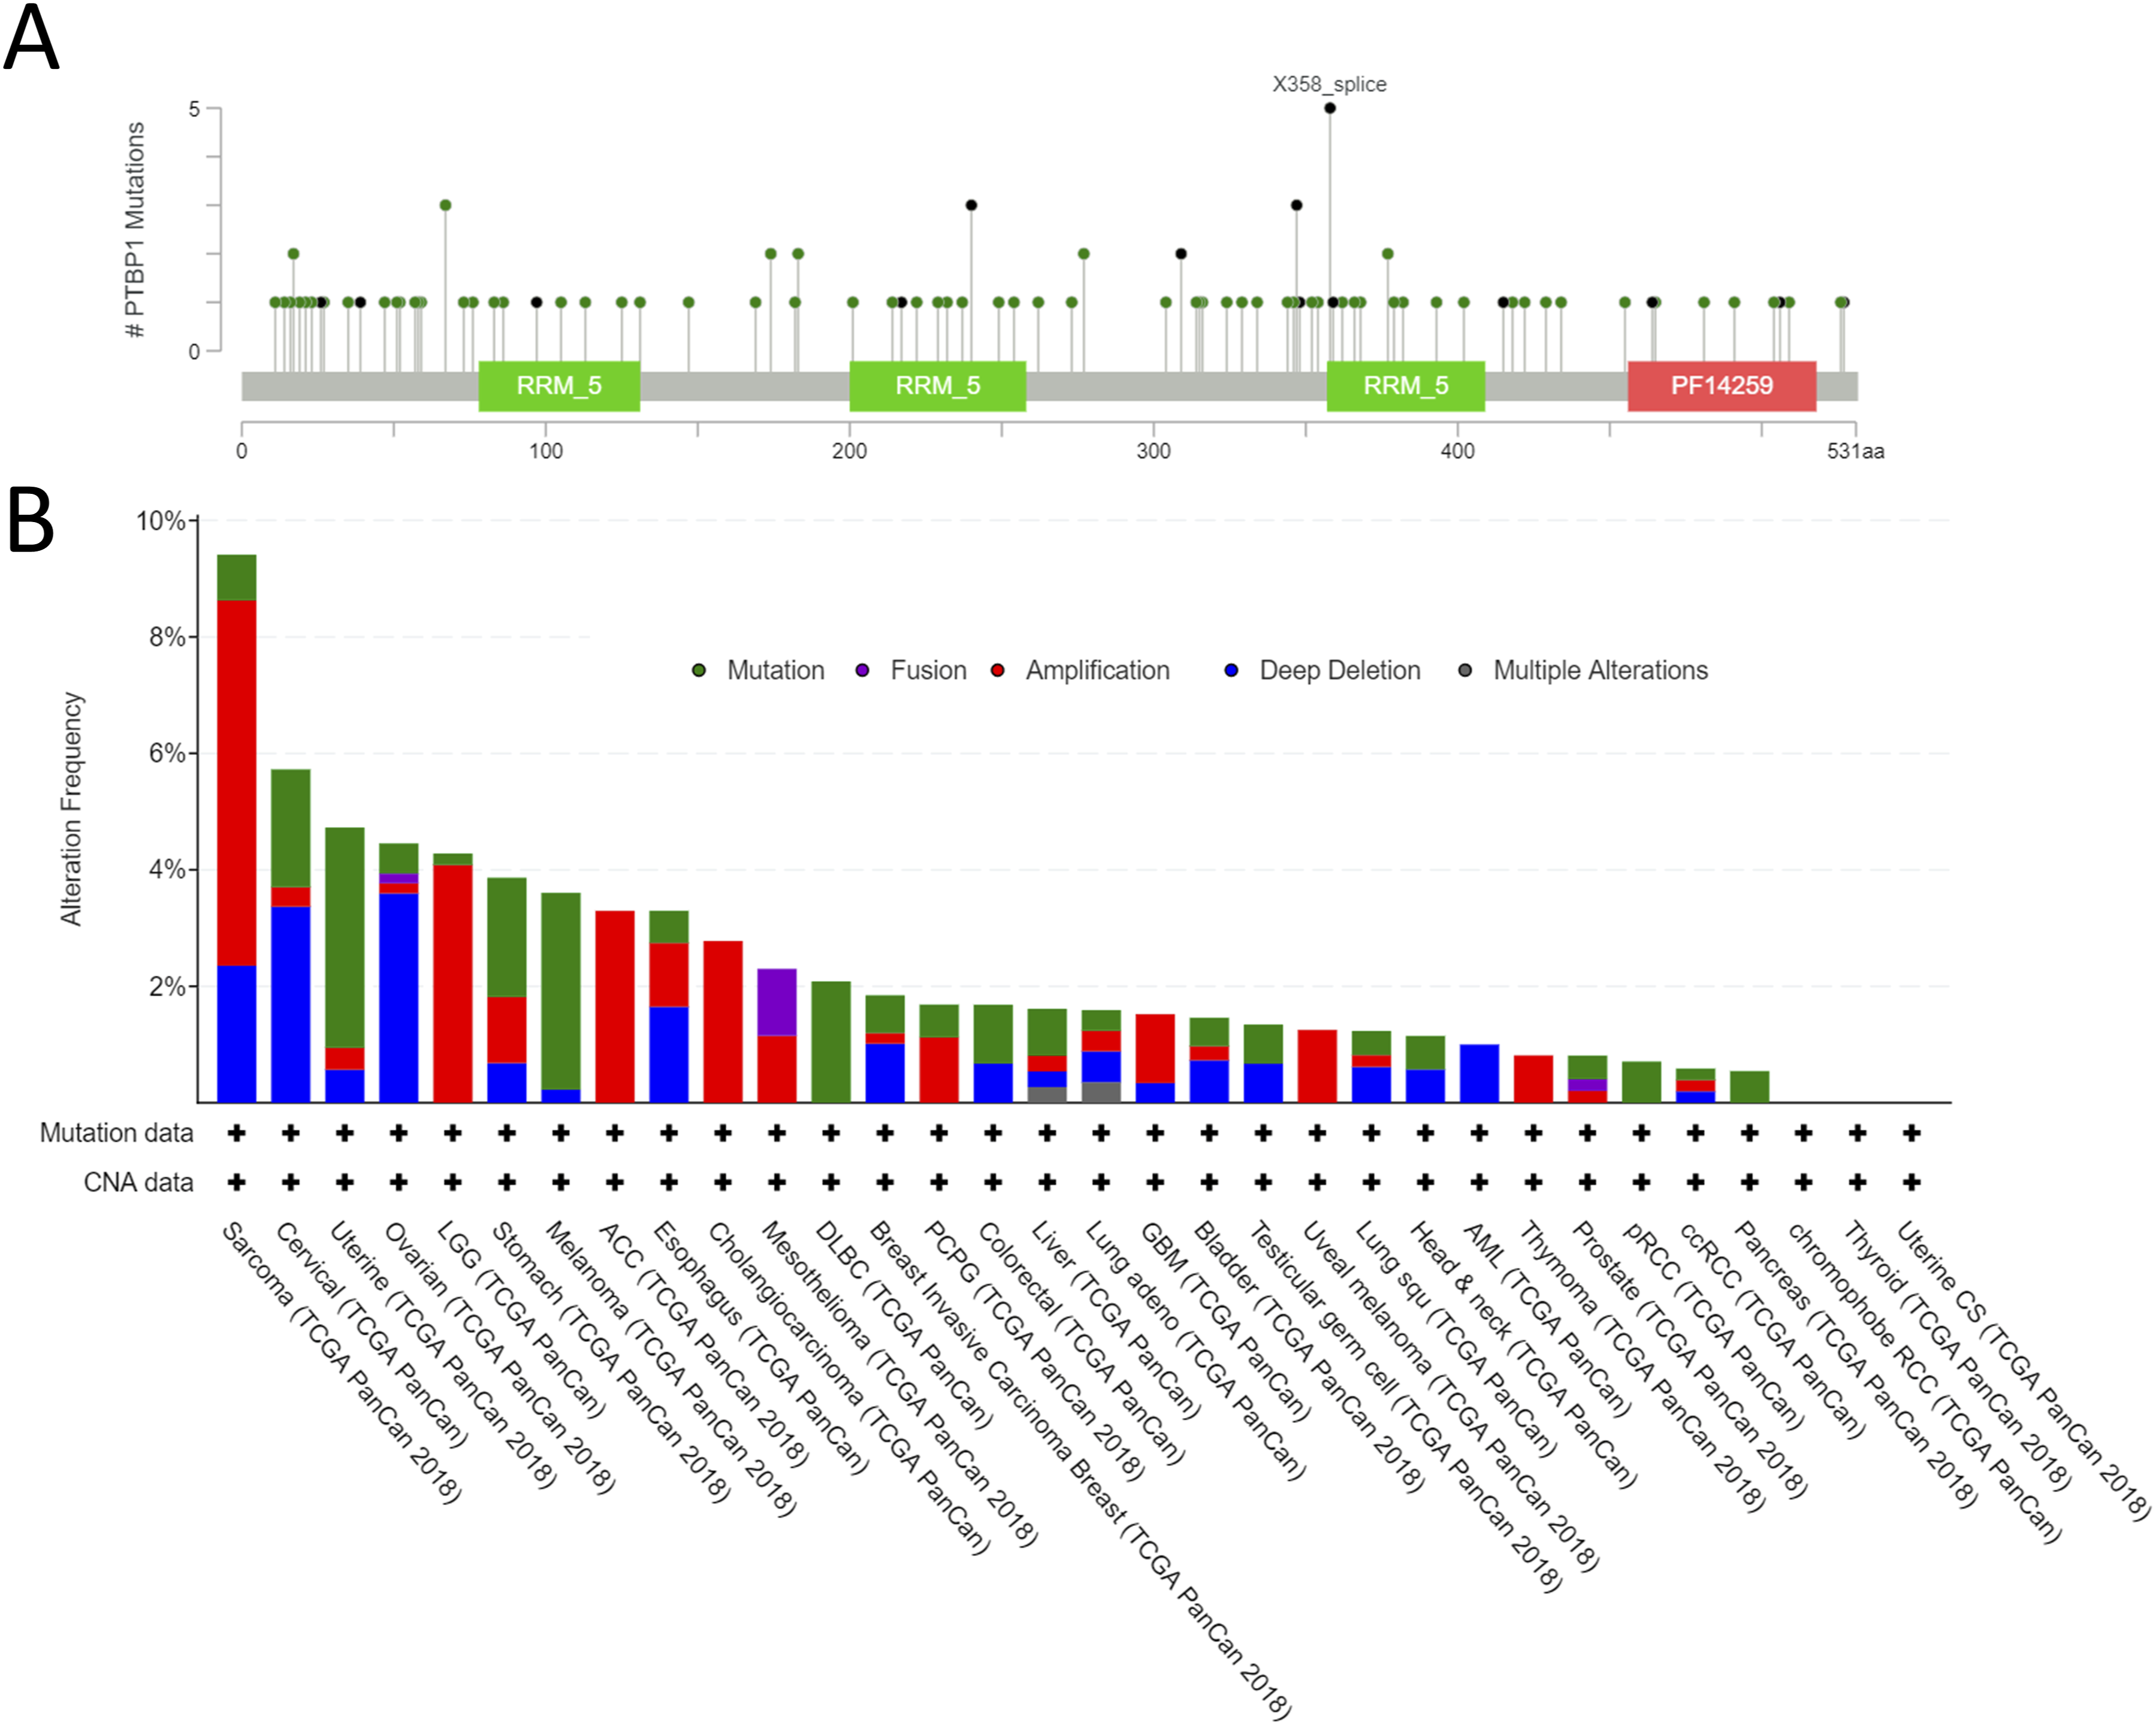
Correlation Analysis Between PTBP1 and Immune Infiltration
In order to further explore the function of PTBP1 in human pan-cancer, we investigated whether PTBP1 expression was correlated with immune infiltration levels using the TIMER database. As illustrated in Figure S4, PTBP1 expression was significantly positively correlated with tumor purity and Tregs cell in the tumors of KIRP, LGG, LIHC, and STAD. Still, there was a negative relationship for TGCT. We also observed significant differences between PTBP1 expression and the estimated infiltration value of cancer-associated fibroblasts in KIRP, LGG and TGCT.
Tumor-infiltrating immune cell subsets were reported to be associated with either better or worse prognosis in cancer. We found the higher the expression of PTBP1, the worse the prognosis in ACC, LGG and LUAD (Figure 3). Therefore, we examined whether PTBP1 expression was correlated with immune infiltration levels in ACC, LGG and LUAD data from TIMER. Correlation analysis revealed a statistically positive correlation between PTBP1 mRNA expression with tumor purity and neutrophil infiltration in ACC, LGG and LUAD (Figure 5). A negative correlation between PTBP1 mRNA expression and infiltration level of B cell, T cell CD8+ and T cell CD4+ was found in ACC, LGG and LUAD (Figure 5). Collectively, the above results indicated that PTBP1 expression may affect the prognosis of patients partially due to immune infiltration. The correlation between PTBP1 expression and immune infiltration level in ACC, LGG and LUAD. Correlation of PTBP1 expression with tumor purity and infiltrating levels of neutrophil, B cell, CD8+ T cell, CD4+ T cell, and dendritic cell and macrophage in ACC, LGG and LUAD. P < 0.05 is considered as statistically significant.
Enrichment Analysis of PTBP1-Related Partners
To start looking into the molecular mechanisms responsible for tumorigenesis of PTBP1, we used STRING, GEPIA2, and DAVID tools to estimate the pathway enrichment of PTBP1-related partners. We searched for a total of 50 potential proteins interacting with PTBP1 using the STRING database (Figure 6A). The GEPIA2 database, which includes TCGA and GTEx data, was used to assess the top 100 genes highly correlated with PTBP1 expression. Correlation analyses showed that the expression level of PTBP1 in TCGA tumors was positively correlated with some genes, such as DAZ-associated protein 1 (DAZAP1), recombinant lamin B2 (LMNB2), recombinant ELAV-like protein 1 (ELAVL1), ring finger and WD repeat domain3 (RFWD3) and pre-mRNA processing factor 40 homolog A (PRPF40 A) (R = 0.78, 0.69, 0.69, 0.68, 0.67, P < 0.001, Figure 6B). The heatmaps of correlation between PTBP1 gene and above 5 genes in multitudinous tumors also demonstrated the positive correlation (Figure 6C). There were 3 genes in the intersection analysis of 2 groups described above, namely ELAVL1, heterogeneous nuclear ribonucleoprotein (HNRNPL) and nucleolin (NCL) (Figure 6D). Protein-protein interaction (PPI) network and annotation analysis of the PTBP1-related genes. (A) PPI network; (B) Correlation between expression of PTBP1 and the top 5 PTBP1-correlated genes; (C) The corresponding heatmap data in different cancer types; (D) An intersection analysis of the PTBP1-binding and correlated genes. (E) GO enrichment analysis; (F) KEGG pathway analysis.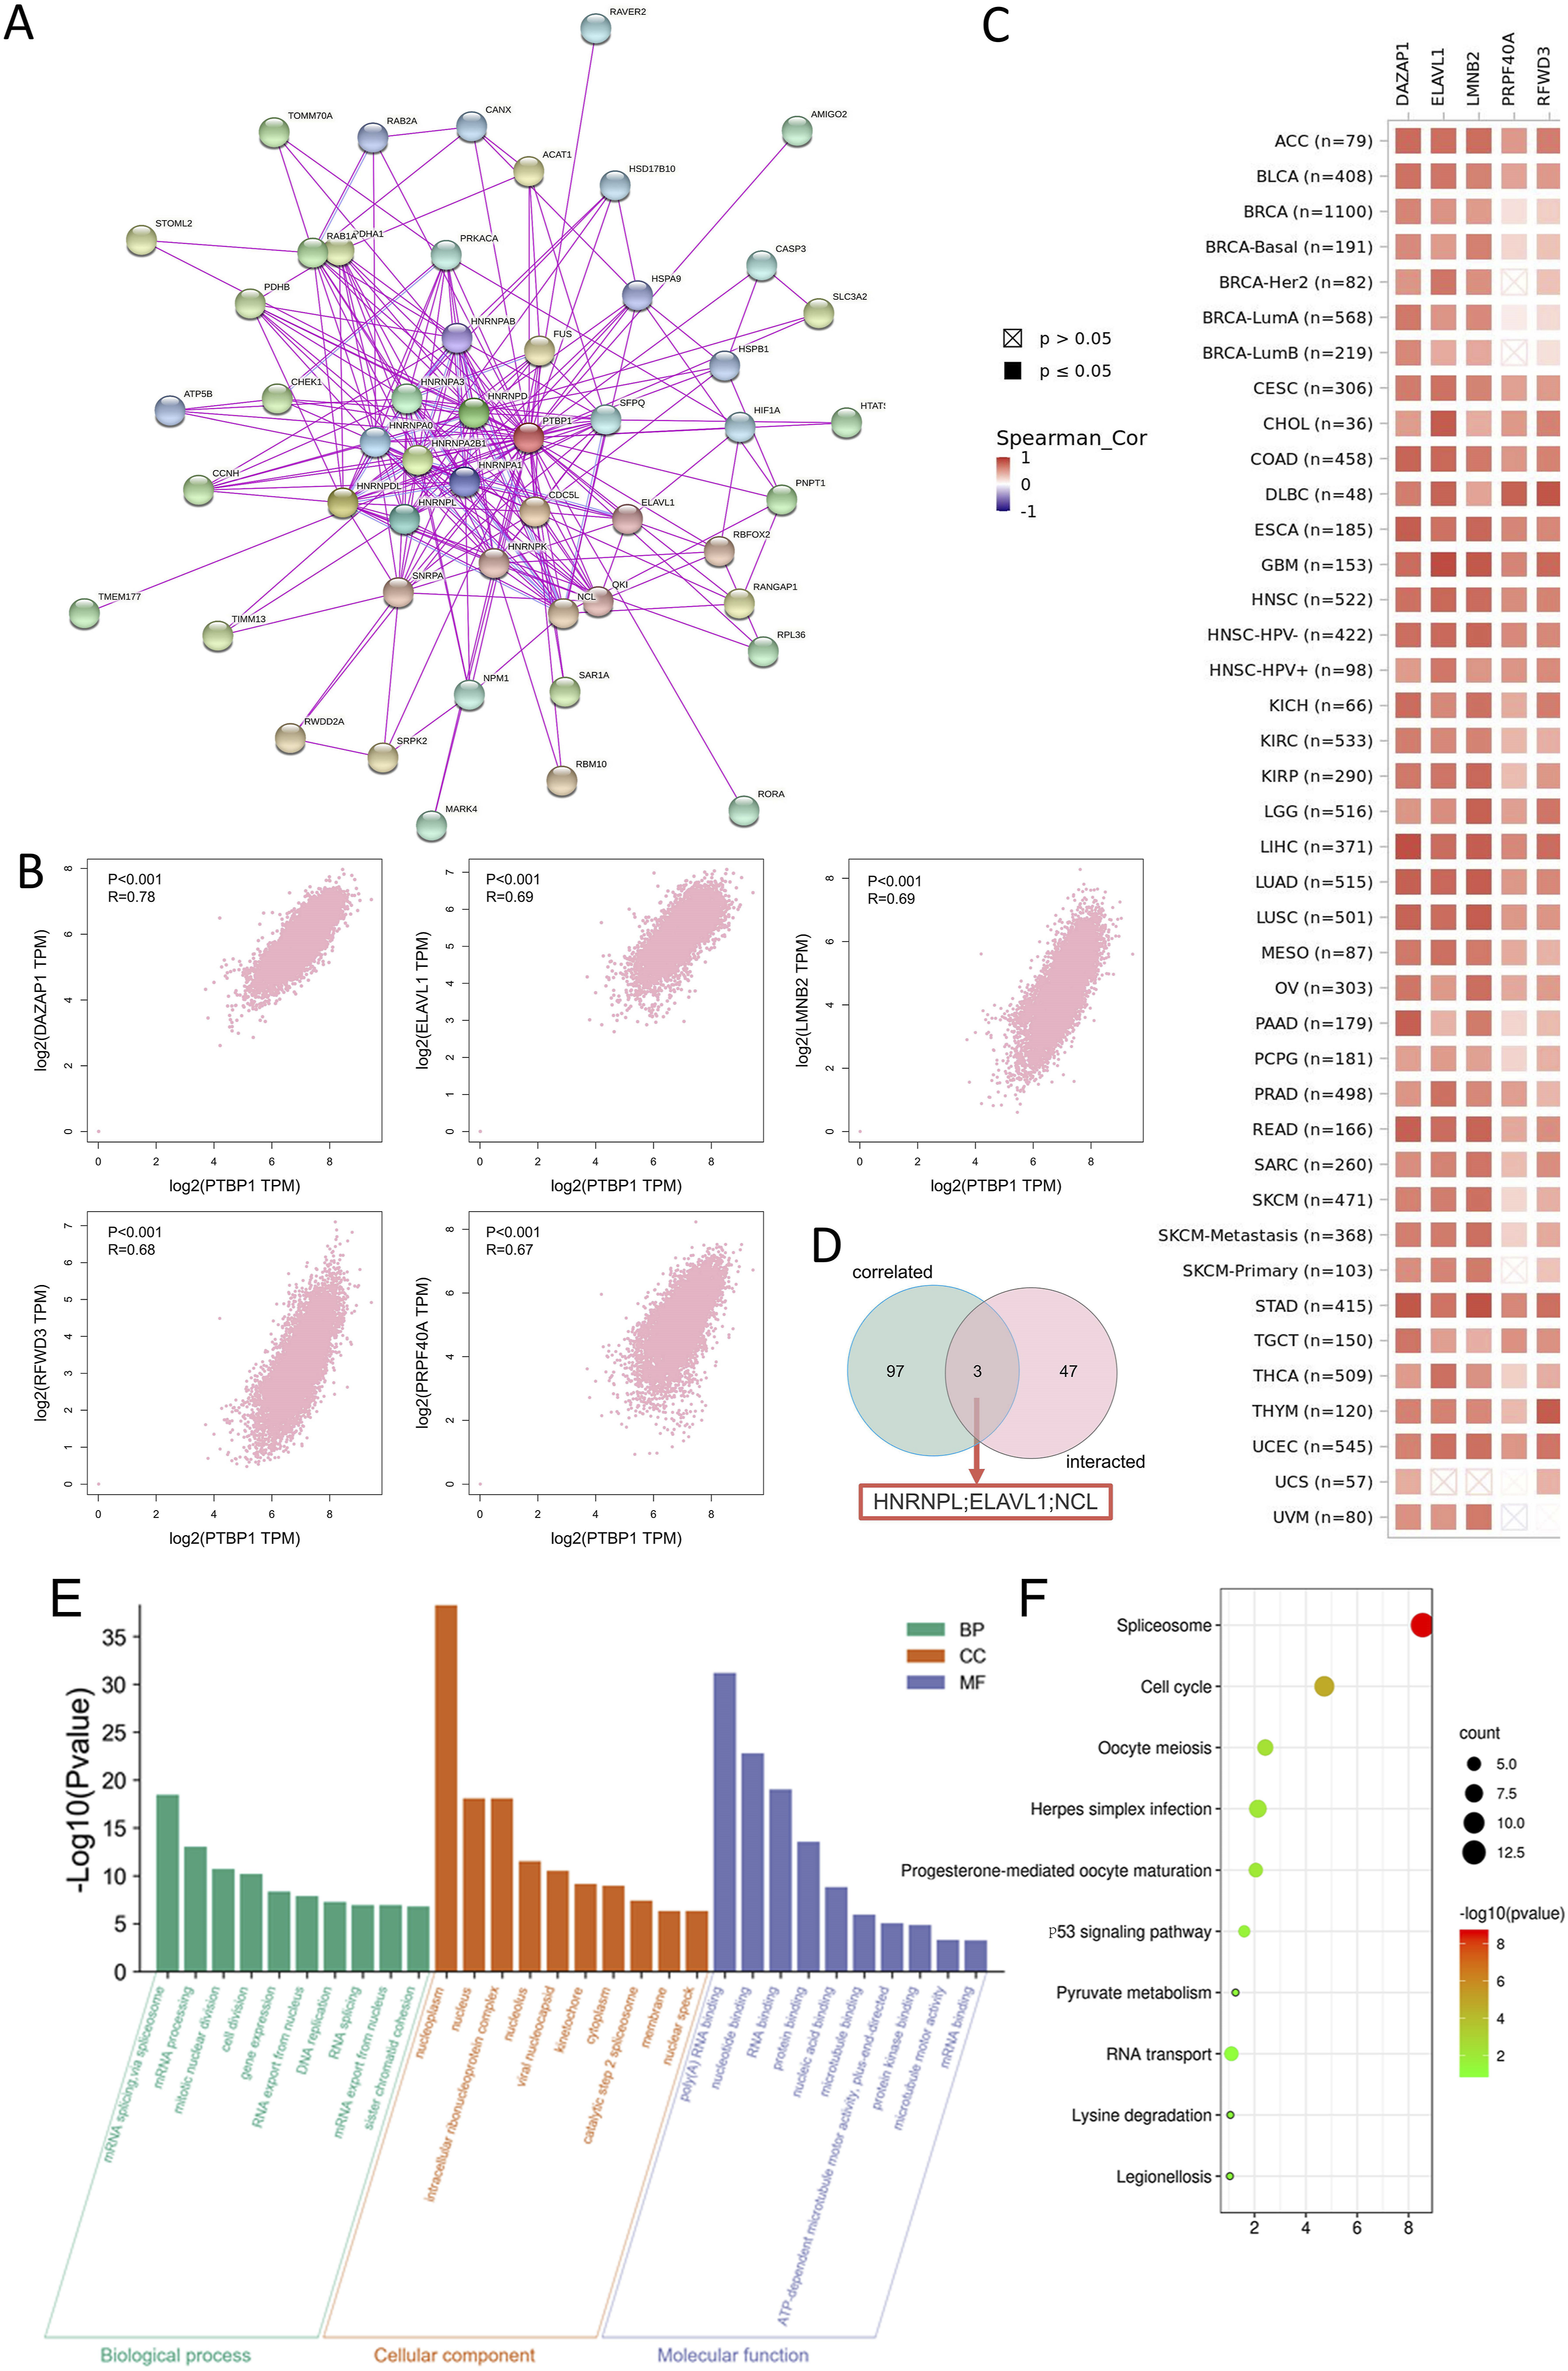
The 2 datasets were then combined, and KEGG and GO enrichment analysis were conducted using DAVID software. GO analysis of these genes revealed that most of these pathways were relevant to RNA metabolism, such as mRNA splicing via spliceosome, mRNA processing, RNA export from the nucleus, RNA binding and others (Figure 6E). PTBP1 was involved in pathways of spliceosome, cell cycle, p53 signaling pathway, pyruvate metabolism, RNA transport and lysine degradation among others (Figure 6F). Of note, PTBP1 was implicated in p53 signaling pathway and abnormal expression of PTBP1 might lead to the occurrence and progression of tumors.
Furthermore, we performed PTBP1-targeting miRNA prediction using TargetScan and ENCORI databases and then identified 3 miRNA candidates, miR-1-3p, miR-206 and miR-133b (Figure S5A). We also found that the expression of all 3 miRNAs was significantly negatively correlated with PTBP1 expression in LGG (Figure S5B). And some have reported that miR-133b binds to the 3′UTR of PTBP1 to repress its expression.26,27 Our results corroborated the findings of these studies.
Discussion
In recent years, PTBP1 has been identified as an important factor in multiple diseases. For example, Qian et al showed that mouse astrocytes were converted to functional dopaminergic neurons by depleting the RNA binding protein PTBP1, and then Parkinson’s disease-relevant motor phenotypes were reversed. 28 Importantly, PTBP1 is abnormal in a variety of human cancers. PTBP1 was up-regulated in hepatocellular carcinoma TCGA samples and cell lines and influenced hepatoma cell invasion and metastasis by regulating Axl exon 10 splicing. 29 PTBP1 has been shown to facilitate the proliferation, migration, and invasion of bladder cancer cells through alternative splicing-mediated upregulation of MEIS2-L and PKM2. 30 PTBP1 was overexpressed in renal cell carcinoma clinical tissues and significantly associated with tumor size, pathological metastasis status and 5-year overall and disease-specific survival. 31 PTBP1 has been reported as a regulator of aerobic glycolysis, associated with a poor outcome and resistance to chemotherapy in multiple myeloma patients. 32 Previous findings indicated that PTBP1 was associated with some cancers. However, we still do not know how PTBP1 is involved in pan-cancer.
In consideration of the important role of PTBP1 in some cancers, it is of great significance to study PTBP1 expression and regulation patterns in the pathogenesis of different tumors. To the best of our knowledge, there is no study on pan-cancer analysis for PTBP1 in Literature. In this study, we demonstrated gene expression, survival time, genetic alteration, immune infiltration, the related genes and miRNAs prediction, GO and KEGG pathway enrichment analysis of PTBP1 in pan-cancer by using different databases (including TCGA, CPTAC and GEO databases).
Recent publications have reported the associations between PTBP1 and clinical diseases, especially tumors (Table S1). Abnormal expression of PTBP1 was involved in sustaining the development of multiple myeloma. 32 From incidence of tumor relapse and survival perspective, high PTBP1 expression was correlated with worse clinical outcome in non–muscle-invasive bladder cancer. 33 Other researchers have reported the overexpression of PTBP1 in ovarian cancer, 34 breast cancer 35 and colon cancer. 36 In our study, we found that PTBP1 was highly expressed in most tumors (Figure 1(A) and (B), Figure S1), in agreement with those reported in the previous studies. Furthermore, we revealed the frequent amplification, immune infiltration and significant prognostic value of PTBP1 in pan-cancer, based on a comprehensive analysis of the data. We found a correlation between PTBP1 high expression and OS, DFS prognosis of several cancers, such as ACC, LGG and LUAD (Figure 3(A) and (B)). Therefore, PTBP1 abnormal expression can serve as a prognostic indicator of patients’ survival.
Another interesting finding in our study is that PTBP1 expression appears to correlate with immune infiltration. PTBP1 expression was significantly positively correlated with Tregs cell, B cell, T cell CD8+ and T cell CD4+ in LGG (Figure 5, Figure S4), which might help explain the differences in LGG patient survival by influencing immune infiltration in the tumor microenvironment. PTBP1, a regulator of alternative splicing, is involved in the regulation of many immune-related ligands and receptors, such as CD46, CD4, CD5, and IL-2.37-39 Also, others earlier reported that PTBP1 was essential for B cell selection and development.40,41 PTBP1 deletion in DCs has been shown to perturb T-cell homeostasis and enhance antitumour immunity. 42 The significant correlation between PTBP1 expression and immune infiltration raises the possibility that PTBP1 may be a potential biomarker that indirectly reflects tumorgenesis and development.
The association of Polypyrimidine tract-binding protein 1 (PTBP1) with cancer prognosis and immune cell infiltration presents profound clinical implications, underlining its role as a pivotal prognostic marker. PTBP1 overexpression is correlated with adverse outcomes, emphasizing its influence not only through intracellular molecular functions but also by modulating the tumor microenvironment. Specifically, PTBP1 significantly impacts the composition and functionality of tumor-infiltrating immune cells, which are crucial for tumor immune surveillance and the efficacy of therapeutic responses.
The expression of PTBP1 positively correlates with the infiltration levels of regulatory T cells (Tregs) and exhibits a negative correlation with effector immune cells, such as CD8+ T cells, across several cancers. Tregs are known to suppress anti-tumor immune responses, thereby promoting tumor growth. Elevated PTBP1 expression may facilitate an immune-suppressive environment, ultimately leading to poorer clinical outcomes. Conversely, a PTBP1-associated decrease in CD8+ T cell infiltration could compromise the effectiveness of the immune response against tumor cells, further worsening patient prognoses.
In addition, we integrated the information on PTBP-binding partners and PTBP1 expression-related genes across all tumors for functional enrichment analysis and pathway analysis. Indeed, in our settings, we can see the potential impact of “spliceosome”, “cell cycle”, “p53 signaling pathway”, and RNA metabolism in the occurrence and development of cancers (Figure 6(E) and (F)). PTBP1 influences the splicing of pyruvate kinase and alters glucose metabolism, maintaining breast cancer cell growth. 35 In cell lines and tissues derived from colon cancer, PTBP1 is overexpressed and subsequently promotes tumorigenesis via regulating apoptosis and cell cycle. 36 As the most commonly mutated pathway in tumorigenesis, the p53 pathway has been reported to mediate cellular stress responses, inducing cell-cycle arrest and apoptosis.43,44 TP53, as a pivotal gene, frequently mutated in diffuse gliomas and particularly in astrocytic tumors. PTBP1 stimulates the translation of p53 isoforms by binding to its internal ribosome entry site after DNA damage. 45 The progression and development of glioma are regulated by p53/ST7-AS1/PTBP1 positive feedback loop. 46 TP53 mutation and p53 are associated with clinical impact in LGG, and p53 pathway is disrupted in ∼80% of grade III and IV gliomas.47,48 These results indicate that the underlying mechanism in which PTBP1 functions might be an important target of p53 pathway and accelerate the progress of various cancers. Therefore, PTBP1 may regulate the p53 signaling pathway, cell cycle and splicing in the progress of various cancers.
RNA-binding proteins (RBPs) meticulously regulate the expression of multiple target genes by controlling various aspects of RNA metabolism, including splicing, transport, stability, and translation. These proteins play pivotal roles in several key biological processes involved in the oncogenesis and progression of tumors, such as cell cycle regulation, apoptosis, and epithelial-mesenchymal transition. Unlike traditional single-molecule biomarkers, RBPs can integrate information from multiple signaling pathways, providing a more comprehensive insight into cancer diagnosis, staging, and prognostic assessment. Notably, PTBP1’s role in RNA splicing opens up a new therapeutic target not addressed by most protein-focused traditional biomarkers. PTBP1’s function in modulating specific immune cell infiltration, particularly regulatory T cells (Tregs) and CD8+ T cells, adds extra prognostic value to existing biomarkers. Additionally, PTBP1’s critical involvement in RNA metabolism and the p53 signaling pathway, along with its extensive interactions with cancer-related genes and proteins, offers new perspectives for understanding cancer prognosis and addressing treatment resistance, thus filling some gaps left by current biomarkers.
Currently, several RBPs such as HuR,49,50 SRSF1,51,52 and CELF1 53 have been identified as potential tumor biomarkers. They exhibit aberrant expression in various types of tumors and are closely associated with patient prognosis and clinical features. Among these, PTBP1, as a pan-cancer-related RBP, is highly expressed in a range of solid and hematological tumors and is significantly associated with poor prognosis, making it a highly valuable potential biomarker for further research.
As a multi-functional RNA-binding protein, PTBP1 plays an important role in the development of various diseases, especially cancer. In the present study, the expression profile, gene alteration, association with prognosis and immune infiltration of PTBP1 in pan-cancer were systematically analyzed for the first time, laying the foundation for elucidating the role of PTBP1 in the pathogenesis of cancers and revealing that PTBP1 may become a potential biomarker for cancer diagnosis and prognosis. By comprehensively understanding the abnormal expression pattern of PTBP1 in tumor tissues and its impact on the prognosis of tumor patients, we can more accurately predict the clinical regression of patients and explore the individualized treatment strategies based on PTBP1.
Looking forward to the next 5 years, with the continuous progress of research technology and in-depth understanding of the mechanism of action of PTBP1, significant breakthroughs in the field of PTBP1 research are bound to be achieved. We can expect that future research will focus more on the cellular level, such as the use of single-cell sequencing technology to explore the expression and splicing regulation of PTBP1 in tumor cells, and to reveal the interaction between PTBP1 and the tumor immune microenvironment. In addition, with the increasing application of artificial intelligence, machine learning and other emerging technologies in the biomedical field, research methods based on big data and computational simulation will also be introduced into the study of PTBP1, which will provide a more valuable basis and strategy for individualized and precise treatment of cancer.
Prospects and Limits
PTBP1, an important RNA-binding protein, plays a critical role in a wide range of cancers. Our study reveals the expression pattern, genetic alterations, immune infiltration, associated genes and signaling pathways of PTBP1 in pan-cancer, which provides strong bioinformatic support for an in-depth understanding of the role of PTBP1 in cancer development and progression. The findings also justify PTBP1 as a potential therapeutic target and prognostic indicator.
PTBP1 can be used as a potential cancer biomarker to assess the prognosis and treatment response of cancer patients. It was found that the expression level of PTBP1 was significantly correlated with the survival time of some cancer patients, suggesting that PTBP1 may be an important prognostic factor. In addition, the expression level of PTBP1 was also associated with the immune infiltration of the tumor, reflecting the immune microenvironment and the state of immune escape. Therefore, PTBP1 can be used as a valuable immunoassay indicator to monitor the immune function and the effect of immunotherapy in cancer patients.
PTBP1 can also be used as a potential cancer therapeutic target for inhibiting the growth and metastasis of cancer cells. It has been found that PTBP1 affects the biological behavior of cancer cells by regulating splicing, metabolism, cell cycle, immunity, and other pathways to promote cancer development and progression. Therefore, PTBP1 can be used as an important therapeutic target. By interfering with the expression or function of PTBP1, the proliferation, migration and invasion of cancer cells can be inhibited, and the apoptosis and immune clearance of cancer cells can be enhanced, thus inhibiting the progression and metastasis of cancer.
PTBP1 can also be used as a basis for developing cancer therapeutic drugs to enhance the immunity and sensitivity of cancer patients. It was found that PTBP1 is an important immune regulator involved in the regulation of splicing of multiple immune-related ligands and receptors, which affects the activity and function of immune cells in the tumor microenvironment. Therefore, PTBP1 can be used as a promising immunotherapeutic agent, which can enhance the immunity and sensitivity of cancer patients and improve their quality and survival by modulating the activity or binding partners of PTBP1.
Although the present study covered several authoritative databases and used various bioinformatics analysis tools, there are still some areas that need to be improved: 1) PTBP1 may not be an ideal prognostic marker for all cancer subtypes; 2) the results of the bioinformatics analysis need to be further verified by in vivo and ex vivo experiments; 3) the specific molecular regulatory mechanisms involved in PTBP1 need to be explored in depth. Therefore, we need to carry out more experimental studies to verify and improve the existing findings.
Conclusions
In summary, PTBP1 is significantly correlated with prognosis and immune infiltration across cancers. qRT-PCR revealed significant upregulation of PTBP1 mRNA in LUAD, COAD, and SKCM cell lines, as well as melanoma-forming mouse models. Elevated PTBP1 expression correlates with increased Tregs infiltration and decreased CD8+ T cell presence, aligning with poorer survival outcomes. We also found that PTBP1 can regulate the p53 signaling pathway, cell cycle and splicing in a variety of cancer progressions among functional enrichment analysis and pathway analysis. PTBP1’s influence on RNA splicing and immune modulation positions it as a promising biomarker for cancer prognosis and a potential target for therapeutic interventions aimed at enhancing anti-tumor immunity.
Supplemental Material
Supplemental Material - Pan-Cancer Analysis of PTBP1 to Identify it as a Prognostic and Immunological Biomarker
Supplemental Material for Pan-Cancer Analysis of PTBP1 to Identify it as a Prognostic and Immunological Biomarker by Yan Zhao, Yanyang Wang, Qiuqiu Xia, He Huanhuan, Qiming Mao, Huaize Dong, Lu Zhu, Zongyue Hu, Jiyue Xia, Zijing Weng, Wenbo Liao, and Zhijun Xin in Cancer Control
Footnotes
Acknowledgments
We acknowledge the contributions from TCGA, CPTAC and GEO databases. The authors thank their supervisor Zhijun Xin for his help and support in writing the article and Hui Zong from Tongji University for his advice on bioinformatics.
Author Contributions
Y.Z. analyzed the data and wrote the manuscript. Y.W., Q.X., H.H., Q.M., H.D., L.Z., Z.H., J.X. and Z.W. designed the study. W.L. and Z. X. reviewed a draft of the paper and approved the final draft. All authors agree to take responsibility for the accuracy and completeness of all aspects of the study.
Declaration of Conflicting Interests
The author(s) declared no potential conflicts of interest with respect to the research, authorship, and/or publication of this article.
Funding
The author(s) disclosed receipt of the following financial support for the research, authorship, and/or publication of this article: This research was funded by the Doctoral Fund of Zunyi Medical University (Grant No. Yuan Zi [2022]-9), Guizhou Provincial Spinal Degenerative Diseases Minimally Invasive Treatment Basic Research and Clinical Application Science and Technology Innovation Talent Team (Qian Ke He Platform Talent -CXTD[2021]009), Collaborative Innovation Center of Chinese Ministry of Education (2020-39) and Graduate Research Fund of Zunyi Medical University (No. ZYK159).
Ethical Statement
Supplemental Material
Supplemental material for this article is available online.
References
Supplementary Material
Please find the following supplemental material available below.
For Open Access articles published under a Creative Commons License, all supplemental material carries the same license as the article it is associated with.
For non-Open Access articles published, all supplemental material carries a non-exclusive license, and permission requests for re-use of supplemental material or any part of supplemental material shall be sent directly to the copyright owner as specified in the copyright notice associated with the article.