
Abstract
Introduction
The role of SMU1 in DNA replication and RNA splicing is well-established, yet its specific function and dysregulated mechanisms in gastric cancer (GC) remain inadequately elucidated. This study seeks to investigate the potential oncogenic and progression-promoting effects of SMU1 in GC, with the ultimate goal of informing novel approaches for treatment and diagnosis.
Methods
The study investigated the expression levels of SMU1 in GC and adjacent normal tissues by analyzing data from the TCGA (27 tissue pairs) and GEO (47 tissue pairs) databases. Immunohistochemistry was used to examine 277 tumor tissue and adjacent non-tumor tissue spots from GC tissue chips, along with relevant follow-up information. The study further assessed the proliferation, invasion, and migration capabilities of cells by manipulating SMU1 expression levels and conducting various assays, including CCK-8, EdU incorporation, colony formation, transwells, flow cytometry, and subcutaneous tumorigenesis assays.
Results
Our study revealed a significant upregulation of SMU1 mRNA and protein levels in GC tissues compared to adjacent tissues. Univariate and multivariate Cox analysis demonstrated that elevated levels of SMU1 were independent prognostic factors for GC prognosis (P = 0.036). Additionally, median survival analysis indicated a significant association between high SMU1 expression and poor prognosis in GC patients (P = 0.0002). In experiments conducted both in vivo and in vitro, it was determined that elevated levels of SMU1 can enhance the proliferation, invasion, and migration of GC cells, whereas suppression of SMU1 can impede the progression of GC by modulating the G1/S checkpoint of the cell cycle.
Conclusions
Our research introduces the novel idea that SMU1 could serve as a prognostic marker for GC progression, influencing cell proliferation through cell cycle activation. These results offer valuable insights into the understanding, diagnosis, and management of gastric carcinoma.
Introduction
Gastric cancer (GC), a prevalent malignancy of the digestive system, ranks as the third leading cause of cancer-related mortality worldwide. 1 Tumorigenesis can arise from genetic mutations, environmental influences, or errors in DNA replication. 2 Research indicates that DNA replication errors account for a significant portion of mutations in human cancers. Notably, there exists a robust association between the incidence of cancer and the rate of normal stem cell division, with a median correlation coefficient of 0.80. 3 Several findings have confirmed that DNA replication regulator proteins can provide a basis for identifying new prognostic markers and potential therapeutic targets for GC.4,5
The SMU1 gene, situated on human chromosome 9p21.1, is highly conserved across eukaryotic species and encodes a protein with a WD40 domain, placing it within the WD40-repeat protein family. SMU1 is involved in various cellular processes such as signal transduction, pre-mRNA processing, and cytoskeleton assembly modulation through its receptor/regulator module. The WD40 repeats in SMU1 typically consist of 7 repeats, each forming a closed-loop propeller structure that facilitates protein-protein interactions regulation. SMU1 is a crucial regulator in the processes of DNA replication and RNA alternative splicing, as evidenced by its ability to encode a trans-acting factor that modulates the alternative splicing of pre-mRNA in genes such as unc-52 in Caenorhabditis elegans. 6 Additionally, prior research has highlighted the roles of human spliceosome factors, including SMU1 and RED, in facilitating spliceosome activation and serving as both alternative splicing regulators and general splicing factors in the removal of short introns. 7 The spliceosomal factors implicated in the regulation of NS2/NEP expression, derived from the splicing of NS1 and M1 mRNAs, are essential for the effective replication of influenza A virus. 8 Kanno’s research demonstrated that splice-related proteins, SMU1 and CWC16, have a significant impact on the transcription of green fluorescent protein, indicating their influence on pre-mRNA splicing site selection and splicing pattern regulation in plant systems. 8 Additionally, prior studies have highlighted the recruitment and protein scaffold role of SMU1 in this contextShah et al demonstrated that the CRL7/SMU1/E3 ligase complex facilitates the ubiquitination of H2B to ensure the cohesion of sister chromatids during mitosis. Their study confirmed the composition of the complex, consisting of SMU1, DDB1, CUL7, and RNF40, with SMU1 serving as a substrate recognition component that binds to H2B and catalyzes the mono-ubiquitination of lysine (K) residue K120 on H2B, a crucial process for mitotic progression. 9 Additionally, Sugaya et al identified SMU1 as a key player in various cellular processes such as DNA replication, cdc2 kinase activation, spindle assembly, and maintenance of chromosome integrity. 10 In the context of the temperature-sensitive CHO-K1 mutant cell line, the deficiency of SMU1 was observed to lead to aberrant splicing, heightened chromosome breakage, diminished DNA synthesis, and accumulation of single-stranded DNA. 11 Furthermore, it was determined that SMU1 played a significant role in impeding DNA synthesis and exerting control over DNA replication, with the loss of this regulatory function resulting in compromised genomic stability. 12 Noteworthy is the substantial enrichment of endogenous SMU1 within the chromatin, indicating its pivotal involvement in cellular proliferation. Cai et al. conducted a screening of aberrantly expressed genes in ovarian cancer (OC), identifying SMU1 as a gene closely associated with OC progression and serving as an independent prognostic marker for OC. 13 Despite this, the specific function of SMU1 in gastric cancers (GCs) has yet to be elucidated.
This study presents novel insights into the role and clinical relevance of SMU1 in GC, with in vitro and in vivo findings suggesting potential for the development of targeted therapeutic interventions aimed at SMU1 for the management and treatment of GC.
Materials and Methods
Cell Culture and Tissue Microarray
Human GC wild type cells and recombinant lentivirus-infected cell (SGC7901-OE) were purchased from GeneChem (Shanghai, China). The recombinant lentivirus-infected cells were cultured in RPMI-1640 (GIBCO) medium supplemented with 10% fetal bovine serum (GIBCO) and 5 μg/mL puromycin at 37°C with 5% CO2. Four GC tissue chips, including 277 tumor tissue spots and 277 adjacent non-tumor tissue spots with the relevant follow-up information, were purchased from Shanghai Core Biotechnology Co, Ltd (Shanghai, China). All patients with primary tumor were approved by the Shanghai Outdo Biotech Company Ethics Committee (YB M-05-02). The surgical time of patients was between July 2006 and April 2007. Tumor staging classification was based on the American Joint Committee on Cancer (AJCC), eighth edition. All cases had been followed up annually and the last date of follow-up was July 2015.
Quantitative Reverse Transcription-Polymerase Chain Reaction (qRT-PCR)
Total RNA was extracted using the Takara Mini Best Universal Extraction Kit (Takara) and reverse transcribed using Prime Script™ RT Master Mix (Takara). For qRT-PCR, aliquots of double-stranded cDNA were amplified using SYBR Premix Ex Taq II (Tli RNaseH Plus; Takara) and melting curves were analyzed. All primers were synthesized by Takara. (45 cycles): 95°C for 15 s, 63°C for 15 s, and 72°C for 15 s were the reaction conditions. Ct values were determined during the exponential amplification phase of qRT-PCR, and the amplification curves were analyzed using SDS 1.9.1 software (Applied Biosystems). An expression of GAPDH was calculated using the 2−△△Ct method as a reference [14]. The primer sequences used for RT-PCR analysis are presented in Supplemental Table 1.
Western Blot (WB)
We extracted total protein from the cells with RIPA lysis buffer (Beyotime) with 1 mM phenylmethanesulfonyl fluoride. Proteins were separated by sodium dodecyl sulfate-polyacrylamide gel electrophoresis and transferred to polyvinylidene fluoride membranes. For 2 days, membranes were blocked with milk at room temperature for 1 hour and incubated overnight with SMU1 (1:500, Novus 88522) and β-actin (1:5000, Sigma-Aldrich A5441). Following 3 washes with TBST (150 mM NaCl, 120 mM Tris-HCl pH 7.4, and 0.05% Tween 20) the membranes were incubated with horseradish peroxidase-conjugated secondary antibodies (1:5000, Invitrogen 31460; 1:5000, Pierce 31430) diluted in TBST. Finally, the protein expressed by a specific target gene was detected with the Immobilon™ Western Chemiluminescent HRP Substrate (Millipore).
Immunohistochemistry (IHC)
The subcutaneous tumor tissue specimens fixed in 4% paraformaldehyde were cut into 3 5-μm consecutive sections. Sections were deparaffinized and dehydrated with serial passage through changes of xylenes and graded ethanol. All the microarrays were subjected to an epitope retrieval procedure (0.01 M citrate buffer, pH 6.0) of 10 min boiling to reverse the loss of antigenicity that occurs with some epitopes in paraffin-embedded tissues. Endogenous tissue peroxidase was blocked by slide incubation in 3% hydrogen peroxide solution for 15 min at room temperature prior to incubation with blocking serum for 30 min at room temperature. Subsequently, the microarrays were incubated with primary antibodies (anti-SMU1, 1:200; Novus nbp-88522; anti-proliferating cell nuclear antigen (PCNA), 1:200; Sigma-Aldrich CBL407) overnight at 4°C. Goat anti-mouse/rabbit secondary antibody and HRP-labeled biotin were used to bind the primary antibody. Antigen-antibody binding was visualized via application of 3.3′ diaminobenzidine chromogen. All reagents were obtained from the Zhongshan Goldenbridge Immunohistochemical Kit (Zhongshan Goldenbridge Biotechnology Co Ltd).
Three independent pathologists analyzed digital images of SMU1-stained sections using a digital slide scanner (3DHISTECH, Budapest, Hungary). Computer-assisted scoring of SMU1 expression (3DHISTECH, QuantCenter software, Budapest, Hungary) was then performed. Three pathologists examined slides to determine the percentage of SMU1 staining in tumor cells. QuantCenter software was used to quantify the intensity of SMU1 cells, categorizing them as weak, median, or strong positivity based on intensity scores. The “H-score” was calculated by summing the product of the percentage of positive cells in each intensity category and the corresponding staining intensity. The background value from the isotype control was subtracted from the SMU1-stained section. 15 Positive patients had SMU1 expression in cancer tissues twice as high as in adjacent tissues, while the rest were considered negative patients.
RNA Interference Assay
Lentiviral vectors containing short hairpin RNA (shRNA) sequences were chemically synthesized using the GV493 vector and designated LV - shSMU1 and LV- shNC by Genechem (Genechem Co, Shanghai, China). LV-shNC was defined as an empty vector, and shRNAs (shRNA #1, #2, and #3) were used to knockdown SMU1 in the SGC7901 cells. All the shRNA sequences are listed in Supplemental Table 2.
CCK-8 Assay
For the CCK-8 assay, cells were seeded into 96-well plates at a density of 2 × 10³ cells in 100 μL of complete medium per well. The CCK-8 solution, from a commercial cell counting kit (Dojindo, Kumamoto, Japan) was added to 96-well plates at a 1:10 dilution with serum-free RPMI 1640 for 2 h at each time point. Cell proliferation was measured at 0, 24, 48, and 72 h. The absorbance of each well was automatically measured at 450 nm using a microplate reader (Tecan Group Ltd, Zürich, Switzerland).
In Vitro Migration and Invasion Assays
Migration and invasion abilities were measured in 24-well Transwells (8 μm pore size, BD Biosciences, San Jose, CA, USA). In the Transwell migration experiment, cells (5 × 10⁴) starved for 12 h in serum-free culture were seeded in the top chamber and lined with an uncoated membrane. In invasion assay, the chamber inserts were coated with 200 mg/mL Matrigel. Then, 1 × 10⁵ cells starved for 12 h in serum-free culture were plated in the upper chamber, and the number of cells invading and migrating to the lower layer with 10% fetal bovine serum was counted under a microscope after 48 h. Each experimental group consisted of 3 replicates.
Flow Cytometry
After cells starved for 24 h were harvested, they were washed 3 times with cold phosphate-buffered saline buffer and fixed overnight at 4°C with cold 75% ethanol. Propidium iodide (BD Biosciences) was added to a final concentration of 50 μg/mL to stain the DNA, and RNase A was added to a final concentration of 100 μg/mL to digest the RNA, followed by incubation in the dark at 4°C for 30 min. Flow cytometry was used for detection using the standard procedure of Coulter Epics XL (Beckman-Coulter, USA). Generally, 2 × 10⁴ – 3 × 10⁴ cells were counted. The results were analyzed using the cell cycle fitting software ModFit (Verity Software House).
5-Ethynyl-2′-Deoxyuridine (EdU) Assay
2 × 10⁴ SGC7901 cells were seeded into 24-well plates, cultured overnight, and cell proliferation was detected using an EdU assay kit (Beyotime). EdU-488 was detected by a cell imaging multi-mode reader (Cytation 1, BioTek) after 2 h incubation with 10 μM EdU.
In Vivo Tumor Growth in the Xenograft Model
A total of 24 BALB/c nude male mice (6 weeks old) were maintained and propagated in a controlled environment with specific pathogen-free conditions, including standard temperature and lighting cycles, as well as ad libitum access to food and water. All procedures involving the mice adhered to the guidelines outlined in the National Institute of Health’s Guide for the Care and Use of Laboratory Animals, and were approved by the Institutional Animal Care and Use Committee of the National Center for Translational Medicine at the Fourth Military Medical University (Approval ID: 2023-NTSCMM-ID007). In the in vivo proliferation assays, 1 × 10⁶ cells (including SGC7901-OE, SGC7901-NC, SGC7901-shRNA3, and SGC7901-shNC) were suspended in 200 μL of Matrigel (Corning Costar Corp., USA) and subsequently injected subcutaneously into the upper right flank region of nude mice, with the SGC7901-NC and SGC7901-shNC groups designated as the control. There were 6 mice in each group randomly. After 6 weeks, the mice were sacrificed by dislocation of the spine, and the subcutaneous tumors were measured and weighed. Considering the requirement of tumor size (formula: 1/2ab2) in animal ethics, we sacrificed the OE group mice 20 days in advance. The samples were used for immunohistochemical staining and histological examination (hematoxylin and eosin staining). All animal experimental protocols were adhered to the ‘Guide for the Care and Use of Laboratory Animals, eighth Edition. 16 The reporting of this study conforms to ARRIVE 2.0 guidelines. 17
Bioinformatics Analysis
Human Stomach adenocarcinoma and Para-cancerous tissue RNA-sequencing data were downloaded from the TCGA database (https://www.cancer.gov/ccg/research/genome-sequencing/tcga) and GEO database (GSE130823). “DESeq2” package was used to calculate differentially expressed genes between STAD and para-carcinoma with a |fold change| > 8. We assessed the differential expression of SMU1 between cancerous and adjacent tissues using a paired t test, with a P-value <0.05 considered statistically significant. In 373 human stomach adenocarcinomas (STAD), we defined samples with expression below the 25th percentile as low expression and samples with expression above the 75th percentile as high expression. Genes with a |fold change| > 1.5 were defined as differentially expressed using the “DESeq2” R package. Heatmaps was generated using R 4.3.1. GSEA was used to identify differential pathways, with |NES| > 1 and FDR <0.25 or P < 0.05 considered statistically significant. CPTAC (https://pdc.cancer.gov/pdc/) provided proteomic data of Human Early-Onset Gastric Cancer (normalized log2 ratio). A Pearson correlation analysis was performed on 130 samples to investigate the correlation between SMU1 and PCNA protein expressions.
Statistical Analysis
SPSS 19.0 software (SPSS Company, Chicago, USA) and Graph pad 8.0 were used for statistical analysis and making figures. The chi-squared test was used to evaluate the correlation between SMU1 expression and the clinicopathological parameters of GC patients. The Kaplan-Meier method was used to analyze the overall survival (OS) rate, a log-rank test was used for comparison, and a Cox regression analysis was used to evaluate the significance of survival variables. Differences were compared using a two-tailed t test and one-way ANOVA as indicated in the figure legends. P < 0.05 was regarded as statistically significant.
Results
Elevated Expression of SMU1 Indicates a Poor Prognosis for Patients with GC
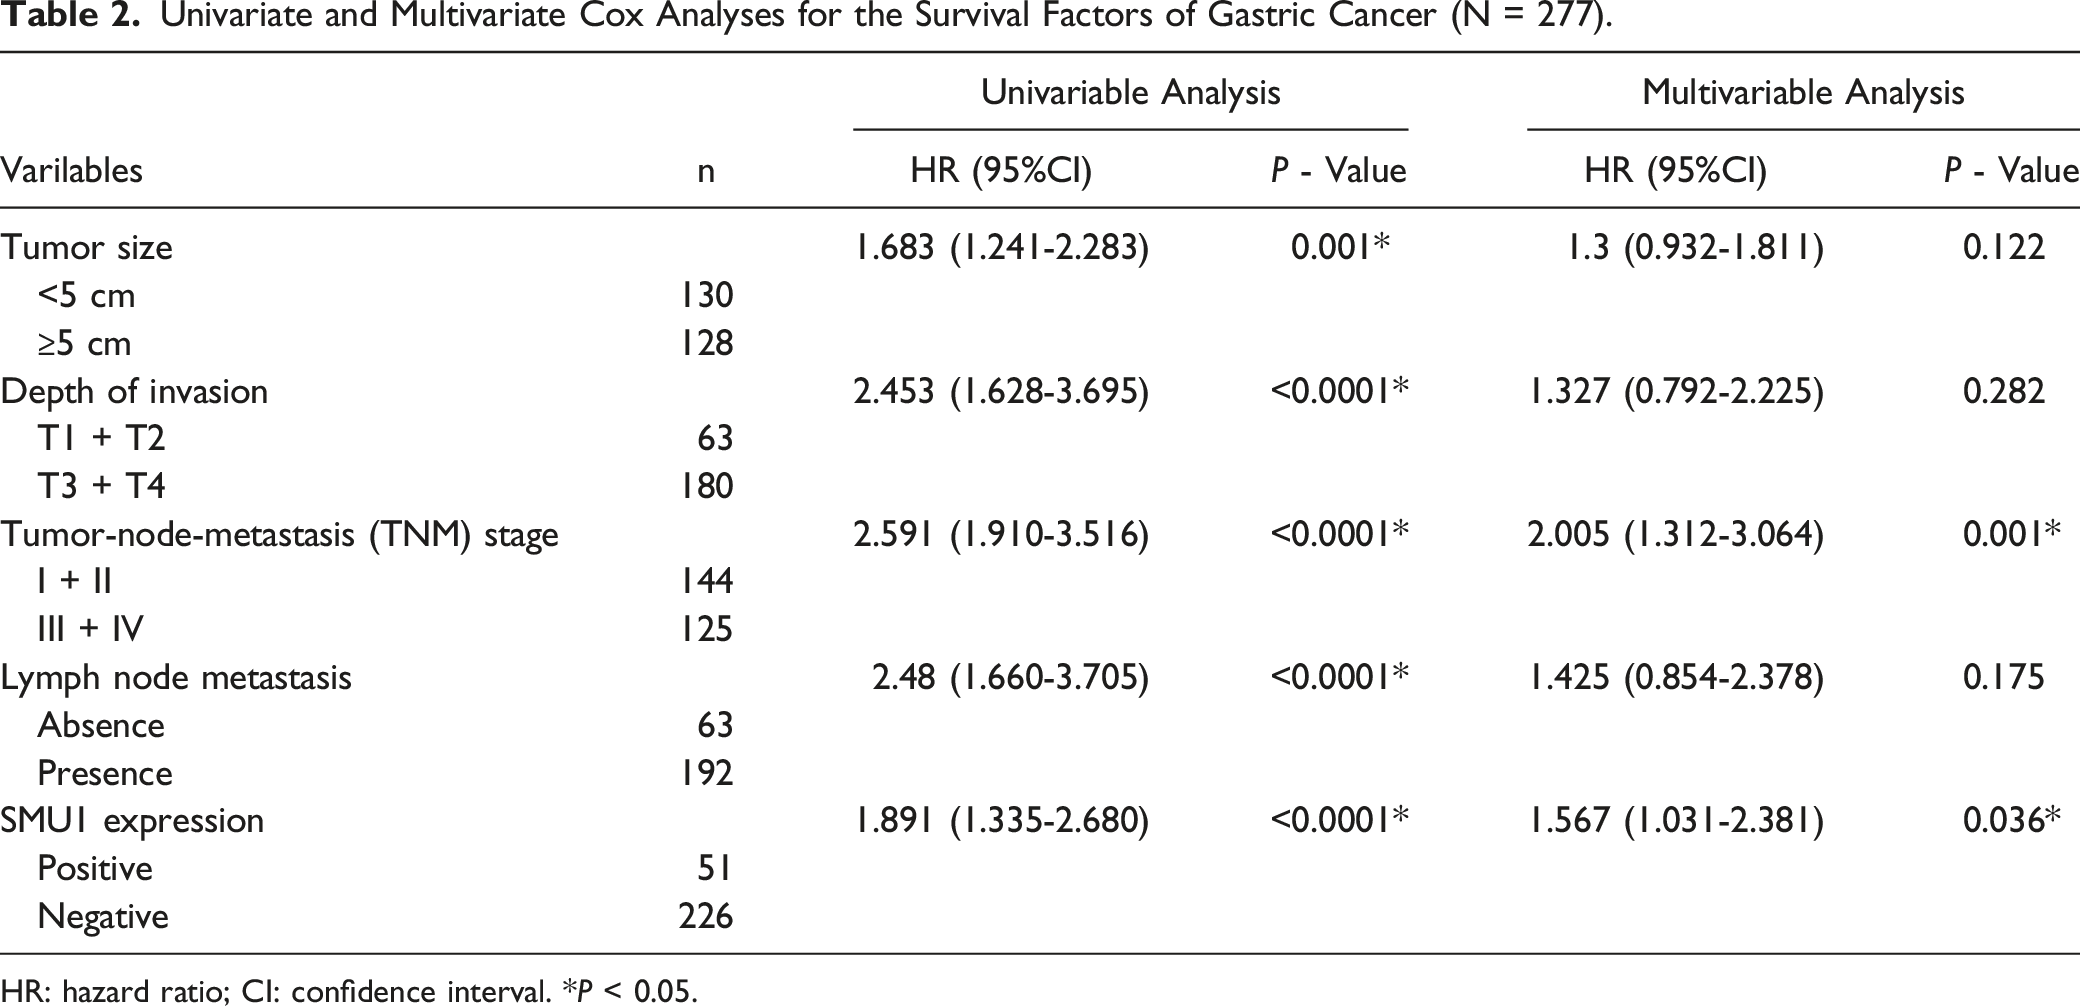
To study the differential expression of SMU1 in GC and adjacent tissues, we utilized the TCGA and GEO dataset GSE130823. The results revealed that SMU1 expression levels were significantly elevated in tumor tissues relative to adjacent normal tissues (P = 0.0332, P = 0.0009, Figure 1(A) and (B)). In addition, IHC staining score demonstrated that SMU1 expression was significantly higher than that of the adjacent tissues (P < 0.0001, Figure 1(C) and (D)), and was mainly stained in the cytoplasm and the nucleus in tissue microarrays (Figure 1(C)). We found a significant difference between SMU1 expression and tumor size (P = 0.003) and depth of invasion (P = 0.014; Table 1). Furthermore, Univariate and Multivariate Cox regression analyses were used to investigate whether SMU1 expression affected the prognosis of patients with GC. Univariate Cox regression analysis showed that the differential expression of SMU1 (P < 0.0001), tumor size (P = 0.001), depth of invasion (P < 0.0001), tumor-node-metastasis stage (P < 0.0001), and lymph node metastasis (P < 0.0001) had statistical significance in survival (Table 2). In the subsequent Multivariate Cox regression analysis, only high SMU1 expression (P = 0.036) and tumor-node-metastasis stage III, IV (P = 0.001) were independent risk factors for GC prognosis (Table 2). Median survival analysis showed that the median OS time of 51 patients with high SMU1 expression was significantly shorter than that of 226 patients with low SMU1 expression (P = 0.0002, Figure 1(E)). To investigate the impact of differential expression of SMU1 on the progression of gastric cancer, we divided the gastric cancer population in the database into 2 groups: high expression and low expression of SMU1, and enriched them with GSEA (Figure 1(F) and (G)). Additionally, the GO terms including Cell cycle checkpoint, DNA replication, DNA Helicase activity, G1/S transition of mitotic cell cycle, etc. Were highly enriched in the high-expression group (Figure 1(G)). Altogether, these results indicate that elevated expression of SMU1 indicates a poor prognosis for patients with GC and could be regarded as an independent prognostic factor in GC patients. Elevated expression of SMU1 indicates a poor prognosis for patients with gastric cancer. (GC) (A) Expression patterns of SMU1 in 27 STAD as well as adjacent normal tissues according to TCGA datasets (P = 0.0332, paired t test). (B) Expression patterns of SMU1 in 47 GC as well as adjacent tissues according to GEO datasets (P = 0.0009, paired t test). (C) Representative immunohistochemistry (IHC) staining of SMU1 expression in GC and adjacent non-tumor tissues (Scale bar: 200 μm; 20 μm). (D) Score for IHC staining of SMU1 between tumor and adjacent non-tumor tissues (n = 277, P < 0.0001) quantified by QuantCenter software. (E) Survival curve for 277 GC patients according to the expression of SMU1 (P = 0.0002, log-rank test). Overall survival of all patients with GC: low expression, n = 226; high expression, n = 51. (F) Heatmap of SMU-high vs SMU1-low. (G) Gene Set Enrichment Analysis (GSEA) of SMU1. Relationships Between WD40-Repeat Protein SMU1 Expression and Clinicopathological Variables of GC. HR: hazard ratio; CI: confidence interval. *P < 0.05. Univariate and Multivariate Cox Analyses for the Survival Factors of Gastric Cancer (N = 277). HR: hazard ratio; CI: confidence interval. *P < 0.05.

SMU1 Promotes GC Cell Proliferation, Migration, and Invasion in Vitro
To further explore the biological function of SMU1, we measured the mRNA expression of SMU1 in 7 GC cell lines and gastric mucosal epithelial cell line. It was found that SMU1 was expressed most in HGC-27, followed by MKN-28, MKN-45, SGC7901 and AGS. The lowest expression was detected in SNU1 (F = 8.903, P = 0.0002, Figure 2(A), Supplemental Tables 4 and 5). Due to the uncertainty of MKN28 and MKN45 in the STR (Short Tandem Repeat) identification process, we excluded them. However, the protein level of SMU1 was expressed most in SGC7901, followed by AGS and HGC-27 in five GC cell lines (Figure 2(B) and (C). To effectively regulate the expression of SMU1, we transfected lentiviral vectors into SGC7901 and AGS, and measured the expression level of SMU1 by WB. WB was used to evaluate the gene-silencing efficiency of 3 shRNAs targeting SMU1-NC, SMU1-shRNA1, shRNA2, and shRNA3 (Figure 2(D)). We found that SGC7901-shRNA3 was the most effective choice in subsequent experiments (P = 0.0497, Figure 2(E)). Compared to that in the control lentivirus vector (SGC7901-NC, AGS-NC), the expression of SMU1 in SGC7901-OE and AGS-OE was increased (Figure 2(F)). As the results of AGS-shRNA3 lentivirus transfection were not satisfactory, AGS cell line was not used in subsequent cell proliferation experiments. A colony formation assay indicated that upregulation of SMU1 expression significantly increased colony formation and the number of colony cells (P < 0.0001, Figure 2(G) and (H), and decreased SMU1 levels caused a reduction in colony formation and the number of colony cells (P = 0.0025, Figure 2(G) and (H). CCK-8 assay showed that SMU1 overexpression significantly increased GC cell proliferation (Figure 2(I)), which was consistent with the results of the colony formation assay. In addition, SMU1 overexpression increased the migration and invasion of SGC7901-OE cells (P < 0.0001, P = 0.001, Figure 2(J) and (K)), whereas knockdown SMU1 reduced the migration and invasion of SGC7901-shRNA3 (P = 0.0011, P = 0.0023, Figure 2(J) and (K)). Taken together, these findings suggest that SMU1 functions as an oncogene to promote GC cell proliferation, migration, and invasion in vitro. SMU1 promotes GC cell proliferation, migration, and invasion in vitro. (A) Relative mRNA expression level of SMU1 in indicated cells by quantitative reverse transcription-polymerase chain reaction (qRT-PCR). Quantification of relative mRNA level with one-way ANOVA. (B) Western blotting analysis of SMU1 expression in indicated cells. (C) Quantification of relative SMU1 level. (D) Western blotting analysis of SMU1 silencing after transfecting shRNA-1, shRNA-2, shRNA-3 and shRNA-NC in SGC7901. (E) Quantification of relative SMU1 level. (F) Western blotting analysis of SMU1 expression after transfecting lentivirus-OE and shRNA-3 in SGC7901 and AGS, respectively. (G) Effects of SMU1 on human GC cell colony formation. (H) Graph shows the average number of proliferating cells per field. Cell counts were quantified by selecting the corresponding threshold in FIJI/ImageJ, *P < 0.05. (I) Effects of SMU1 on GC cell proliferation were measured using a CCK-8 assay. (J) Transwells assay using the indicated cells (40×). (K) Quantification of cell migration and invasion ability of indicated cells. Cell counts were quantified by selecting the corresponding threshold in FIJI/ImageJ, **P < 0.01, ***P < 0.001. The data are presented as the mean ± SD.
SMU1 Promotes GC Cell Tumorigenesis in Vivo
A subcutaneous xenograft model was established for tumorigenesis in nude mice. The results showed that SMU1 overexpression significantly increased tumor growth (P = 0.0011, P = 0.0116, Figure 3(B) and (C)), whereas SMU1 inhibition suppressed tumor growth (P = 0.0095, P = 0.0017, Figure 3(B) and (C), as measured from the tumor weight of mice and tumor volume (Figure 3(A)–(C)). IHC staining of PCNA revealed a significant DNA synthesis increase in tumor cells overexpressing SMU1 (Figure 3(D)–(G)). PCNA known as a molecular marker for proliferation gives its role in DNA replication. The results showed the PCNA expression were consistent with that of SMU1 in nude mice, suggesting that SMU1 might be a potential regulator of cell proliferation in GC. To further determine the correlation between SMU1 and PCNA, Pearson correlation analysis was used to analyze the correlation between 2 molecules in 130 GC samples. It was found that there is a strong correlation between SMU1 and PCNA (r = 0.7522, P < 0.0001). Based on these findings, SMU1 functions as an oncogene that promotes GC cell tumorigenesis in vivo. SMU1 promotes GC cell tumorigenesis in vivo. (A) Representative images of tumors isolated and weighed after injection (n = 6 mice). (B) Representative data of tumor weight (n = 6 mice, unpaired t test) injected with the indicated cells, **P < 0.01. (C) Representative data of tumor volume (n = 6 mice, unpaired t test), *P < 0.05, **P < 0.01. (D) Representative images of IHC staining of proliferating cell nuclear antigen (PCNA) in harvested tumors that developed in the mouse model (Scale bar: 2000 μm; 50 μm). (E) Representative images of IHC staining of SMU1 in harvested tumors that developed in the mouse model (Scale bar: 2000 μm; 50 μm). (F) Representative images of HE staining in harvested tumors that developed in the mouse model (Scale bar: 2000 μm; 50 μm). (G) Quantification of IHC staining by Image J. (H) The correlation between SMU1 and PCNA protein expression in 130 samples was analyzed using Pearson correlation analysis. The data are presented as the mean ± SD.
SMU1 Promotes Proliferation Accompanied by Cell Cycle Activation in Human GC Cells
A cell cycle assay showed that SMU1 overexpression significantly increased the S phase population compared to that in NC cells significantly (32.54 % vs 23.28 %, P = 0.0025) (Figure 4(A) and (B)), The data indicated that SMU1 overexpression could accelerate cell proliferation, which was consistent with the previous results. Once the expression of SMU1 decreased, compared with NC group, the proportion of G0/G1 phase in shRNA-3 treated cells reduced markedly (55.56 % vs 31.55 %, P < 0.0001), whereas the proportion of cells in the S phase increased in shRNA3-treated cells compared to that in the control group (20.59 % vs 48.64 %, P < 0.0001) (Figure 4(C) and (D)), indicating that the cell cycle of SMU1 downregulation cell was arrested at G0/G1 phase. The diploid values of each phase measured 3 times by FCM are shown in Supplemental Table 3. The mechanism of tumor progression might be through the regulation of the cell cycle by SMU1 since the G0/G1 phase was arrested in SMU1 inhibition. These data suggested that SMU1 promotes proliferation accompanied by cell cycle activation in human GC cells. According to Figures 4(E)–(H), DNA synthesis was stimulated in SGC7901-OE, while it was inhibited in SGC7901-shRNA3 (P = 0.0424, Figure 4(F); P = 0.0059, Figure 4(H)). About 25% fewer cells were EdU-positive in SGC7901-OE than in SGC7901-shRNA3, indicating that the suppression of SMU1 inhibits tumor cell proliferation. SMU1 promotes proliferation accompanied by cell cycle activation in human GC cells. (A) Flow cytometry analysis of cell cycle progression in SGC7901-NC and SGC7901-OE. (B) Representative images and statistical analysis of cell cycle distribution in SGC7901-NC and SGC7901-OE, **P < 0.01. (C) Flow cytometry analysis of cell cycle progression in SGC7901-shNC and SGC7901-shRNA3. (D) Representative images and statistical analysis of cell cycle distribution in SGC7901-shNC and SGC7901-shRNA3, ****P < 0.0001. The diploid values of each phase were presented as the mean ± SD measured 3 times by FCM. (E) The proliferation of SGC7901-NC and SGC7901-OE cells was detected using the EdU reaction system after a 2-h incubation. Photographed by cell imaging multi-mode reader (Cytation 1, BioTek) at 4×, scale bar: 1000 μm. (F) The statistical analysis is displayed in the graph, *P < 0.05. (G) The proliferation of SGC7901-shNC and SGC7901-shRNA3 cells was detected using the EdU reaction system after a 2-h incubation. Photographed by cell imaging multi-mode reader (Cytation 1, BioTek) at 4×, scale bar: 1000 μm. (H) The statistical analysis is displayed in the graph, **P < 0.01.
Discussion
SMU1, an essential RNA splicing factor, is evolutionarily conserved in the spliceosome, and also highly conserved among multicellular eukaryotes. 18 Furthermore, knockdown of SMU1 causes significant alternative splicing of many genes involved in human cell death and survival. 19 As reported previously, the abnormal expression of SMU1 served as an independent prognosis marker in OC progression, 13 but wasn’t researched in GC progression. In the present study, we found SMU1 overexpression to be associated with aggressive GC cell characteristics and poor patient outcomes. SMU1 expression was an independent and significant risk factor for reduced patient survival after curative resection. SMU1 overexpression promoted GC cell proliferation, migration, and invasion. These data strongly suggest that SMU1 contributes to malignant progression in GC.
The progression of cancer is closely related to the proliferation, invasion, and migration of tumor cells. Several different and mutually supportive assays have demonstrated the role of SMU1 in the regulation of DNA replication. The absence of SMU1 would reduce the speed of the DNA replication fork and the efficiency of dNTP incorporation by [3H] thymidine incorporation. 12 Previous studies only focused on the role of SMU1-related complexes in the process of mitosis, such as CRL7/SMU1 complex deletion might inhibit H2B ubiquitination of SMC1a which maintains the cohesion of sisters chromatids during mitosis, 19 the IK/SMU1 interaction with MAD1 is also involved in proper spindle attachment. 20 It causes cell cycle arrest at the mitotic phase, because of the localization or dissociation of IK in nuclear speckles. 21 In this study, We singly researched the role of SMU1 during the mitotic phase of tumor cells and found that the G1/S phase was arrested in GC cells as shown using flow cytometry and EdU assay as SMU1 was suppressed. That is to say, the regulatory effect of SMU1 on the cell cycle is earlier than that of its complex. Notably, a G-to-A transition at position 489 in hamster SMU1 yields cell cycle arrest at S and G2 phases with decreased DNA synthesis. 10 This discrepancy may be due to the different genetic backgrounds of the cells, and this possibility requires further exploration. Thus, although our studies have demonstrated defective tumor growth due to loss of SMU1, it remains to be determined whether these effects are mediated directly through cell cycle checkpoint or indirectly through regulation of the expression of unknown genes.
PCNA has been reported to be directly associated with tumor differentiation and progression in many tumors. 22 It was shown that the expression of PCNA was positively correlated with SMU1 expression in IHC results of subcutaneous transplant tumor and the CPTAC database. Although SMU1 is crucial for the proliferation of tumor cells and plays a role in the interphase of mitosis like PCNA, whether it directly or indirectly regulates the expression of PCNA in this situation has not been studied. Therefore, in future research, it will be interesting to test whether SMU1 is involved in regulating the expression of PCNA to regulate cell cycle processes.
Conclusions
Our study, for the first time, reports that SMU1 as a potential prognostic marker may be associated with GC malignancy, and plays a vital role in cell proliferation accompanied by cell cycle activation. However, further molecular researches are demanded to elucidate the specific mechanisms of cell cycle regulation by SMU1. In conclusion, this study proposes a new function of SMU1 in GC progression, implicating SMU1 as a potentially useful prognostic biomarker for the development of an effective treatment for GC. These findings may provide new insights into the etiology clinical diagnosis and treatment of GC.
Supplemental Material
Supplemental Material - SMU1 Knockdown Suppresses Gastric Carcinoma Growth, Migration, and Invasion and Modulates the Cell Cycle
Supplemental Material for SMU1 Knockdown Suppresses Gastric Carcinoma Growth, Migration, and Invasion and Modulates the Cell Cycle by Meirui Qian, Xue Liang, Qingmei Zeng, Chen Zhang, Nan He, and Jing Ma in Cancer Control.
Footnotes
Acknowledgments
We would like to thank Prof. Jianli Jiang for language and writing assistance.
Author Contributions
Conception: Meirui Qian and Jing Ma
Interpretation or analysis of data: Meirui Qian, Xue Liang, and Qingmei Zeng
Preparation of the manuscript: Meirui Qian, Chen Zhang, and Nan He
Revision for important intelectual content: Jing Ma and Meirui Qian
Supervision: Jing Ma and Meirui Qian
All authors commented on previous versions of the manuscript. All authors read and approved the final manuscript.
Declaration of Conflicting Interests
The author(s) declared no potential conflicts of interest with respect to the research, authorship, and/or publication of this article.
Funding
The author(s) disclosed receipt of the following financial support for the research, authorship, and/or publication of this article: This work was supported by grants from the National Natural Science Foundation of China (Nos. 82202844 and 81972711) and the Talent Introduction Program of the Second Affiliated Hospital of Air Force Military Medical University (No. 2021YFJH013).
Ethical Statement
Data Availability Statement
The datasets used and analyzed during the current study are available from the corresponding author upon reasonable request. Data sharing is not applicable to this article as no datasets were generated or analyzed during the current study.
Supplemental Material
Supplemental material for this article is available online.
References
Supplementary Material
Please find the following supplemental material available below.
For Open Access articles published under a Creative Commons License, all supplemental material carries the same license as the article it is associated with.
For non-Open Access articles published, all supplemental material carries a non-exclusive license, and permission requests for re-use of supplemental material or any part of supplemental material shall be sent directly to the copyright owner as specified in the copyright notice associated with the article.