
Abstract
Objectives
To determine the dysregulated signaling pathways of head and neck squamous cell carcinoma associated with circulating tumor cells (CTCs) via single-cell molecular characterization.
Introduction
Head and neck squamous cell carcinoma (HNSCC) has a significant global burden and is a disease with poor survival. Despite trials exploring new treatment modalities to improve disease control rates, the 5 year survival rate remains low at only 60%. Most cancer malignancies are reported to progress to a fatal phase due to the metastatic activity derived from treatment-resistant cancer cells, regarded as one of the most significant obstacles to develope effective cancer treatment options. However, the molecular profiles of cancer cells have not been thoroughly studied.
Methods
Here, we examined in-situ HNSCC tumors and pairwisely followed up with the downstream circulating tumor cells (CTCs)-based on the surrogate biomarkers to detect metastasis that is established in other cancers – not yet being fully adopted in HNSCC treatment algorithms.
Results
Specifically, we revealed metastatic HNSCC patients have complex CTCs that could be defined through gene expression and mutational gene profiling derived from completed single-cell RNASeq (scRNASeq) that served to confirm molecular pathways inherent in these CTCs. To enhance the reliability of our findings, we cross-validated those molecular profiles with results from previously published studies.
Conclusion
Thus, we identified 5 dysregulated signaling pathways in CTCs to derive HNSCC biomarker panels for screening HNSCC in situ tumors.
Plain language summary
Objectives
Investigating the dysregulated signaling pathways of head and neck squamous cell carcinoma (HNSCC) linked with circulating tumor cells (CTCs) using single-cell molecular characterization.
Introduction
HNSCC poses a significant global health burden with poor survival rates despite advancements in treatment. Metastatic activity from treatment-resistant cancer cells remains a major challenge in developing effective treatments. However, the molecular profiles of cancer cells, particularly CTCs, are not well-understood.
Methods
We analyzed in-situ HNSCC tumors and corresponding CTCs using surrogate biomarkers to detect metastasis, a technique not widely used in HNSCC treatment protocols.
Results
Our study revealed complex CTCs in metastatic HNSCC patients characterized by gene expression and mutational gene profiling via single-cell RNASeq (scRNASeq). These profiles confirmed molecular pathways inherent in CTCs, further validated by previous research.
Conclusion
Through our research, we identified five dysregulated signaling pathways in CTCs, suggesting potential biomarker panels for HNSCC screening in situ tumors
Keywords
Introduction
Head and neck squamous cell carcinoma (HNSCC) causes 350,000 deaths annually and 600,000 new cases worldwide. 1 Worldwide epidemiologic data suggest an increase in HNSCC incidence in younger patients without traditional risk factors, although tobacco use, alcohol use, and, more recently, human papillomavirus (HPV) infection causing oropharyngeal squamous cell carcinoma (SCC) are all established risk factors. 2 Various risk factors contribute to tumor heterogeneity, posing challenges for targeted therapies that are typically designed based on the molecular pathogenesis of the bulk tumor. As a result, even with numerous clinical trials focusing on treatments to enhance disease control rates, up to 60% of patients still encounter loco-regional recurrence, and approximately 20% experience distant metastasis. This rate highlights the complexity of the disease and the need for further advancements in therapeutic approaches to address these issues. 3 We realized that cancer subclones derived from the patient’s HNSCC tumor stem cells could be used to screen personalized antitumor immunotherapy and chemotherapy to maximize benefits and minimize the adversary effects of personalized or precision medicine. 4 Unfortunately, little is known about the clonal architecture and related subclonal evolution upon therapy in primary tumors or distant relapse of head and neck cancer. 5 The behavior of cancer cells that spread to other parts of the body, known as metastasis, is primarily responsible for the progression of cancer malignancies toward a terminal stage. The process known as metastasis, which is believed to be the most complex skill possessed by cancer cells, presents a substantial obstacle in developing successful techniques for treating cancer. The emergence of novel genetic subclones within a tumor triggers the development of metastatic subclones that exhibit distinct characteristics compared to the primary tumor in the same patient. 6 This data suggests the possibility of either the establishment of subclones during the metastatic process or ongoing clonal evolution of both tumors following metastasis, including into the lymph nodes, 7 with the presence of both acquired and inherent radioresistance in subclones of tumor cells that associated with tumor relapse and a negative prognosis. 5
The occurrence of invasive subclones in distant metastasis of tumors is thought to be associated with the epithelial-mesenchymal transition (EMT), which is considered an early stage of metastasis. 8 This process significantly impacts the overall survival rates for head and neck cancer (HNC). Circulating tumor cells (CTCs) have detached from a primary tumor and entered the bloodstream, potentially leading to metastasis. In recent years, CTCs have emerged as a promising biomarker for the diagnosis, prognosis, and treatment, used as indications for the detection of metastasis in a variety of cancers, their application in treatment algorithms for Head and neck squamous cell carcinoma, also known as HNSCC, has not yet been fully adopted.
Accurate detection of recurrences or distant metastasis is challenging with the current imaging modalities, especially given the altered anatomy in post-surgical patients. CTCs have been approved by the U.S. Food and Drug Administration (FDA) as surrogate markers of progression-free survival in breast, colorectal, and lung cancer 3 but not HNSCC. Emerging data emphasizes CTCs’ diagnostic and prognostic relevance in HNSCC. Diverse advanced methods, including single-CTC analysis and immune marker profiling, show potential advantages over ctDNA analysis. 9 However, further clinical trials are necessary before CTCs become established diagnostic and prognostic tools in managing HNSCC patients. There is a profound clinical benefit in using CTCs isolated from blood samples of HNSCC patients to detect residual or recurrent cancer, even before they are visible on standard imaging surveillance. Furthermore, CTCs could be used to predict treatment response to chemotherapy or immunotherapy by defining a biomarker panel of drug resistance.
However, current commercialized CTC tests like CellSearch® only detect cells of epithelial origin through markers like EpCam without further defining the gene expression or mutation profiles of these CTCs. 10 Some reports that using a highly sensitive device that purifies CTCs using biomimetic cell rolling and dendrimer-conjugated antibodies elevated CTC counts during and following treatment of chemoradiation and cetuximab. 11
Here, we investigated 4 HNSCC patients, in situ tumors, side-by-side with their complex CTC populations, which could be defined through rigorous gene expression and mutation profiling using our single-cell device 12 other than CellSearch®. We perform a proof-of-principle study in 4 patients pairwise of biopsy-proven metastatic HNSCC (in-situ tumors) by isolating matching CTCs in whole blood, completing single-cell RNASeq (scRNASeq), and defining the molecular CTC-specific biomarkers within each patient. We compared them to determine whether metastatic HNSCC patients exhibit intricate CTC subclones, which were identified by a thorough analysis of gene expression and mutation profiles placed in direct correlation. Those novel biomarkers have the potential to be developed into a low-cost PCR screening assay for early detection of HNSCC relapse, which can be back-tracked to in-situ-tumors sub-clonal prescreening of drug resistance and metastatic prediction of earlier events.
Methods
Nature of the Study
We embarked on a proof-of-principle study involving 4 patients diagnosed with metastatic HNSCC with confirmed in-situ tumors. In this study, we isolated matching CTCs from whole blood samples and subjected them to single-cell RNA sequencing (scRNASeq) analysis. Our primary objective was to define molecular CTC-specific biomarkers within each patient, thus validating the feasibility of our approach.
Clinical Characteristics and Demographics of Patients
The patients in this study provided written consent, indicating their understanding and agreement to undergo surgical and experimental procedures. They also explicitly consented to the publication, including any accompanying images. The Institutional Review Board, which oversees ethical considerations in research, reviewed and approved the protocol and the consent process for this study (USC # HS-20-00212).
Demographics of 4 Patients.

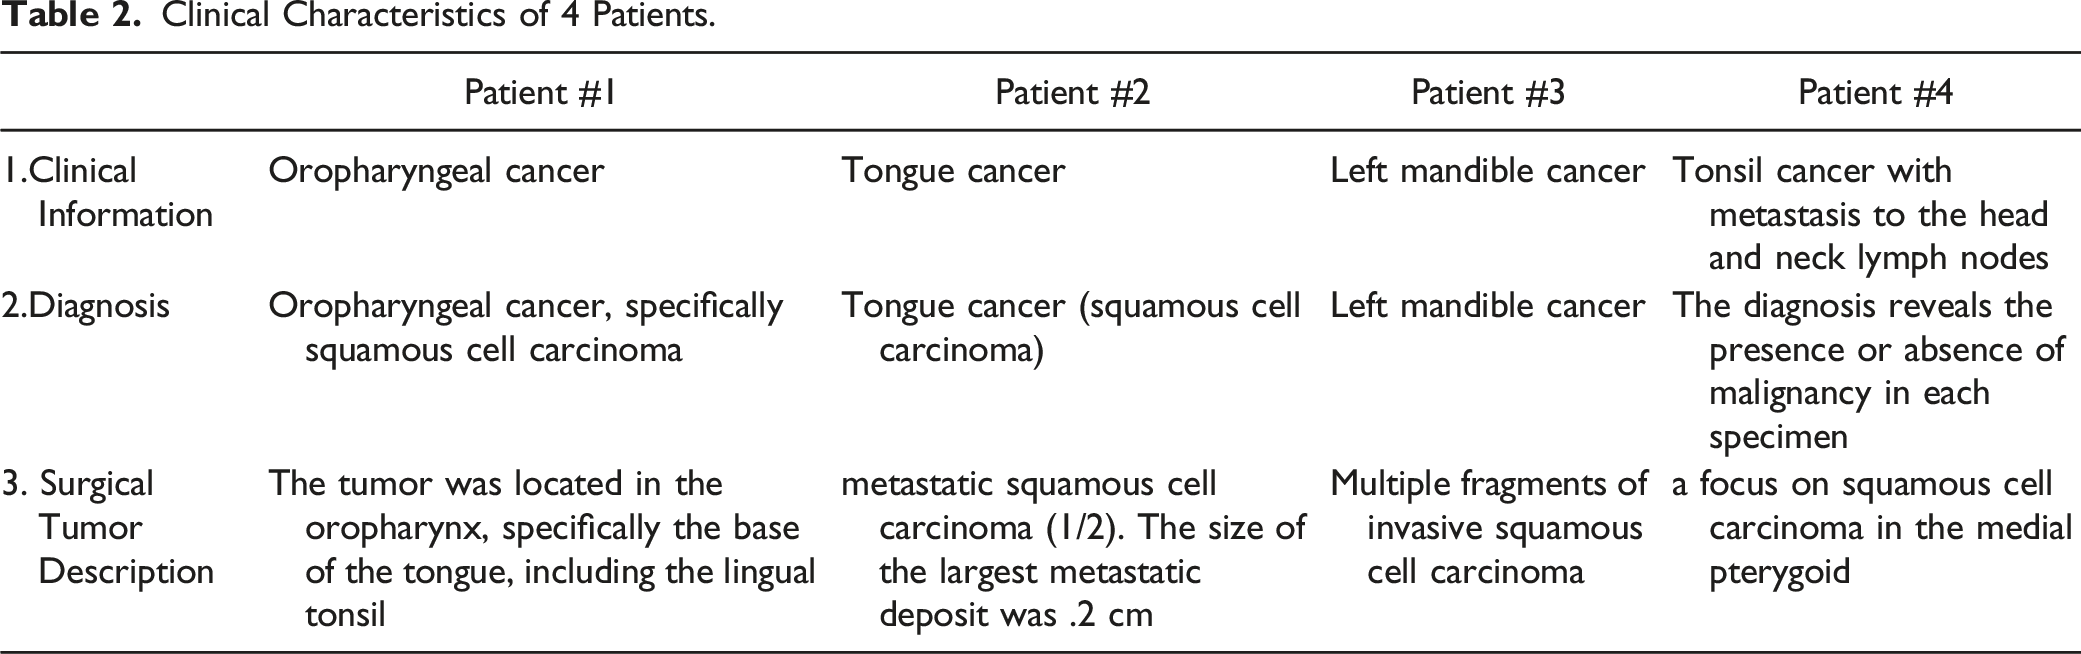
Clinical Characteristics of 4 Patients.
10X Library Preparation
Blood samples were collected from 4 patients with biopsy-proven HNSCC. Peripheral blood mononuclear cells were isolated from 10 mL of blood by Ficoll-Paque PLUS (G.E. Healthcare Life Sciences). Epithelial tumor cells were positively selected with human CD326 (EpCAM) MicroBeads (Miltenyi Biotec). Negative (normal) cells were simultaneously collected. CD326 (EpCAM) positive and negative tumor cells were counted using the LUNA II automated cell counter (Logos Biosystems). One thousand EpCAM positive cells and 5000 negative cells were processed using the 10x Genomics Chromium Controller and the Chromium Next GEM Single Cell 3' GEM, Library & Gel Bead Kit 5′ Library & Gel Bead Kit (10x Genomics) following the standard manufacturer’s protocol for Chromium Single Cell 3' Reagent Kits User Guide (v3.1 Chemistry). Each cell sample was diluted to 1000 cells/μl for capture on the 10X Genomics Chromium controller. Chromium Single Cell transcriptome 3' gene expression libraries were prepared according to manufacturer protocols. A total of 8 10X Genomics sequencing libraries were sent out for sequencing on an Illumina NovaSeq 6000 System (150bp pair-end), producing ∼150X coverage of each enhanced region.
scRNAseq Normalization and Analysis
The CellsRanger (v.3.0.0) program was used to load and process scRNAseq Fastq sequences (10x Genomics). Demultiplexed UMI (unique molecular identifiers) were aligned to Homo Sapiens Genome Reference Consortium Human Build 38 (GRCh38). The raw data provided by CellRanger were filtered for quality control. Reads that passed the quality control were then analyzed using Seurat. 13 The data was then standardized by determining size factors and using a deconvolution-based technique to remove cell-specific biases. The log-normalized gene expression was then read back into the Seurat entity. Seurat began by scaling the normalized data. To filter the cells by quality, Seurat’s “FilterMatrix” was utilized (cells with more than 500 expressed features). All genes in the dataset that passed the filter were used to calculate the main components, and the results were shown using a screen map. Cells were then split into unsupervised groups using a Uniform Manifold Approximation and Projection (UMAP) clustering technique. Differential Gene Expression (DGE) Analysis: For significantly differentially expressed genes among all samples, the cutoff for significance was defined as the false discovery rate (FDR) adjusted P-value (q-value <.05) and >2-fold change. The best clustering resolution was computed using the clustree package 14 by drawing a cluster tree with increasing resolution ranges from zero to 4 with a step of UMAP, as implemented in Seurat, was then used to plot the cells. The Seurat “FindMarkers” tool was used with default Wilcox test parameters to find differentially expressed genes and markers for each cluster. Top marker genes (P < .05 and log fold change>.25) were combined with pre-defined cell-type marker genes to distinguish various cell types among the clusters. The outcomes were calculated against the UMAP categories. All data visualization and analyses were done in the R package. 15
Pathway Analysis
Using the normalized total counts for each group, the top differentially expressed genes between groups were calculated and compared using a P < .05 criterion. We utilized Ingenuity Pathway Analysis (Qiagen) to find significantly enriched pathways. The up-or-down-regulation of the identified pathways was then determined using gene expression values.
Results
We started with collecting 4 patients’ blood specimens with cancer cell metastatic activity of lymph nodes that were principally responsible for the development of malignant malignancies towards a terminal state, aimed at profiling circulating tumor cells (CTCs) used as indications for metastasis detection of metastatic Head and neck squamous cell carcinoma (HNSCC), by taking advantages of a sensitive single-cell transcriptome (scRNA seq) analysis.
Patient Characteristics and Study Design
Four HNSCC patients with biopsy confirmation were included in the study, and their clinical features are outlined in demographics in Table 1 and clinical courses (Table 2). Their perspective histological analyses indicated the malignant cells invaded the surrounding tissues and lymph nodes (Figure 1). The ages ranged from 49 to 68 years old. Two were women, and 2 were men. Two patients’ histories revealed that they had never used tobacco, while the other 2 patients’ pathological histories revealed that they were heavy smokers. The oral cavity and oropharynx were the only sites affected by malignancies. The tumor stage ranged between I-IV. The progress of each patient was monitored closely throughout their therapeutic therapy. Pathological and historical characteristics of 4 patients with Head and neck squamous cell carcinoma (HNSCC). All tissues were from oral or oropharyngeal epithelium, and the sections of tissues were Hematoxylin and eosin (H/E) staining for microscopic examinations of diagnostics. Most of the tissues showed squamous cell carcinoma (SCC) arising from the epithelium. Some slides showed blood vessels and bone (no muscle). 1A: The tumor had lymphovascular invasion and perineural invasion. Four out of 6 lymph nodes in the left neck contents showed metastatic carcinoma with extranodal extension. 1B: squamous cell carcinoma (SCC) (asterisk), invading bone (arrowheads) 20x. 2A, 10X; 2B: SCC (asterisk) with epithelial pearls (arrowheads), 20x. 3: 10X. 4A, 10X; 4B: Sheets of SCC (asterisk), infiltrated with lymphocytes (arrowheads), 20x. (Note that all embedded white-dash scale bars [in the lower right corner of each micrograph image] were measured in 100 μM).
Blood specimens were taken from the patients, and the normal leukocytes and isolated EpCAM-positive CTCs were lysed so RNA could be extracted. We were successful in extracting high-grade RNA from all 4 of the patients. The results of the pre-alignment QAQC showed that an average of 36.5 million readings were acquired from each sample, with an average phred quality score of 30.4 (equating to an accuracy of 99.9%). Phred quality scores were a measurement of how accurately a specific base was identified by the automated DNA sequencing process. Figure 2 provides a concise overview of the overall design of the investigation, from tissue processing to single-cell cDNA library preparation and scRNA sequencing, followed by bioinformatics. Summary of experimental design. Following Blood collection, cells detected with positive EpCam expression are labeled CTCs and mechanically separated using EpCAM (CD45) conjugated magnetic beads. Both the captured CTCs and normal leucocytes (LEU) are then subjected to unbiased 10X chromium, single-cell capture, and tagging for gene expression and mutation profiling.
Single-Cell RNA-Seq Reveals Distinct Circulating Tumor Cell (CTC) Subpopulations
After isolating nucleated cells from the peripheral blood, these cells were subsequently divided into the CTC (EpCam + CD45−) and leukocyte (LEU; EpCam- CD45+) components. Single-cell RNA sequencing was performed on CTCs as well as LEUs in order to profile their transcriptomes. In comparison, an average of over two thousand cells were sequenced for each of the LEU samples, and approximately two hundred cells were sequenced for each of the CTC samples. The ten distinct subpopulations were produced using the pooled single-cell transcriptomes (CTCs and LEUs), which were clustered based on their similarities (Figure 3(A)). Only 3 different subpopulations had CTCs, which clustered together in their own unique way apart from LEUs (Figure 2(B)). Only in LEU subpopulations was the expression of LEU marker genes such as CD45, LAT, FYB, and GNLY found (Figure 3(B), gray dots). This observation agreed that CTCs are epithelial cells that differ from LEUs’ expression profiles. Paired circulating tumor cells (CTC) and healthy leukocytes from the same patient were isolated, and RNA was quantified. Uniform Manifold Approximation Projection (UMAP) was used to classify single cells by RNA expression similarity. Unbiased clustering of the single cells resulted in their cataloging into 10 distinct populations (A and C). Panels B and D show the CTCs (Red n = 737) among all collected single cells (7,474 cells) from 4 different patients (B and D). Note that the clusters are based on molecular characteristics and assigned by Partek as a cluster.
We then went on to investigate the different CTCs pooled together from each of the 4 patients (Figure 4). We found that the CTCs from some patients had numerous subpopulations, each with a unique gene expression profile. This finding highlights that CTCs can be heterogeneous even within a single individual. CTCs obtained from patient 1 had all 3 subpopulations, whereas those obtained from patients 3 and 4 only had 2 subpopulations each. Only 1 type of CTC subpopulation was found for patient 2 (Figure 4). Although patient 1 and patient 3 displayed clusters that unmistakably distinguished them from each other, both patients possessed a collection of cells whose gene expression fingerprints were identical to each other. There was some overlap between patients 1 and 3 as well as between patients 1 and 4, but there was only a minimal amount of overlap between patients 2 and 4. This feature was shown by scatter plots of each CTC subpopulation (Figure 4), which showed that all CTCs displayed separate gene expression patterns (Figure 4(B)). These findings pointed to the possibility that CTCs in some patients have distinct molecular features, which explains why patients’ responses to treatment might vary so widely. Circulating tumor cells (CTC) were isolated, and RNA was quantified. Three-dimensional scatter plots of isolated circulating tumor cells (CTC) from 4 patients. Panel A shows the unbiased clustering of the isolated CTC by Uniform Manyfold Approximation Projection (UMAP). Colors in Panel B represent cells of the 4 individual patients(B) (C–F) CTCs for each patient, which are highlighted in panels C through F. Patient 1 (C) (Blue), Patient 2 (D) (Yellow), Patient 3 (E) (Red), Patient 4(F) (Green).
In addition, we looked at the differences between the different clusters for each patient. The analysis of these subpopulations revealed a differential expression of genes associated with adipocytes, including CSTA (p-val:1.61E-31; 50-fold change), TKT (p-val:1.61E-31; 7-fold change), and IRAK3 (p-val:1.61E-31; 7-fold change) (p-val 6.93E-27;30-fold changes).
Differential Gene Expression Among all CTCs
Three genes exhibited differential expression between CTCs and LEUs in all patients: the protein-coding genes ZNF665 and WDR62 and the non-coding RNA TSIX. There were 1,584 genes that were differentially expressed across patients 1 and 3, including TLR4 (p-val: 2.7E-20), TGFB1 (p-val: 8.12E-18), and CD163 (p-val:2.6E-18), which were all increased in CTCs of patient 3 relative to patient 1.
Conversely, FGF22 (P-value: 1.7E-3), DAAM2 (2.01E-6), and IL11 (2.35E-3) were significantly higher in CTCs of patient 1 compared to those of patient 3. Gene expression profiles between CTCs of patients 2 and 4 were more similar to each other than the remaining 2 patients; however, there were 1,888 differentially expressed genes between them. IGF2R (P-value: 8.19E-55) and BRAF (P-value: 5.92E-11) were substantially differentially expressed genes. The most significant difference in gene expression profiles was observed between the CTCs of patient 1 and patient 2 (10,720 differentially expressed genes); differences between patients 1 and 4 were more modest (2,495 differentially expressed genes). Interestingly, MALAT1 (Metastasis Associated Lung Adenocarcinoma Transcript 1) was highly expressed in patient 1 when compared to that of patient 4 (P-value: 2.16E-27 and a 17-fold increase); the same gene had a 41-fold difference between patient 1 and 2 (P-value:1.02E-185) but only two-fold difference between patients 1 and 3 (P-value: 2.25E-34). No difference in MALAT1 expression was observed when comparing patients 2 and 4.
Because of the similarities between them, we examined and grouped the CTCs from patients 1 and 3 against those from patients 2 and 4 in order to acquire a better understanding of the significant distinctions that exist between the samples. Analysis of these samples using the pairwise comparison method revealed a significant difference in the expression of S100A6 (1.27E-48), the mean of which was 138-folds greater in patients 1 and 3 than in patients 2 and 4. In patients 1 and 3, the FOS levels were 300-folds greater, while in patients 2 and 4, the levels of the ubiquitin ligase MARCHF4 were 177 times higher in the CTCs (P-value: 3.3E-41).
Mutational Analysis of Circulating Tumor Cells
We compared the mutational profile of CTCs to that of LEUs and filtered out the germline mutations by comparing CTCs and LEUs of the same patient. Only nonsynonymous nucleotide mutations that altered the amino acid sequence of a protein were considered. A comparison of mutations among the same patients showed that patient 1 had 3,964 gene mutations unique to the CTC sample, patient 2 had 2,317 mutations unique to the CTC portion, patient 3 had 1,793 mutations in the CTCs, and patient 4 had 1,303 mutations unique to the CTCs. When we combined all 4 patients, after filtering out germline mutations specific to individual patients and genes present in both CTCs and LEUs of the same patient, we found 1,108 mutations unique to the CTC that were not present in normal LEUs (Figure 5). Following that, we sought to determine, from among the 1,108 mutations, which ones may make good therapeutic targets. The Venn diagrams compare point mutations leading to gene expression changes. We found 1108 mutations in genes that were unique to the CTCs that were not present in normal cells.
Functional Network Analysis to Identify Druggable Targets
Thus, we performed a functional network analysis using the Ingenuity Pathway Analysis. This analysis was based on 1,108 genes that were solely altered in the CTCs. The top 5 pathways to which the mutations were mapped were displayed in Figure 6. The top 3 differentiated pathways were the CREB signaling pathway (P-value:2.23E-3), the β-Adrenergic receptor signaling pathway (p-val:3.00E-03) activation, which had 17 molecules represented in it, and the G-protein receptor signaling pathway (P-value:2.57E-02), which had 43 molecules mapping to it. Interestingly, all 3 of these pathways play an essential role in the development of carcinogenesis in various malignancies, including HNSCC.
16
The top 5 dysregulated pathways in the CTCs compared to normal cells are shown (The Left panel). Several notable pathways that overlap with the pathways dysregulated in Head and Neck cancer tissues (TCGA), including EIF2 signaling, mTOR signaling, and PD-1 pathways, are critical to carcinogenesis and drug response. Activation z-scores infer the activation states of the populated pathways (The Right panel).
We compared the patient-derived results to the mutational analysis of the TCGA HNSCC dataset to ensure that they apply to a large population. The potential of CTCs as tissue surrogate monitoring for detecting HNSCC advancement was validated by a functional analysis of the top 2000 occurring mutations in the TCGA dataset, which corresponded to the mentioned pathways.
Discussion
This study’s findings show a large amount of variation in gene expression and mutations as well as related signaling pathways between individuals and even within the same patient. This data suggests that treatment resistance can evolve on a single cell level. Such CTC heterogeneity among patients and within patients underscores the complexity of HNSCC. It could explain why treatment failure frequently occurs, even in early-stage HNSCC patients, as manifested in resistance to therapies. However, when recurrences occur in single-cell subclones, they are sometimes not found until too late when detected by imaging. By this point, recurring cancer may have progressed to the point where it cannot be treated successfully enough to prevent further outbreaks. As a result, the patient may be doomed to die from the disease. A recent study has identified the tumor microenvironment (TME) as a critical element affecting therapy response in HNSCC, emphasizing the importance of spatially resolved methods to comprehensively assess its cellular and molecular composition, with specific focus on immune checkpoint molecules and tumor necrosis factor receptor superfamily members as potential biomarkers for immunotherapy response. 17 Thus, such a deeper tumor microenvironment profiling linked to peripheral blood CTC single-cell transcriptome might enhance the prognosis of HNSCC with treatment. 4
With the completion of the human genome project at the turn of the century, the hope was that emerging genomic technology would facilitate the identification of highly effective biomarkers to determine risk in cancer patients. Some cancers have seen significantly improved outcomes with clinically robust biomarkers for risk prediction and targeted therapies.18,19 However, HNSCC research has trailed behind that of other cancers, and as a result, HNSCC survival has not improved in the past 4 decades. One reason is the heterogeneous and unpredictable response of patients to the standard treatment, which currently includes surgery and radiation in conjunction with chemotherapy (i.e., cisplatin), biologics (i.e., cetuximab), and immunotherapy (anti-PD1 therapy).
While the abysmal survival outcomes emphasize the need for more precise methods to monitor response and therapies targeting dysregulated gene pathways specific to each patient, current biomarker studies and technologies do not yet allow such personalized approaches. Personalized treatment and monitoring of recurrence at the cellular level before they are visible on imaging require profiling of the cancer cells. Molecular profiling of tissue biopsies is not feasible as patients cannot be subjected to repeated biopsies to monitor response. Profiling of CTCs extracted from minimally invasive blood could be a promising avenue to develop personalized treatments. Our study demonstrates that CTCs carry the same mutations and dysregulated gene pathways as cancer tissue and, therefore, could serve as an acceptable non-invasive and repetitive alternative to cancer profiling and treatment response monitoring.
We found CTC mutations in the CREB signaling pathway, β-Adrenergic receptor signaling, and G-protein receptor signaling pathway. Activation of signaling by the CREB coactivator CRTC2 promotes oncogenic function in HPV-positive HNSCC. 20 Preclinical trials on an inhibitor of the CREB pathway in HNSCC demonstrate anti-neoplastic potential, particularly in HPV-positive HNSCC, which introduces the potential for treatment de-escalation using this inhibitor rather than standard chemotherapy, which has significantly more side effects. 21 β-adrenergic receptor signaling has been shown in multiple studies to modulate carcinogenesis and cancer pain in HNSCC.22,23 The β-adrenergic pathway activation increases HNSCC aggressiveness. 24 High ADRB2 expression stimulates HNSCC proliferation, adhesion, invasion, and angiogenesis. 24 The β-adrenergic pathway blockade in vitro leads to the inhibition of pro-oncogenic pathways, 16 suggesting that HNSCC utilizes the β-adrenergic pathway to develop drug resistance. The G-protein receptor signaling pathway has previously been shown to be epigenetically regulated in HNSCC, and epigenetic dysregulation of this pathway predicts treatment failure in HPV-positive HNSCC. 25 Here, we demonstrate that this pathway is also dysregulated with multiple mutational features in CTCs.
This proof of principle study establishes a workflow to isolate CTCs from HNSCC patients’ blood samples before and during cancer treatment. We demonstrate reliable purification of nucleic acids, high-quality single-cell RNA-Seq, and mutational analysis results.
However, we realize that the limitation of the sample size in statistical power calculation is in the number of patients estimated for the sample size selected for the study. Nonetheless, we focused on single-cell molecular profiling in specific patients, precision oncology tailored to 1 particular patient. Future trials will increase patient numbers and optimize the analysis for repeated testing in the same patient to determine treatment response and monitor cancer recurrence using CTCs as surrogate biomarkers of tissue biopsy.
A recent study identified 238 tumor-related single-nucleotide variants (SSNVs) involving 120 frequently mutated genes in primary tumors, the lymph node, and bone marrow. 26 The number of SSNVs unique to the primary lesion, submandibular lymph node, and bone marrow exceeded the number of shared SSNVs. Additionally, SSNVs enabled the identification of subclones originating from the primary lesion, which were also present in submandibular lymph nodes during the early stages of oral carcinogenesis. Furthermore, distinct subclones were identified in disseminated tumor cells (DTCs) isolated from lymph nodes at different histopathological stages. Taken together, we propose a “wait-and-watch” scheme for monitoring a lifetime cancer stem cell development evolved with local environments to cancer. 27
Conclusion
Through the association of in-situ tumors and CTC single-cell profiling, we characterized the molecular routes within CTCs to create an innovative biomarker array for detecting HNSCC recurrence in localized tumors.
Footnotes
Author Contributions
AS, CTV, SCL, and JFZ conceptualized the study and interpreted the data. AS and SCL wrote the manuscript. BEA, YY, JC, and YZ. provided expertise in sample processing and data analysis. XC, CD, TM, P.S., and U.K.S. aided in sample collection, processing, and patient data collection. All the authors approved the manuscript for submission.
Declaration of Conflicting Interests
The author(s) declared no potential conflicts of interest with respect to the research, authorship, and/or publication of this article.
Funding
The author(s) disclosed receipt of the following financial support for the research, authorship, and/or publication of this article: This work was supported by National Institutes of Health (NCI, R01 CA197903 & R01 CA251848); CHOC Children’s—UC Irvine Child Health Research Awards #16004004; CHOC-UCI Child Health Research grant #16004003; NIH/NIDCR K23 DE030250.
Ethics Approval and Consent to Participate
Institutional Review Board approval was obtained to create the de-identified patient database and collect biological samples.
Consent for Publication
We confirm that the manuscript represents original work, has not been previously published, and is not under consideration for publication elsewhere. We further affirm that all co-authors have reviewed and approved the manuscript, and we take responsibility for obtaining necessary permissions for any copyrighted material included in the manuscript.
Data Availability Statement
All data generated for this study are included in this article.