
Abstract
Objective
A mini-invasive and good-compliance program is critical to broaden colorectal cancer (CRC) screening and reduce CRC-related mortality. Blood testing combined with imaging examination has been proved to be feasible on screen for multicancer and guide intervention. The study aims to construct a machine learning-assisted detection platform with available multi-targets for CRC and colorectal adenoma (CRA) screening.
Methods
This was a retrospective study that the blood test data from 204 CRCs, 384 CRAs, and 229 healthy controls was extracted. The classified models were constructed with 4 machine learning (ML) algorithms including support vector machine (SVM), random forest (RF), decision tree (DT), and eXtreme Gradient Boosting (XGB) based on the candidate biomarkers. The importance index was used by SHapely Adaptive exPlanations (SHAP) analysis to identify the dominant characteristics. The performance of classified models was evaluated. The most dominating features from the proposed panel were developed by logistic regression (LR) for identification CRC from control.
Results
The candidate biomarkers consisted of 26 multi-targets panel including CEA, AFP, and so on. Among the 4 models, the SVM classifier for CRA yields the best predictive performance (the area under the receiver operating curve, AUC: .925, sensitivity: .904, and specificity: .771). As for CRC classification, the RF model with 26 candidate biomarkers provided the best predictive parameters (AUC: .941, sensitivity: .902, and specificity: .912). Compared with CEA and CA199, the predictive performance was significantly improved. The streamlined model with 6 biomarkers for CRC also obtained a good performance (AUC: .946, sensitivity: .885, and specificity: .913).
Conclusions
The predictive models consisting of 26 multi-targets panel would be used as a non-invasive, economical, and effective risk stratification platform, which was expected to be applied for auxiliary screening of CRA and CRC in clinical practice.
Keywords
Introduction
Colorectal cancer (CRC), a malignancy of digestive tract, is one of the most prevalent neoplasm worldwide. 1 Recent global cancer statistics indicated over 19 million new cases and nearly 935,000 deaths from CRC across the world in 2020. 2 Although declining CRC morbidity and mortality occurred in some developed nations owing to effective screening, the rates in developing nations such as China are on the rise. The considerable incidence rate of CRC places a continuously growing strain on healthcare resources and economic burden. Therefore, a more efficient tool and screening program is urgently needed for early diagnosis and intervention. 3
In early stages, CRC symptoms are atypical and non-specific, usually manifesting as diarrhea, abdominal pain and distention, belching, and weight loss. That could cause the majority of sufferers to be diagnosed at the intermediate to end-stage of disease progression, even if the disease behaves as distant metastases with a low 5-year survival rate. During the progression, the detection of CRC depends on screening and early diagnosis technologies. 4 The U.S. Preventive Services Task Force (USPSTF) recommends CRC screening at 50 years of age with fecal occult blood testing (FOBT), sigmoidoscopy, or colonoscopy. 5 Currently, colonoscopy and pathological biopsy have been regarded as the reference standard for CRC identification, as well as this reduction in CRC incidence can be attributed to the removal of the primary lesion and adenoma.6,7 Data from the Cancer Screening Program in Urban China (CanSPUC) revealed a meager 14% of high-risk populations undergoing colonoscopy, 8 a low adherence likely stemming from the mandatory bowel preparation and potential severe complications (perforation, bleeding, and cardiorespiratory problems).6,9 Fecal immunochemical test (FIT) has better sensitivity and specificity in screening and detection of advanced adenoma (AA) and CRC than FOBT, unfazed by dietary or drug-induced perturbations. 10 Nevertheless, the establishment of a quantitative FIT threshold is the critical factor in determining the sensitivity, specificity, and positive predictive value of screening.11,12 Recent innovations have brought forth a suite of molecular biomarkers for early diagnosis and improved outcomes in CRC, including DNA (mutations and methylation biomarkers), RNA (miRNA and lncRNA), proteins, and fecal bacteria. 13 However, their clinical ubiquity is curtailed by exorbitant costs and manual intricacies.
CRCs occur sporadically, and follow the transition from the normal-adenoma-carcinoma-metastasis pathway. It is well known that CRC initiation and development is a progressive pathological process that involves multiple genetic mutations, multiple factor involvement, and multiple-step evolution. This persistent pathological condition is often accompanied by many abnormal test results. A single test result of traditional serological markers does not accurately indicate the disease's condition, with low sensitivity and specificity. Additionally, traditional approaches find it challenging to examine the interrelationships and improve their diagnostic value for disease due to the numerous and laborious routine testing items. Machine learning (ML) algorithms focus on filtering voluminous variables, discerning intricate interplays from multidimensional data, harnessing vast data repositories for refined disease prediction. 14 ML has shown excellent predictive ability in the fields of physical disorders diagnosis, treatment, and prognostic monitoring and has provided us with an alternative method to traditional diagnosis, aid therapy, and outcome prediction. Currently, common ML algorithms are support vector machine (SVM), random forest (RF), decision tree (DT), eXtreme Gradient Boosting (XGB), artificial neural network (ANN), and so on. Prior endeavors have harnessed ML for disease prediction using data sets, clinical data, lifestyle, and imaging dat. Gould et al utilized ML to construct an effective lung cancer risk model with high accuracy using routine clinical and laboratory data. 15 The results revealed the model was more accurate before identifying lung cancer by standard eligibility criteria than mPLCOm2012. Afshar et al used an artificial neural network (ANN) model as a robust prediction tool for cancer diagnosis. 16 Byrne et al proposed a promising recognition program of diminutive colorectal polyps by endoscopic video images, which performed better than many community endoscopists. 17 By comparison, routine blood and biochemical tests are low-cost and more readily available. Moreover, past reports have focused on the detection and treatment of cancer and ignored the importance of precancerous lesions, a crucial link to cancer progression. Features of models based on clinical data were single, such as only blood counts or tumor markers, and did not make full use of routine indicators.
In this research, we aimed to construct a machine learning-assisted detection system with available multi-targets from routine blood tests for CRC and adenoma (CRA) screening. The multi-markers panel was selected and identification models were constructed with 4 ML algorithms. The predominant indicators for CRA and CRC were identified, and the streamlined model for them was also established. The platform was expected to be applied for auxiliary screening CRA and CRC in clinical practice.
Materials and Methods
Study Subjects
This study was carried out at Shenzhen Luohu People's Hospital, and approval for the study was obtained from the ethics committee of Shenzhen Luohu People's Hospital (approval number: 2022-LHQRMYY-KYLL-055, approval date: Nov. 21, 2022). Individual informed consent was approved for the waiver since this is a retrospective study. The inclusion criteria were as follows: (i) To avoid confusion with natural death, the age of researchers ranges from 18 to 80. (ii) The patient had been diagnosed with CRC, CRA, and healthy groups by imaging examination, colonoscopy, or pathological biopsy, without a history of any cancer treatment. (iii) The participant underwent radical surgery. The exclusion criteria were (i) a previous history of CRC or other cancer, (ii) familial adenomatous polyposis, inflammatory bowel disease, or other intestinal diseases, and (iii) missing data. We further classified CRA into AA and non-advanced adenoma (nAA). AAs were defined as meeting at least one of these criteria, with more than 3 at a time, conventional adenoma more than 10 mm, and high-grade neoplasia. nAAs were defined as meeting at least one of these criteria <3 at a time, conventional adenoma <10 mm in diameter, and low-grade lesions. We have de-identified all patient details, at last, a total of 817 participants were retained, consisting of 229 HCs, 186 AAs, 198 nAAs, and 204 CRCs. The research is according to the STROBE checklist for cohort studies. 18
The data were collected through the electronic medical record system of the hospital, including demographic characteristics (age and sex), laboratory test results (preoperative tumor markers, blood routine, liver function, kidney function, and other results), TNM staging, and histologic findings. Imageological examinations (preoperative abdominal enhanced CT and pelvic enhanced MRI) were used to determine the presence of distant metastasis of the primary tumor. According to the TNM staging criteria jointly issued by the American Cancer Federation and the International Union against Cancer, the postoperative histopathological results of CRC were performed for TNM staging.
Data Collection
Data quality has always been one of the important factors affecting experimental research. As a pivotal element of data quality, data missing has been ubiquitous. To decrease the effect of missing values, we deleted items with more than 30% missing values and adopted median replacement to impute missing data. The non-invasive characteristics ultimately included blood routine, liver function, renal function, tumor biomarkers, and so on. For example, neutrophil count (NEUT), carcino-embryonic antigen (CEA), total protein (TP), glucose (GLU), etc. The routine records of patients were collected on the first or second day of admission. The collected laboratory test data of the participants was randomly split into 2 parts in a ratio of 7:3, 70% of data for training models and the remaining 30% for verifying the performance of the model constructed above. In total, there are always 261 CRAs, 168 HCs as a train set and 123 CRAs, 61 HCs as a test set for the CRA model, and 142 CRCs, 161 HCs as a train set, and 62 CRCs, 68 HCs as a test set for the CRC model.
Risk Prediction Tool
We evaluated the effectiveness of 4 ML models in predicting the risk of CRC and CRA. In addition, we further analyzed the ability of the model to discriminate between AA and nAA. For model development, SVM, RF, DT, and XGB models were used to analyze the data. RF is used to identify essential features that improve the quality of training data set in our study for both classification problems and regression problems. 19 It realized more accurate and stable model predictions by constructing and merging multiple decision trees. 20 DT, consisting of nodes, branches, and leaves, was one of the most commonly used supervised ML algorithms in biomedical fields. 21 SVM, a non-probabilistic binary classification model, works effectively with two- or three-dimensional data. 22 Constructing the SVM classifier first requires determining the kernel function, and different kernel functions can lead to different prediction performance. 23 XGB, constructed with the xgboost package in R, has been widely recognized in numerous ML and data processing because of its remarkable data-handling capacity and efficient training speed.24,25
Feature Selection
On the basis of XGB algorithm, we used SHapley Additive exPlanation (SHAP) value to sort related variables included in the study, ranging by feature importance from largest to smallest. 26 Feature sorted by importance based on mean decrease accuracy and mean decreased Gini by RF algorithm as well. 27 The independent risk factors for CRC and CRA were analyzed by binary logistic regression and the odds ratio (OR) were calculated for the variables mentioned above. To simplify the model, the most paramount risk factors were selected to reconstruct the models to predict.
Performance Evaluation
To evaluate the prediction and accuracy of various classification models in our research, we calculated the areas under the curve (AUC), sensitivity (SE), specificity (SP), accuracy (ACC), and F1 score, which were obtained from confusion matrix in the validation set. The receiver operating characteristic (ROC) curve is a graphical plot derived from confusion matrix, with true positive rate (sensitivity) as the longitudinal coordinate and false positive rate (1-specificity) as the horizontal coordinate. AUC represents area under the ROC curve, and it ranges from 0 to 1. The closer the AUC is to 1, the better the prediction. We compared importance of feature to model prediction using SHAP plot. Additionally, we validated predictive model specificity by selecting data from other gastrointestinal malignancies at Shenzhen Luohu People's Hospital.


Statistical Analysis
The characteristics of patients were presented as percentages (%) for categorical variables and were analyzed using the chi-square test. Continuous variables were assessed for normal distributions using the Kolmogorov–Smirnov test. Those conforming to a normal distribution were expressed as means ± standard deviation (SD) and analyzed using the analysis of variance. Those with not met normality assumptions were expressed as medians and interquartile ranges, and analyzed using the Kruskal–Wallis test. P-value <.05 was considered statistically significant. All data were processed and analyzed using SPSS Modeler 26 and R programming language’s (version 4.2.1).
Results
Flowchart
This work mainly comprised 4 sections: data collection, data procession, machine learning models, and performance evaluation, as depicted in Figure 1. We enrolled a cohort of 817 patients; of these, 204 were diagnosed with CRC and 613 were non-CRC subjects (384 with CRA and 229 as healthy controls). The clinical characteristics of included patients are summarized in Table 1. No statistical differences for age medians and sex ratio (P > .05) were found between groups. Serum tumor markers level were higher in CRC patients than in the CRA and HC patients (CEA: P = .000; AFP: P = .001; CA199: P = .000). Inflammation-associated markers in blood routine examination, including NEUT, NLR, LMR, PLR, and SII, were elevated in the CRC group compared to controls (P = .000). CRC patients also exhibited decreased serum lipid, liver, and renal function markers such as CHO, LDL, HDL, TP, ALB, A/G, and others vs controls (P < .05). Flowchart of the colorectal cancer (CRC) and colorectal adenoma (CRA) identification model. Demographic and Clinical Characteristics of the Participants in This Study. aThe healthy control group was significant compared to the adenoma group. bThe healthy control group was significant compared to the cancer group. cThe adenoma group was significant compared to the cancer group. Abbreviation: HC, health controls; CRA, colorectal adenoma; CRC, colorectal cancer; CEA, carcino-embryonic antigen; AFP, alpha-fetoprotein; CA199, Carbohydrate antigen199; NEUT, neutrophil; LYMPH, lymphocyte; MONO, monocyte; PLT, blood platelet; HGB, hemoglobin; NLR, neutrophil to lymphocyte ratio; LMR, lymphocyte to monocyte ratio; PLR, platelet to lymphocyte ratio; SII, systemic immune-inflammation index; TP, total protein; ALB, albumin; GLB, globulin; A/G, albumin to globulin ratio; ALT, alanine aminotransferase; AST, aspartate aminotransferase; CR, creatinine; UA, uric acid; CHO, cholesterol; TRIG, triglyceride; LDL, low density lipoprotein; HDL, high density lipoprotein; GLU, glucose.

Visualization of Feature Importance
To visually illustrate the significance of each variable, we employed SHAP values derived from the XGB model. The relationship between SHAP values and model predicted values can be visualized through the color; meanwhile, feature importance ranking can be explained. Figure 2 shows the correlation among each feature importance in summary plot. ALB had the highest importance, closely followed by MONO, HDL-C, and NEUT (Figure 2(A)). These variables were integral to the CRA model. Elevated SHAP values for ALB, NLR, CEA, and LMR (Figure 2(B)) indicated their critical role in the CRC model forecast. Furthermore, additional metrics including TP, PLT, UREA, LYMPH, etc. were also indicated to have a preferable predictive impact on the CRA and CRC forecasting systems. Variable importance in XGB classification for CRA (A) and CRC (B). The rank in A and B indicates the order of feature importance in the XGB models.
Confusion Matrix of Prediction Results of Various Classification Models
Figure 3 depicts the confusion matrices of 4 diagnostic systems for CRA and CRC separately. The confusion matrix visually summarizes the prediction results of classification models and is a standard format for evaluating accuracy. The horizontal axis of the confusion matrix represents the prediction value, and the vertical axis represents the actual value. The DT model shows poor accuracy for CRA detection (Figure 3(C)), with 32 healthy people misclassified as adenoma (32/70). While the remaining 3 models demonstrated good predictive validity, with SVM being most sensitive at identifying adenoma (103/114), and having relatively high specificity and PPV in Figure 3. For CRC, DT classifier performed poorly in the prediction, 11 cancer patients misjudging as healthy individuals (11/62) in Figure 3(G). Compared to DT classifier, the SVM model showed superior detection of cancer (57/62) in Figure 3, the RF model and XGB model had the similar cancer detection (56/62), but RF model was superior to XGB model in distinguishing healthy cohort. Confusion matrix of colorectal adenoma (CRA) and cancer (CRC) models. (A) SVM confusion matrix for CRA. (B) RF confusion matrix for CRA. (C) DT confusion matrix for CRA. (D) XGB confusion matrix for CRA. (E) SVM confusion matrix for CRC. (F) RF confusion matrix for CRC. (G) DT confusion matrix for CRC. (H) XGB confusion matrix for CRC.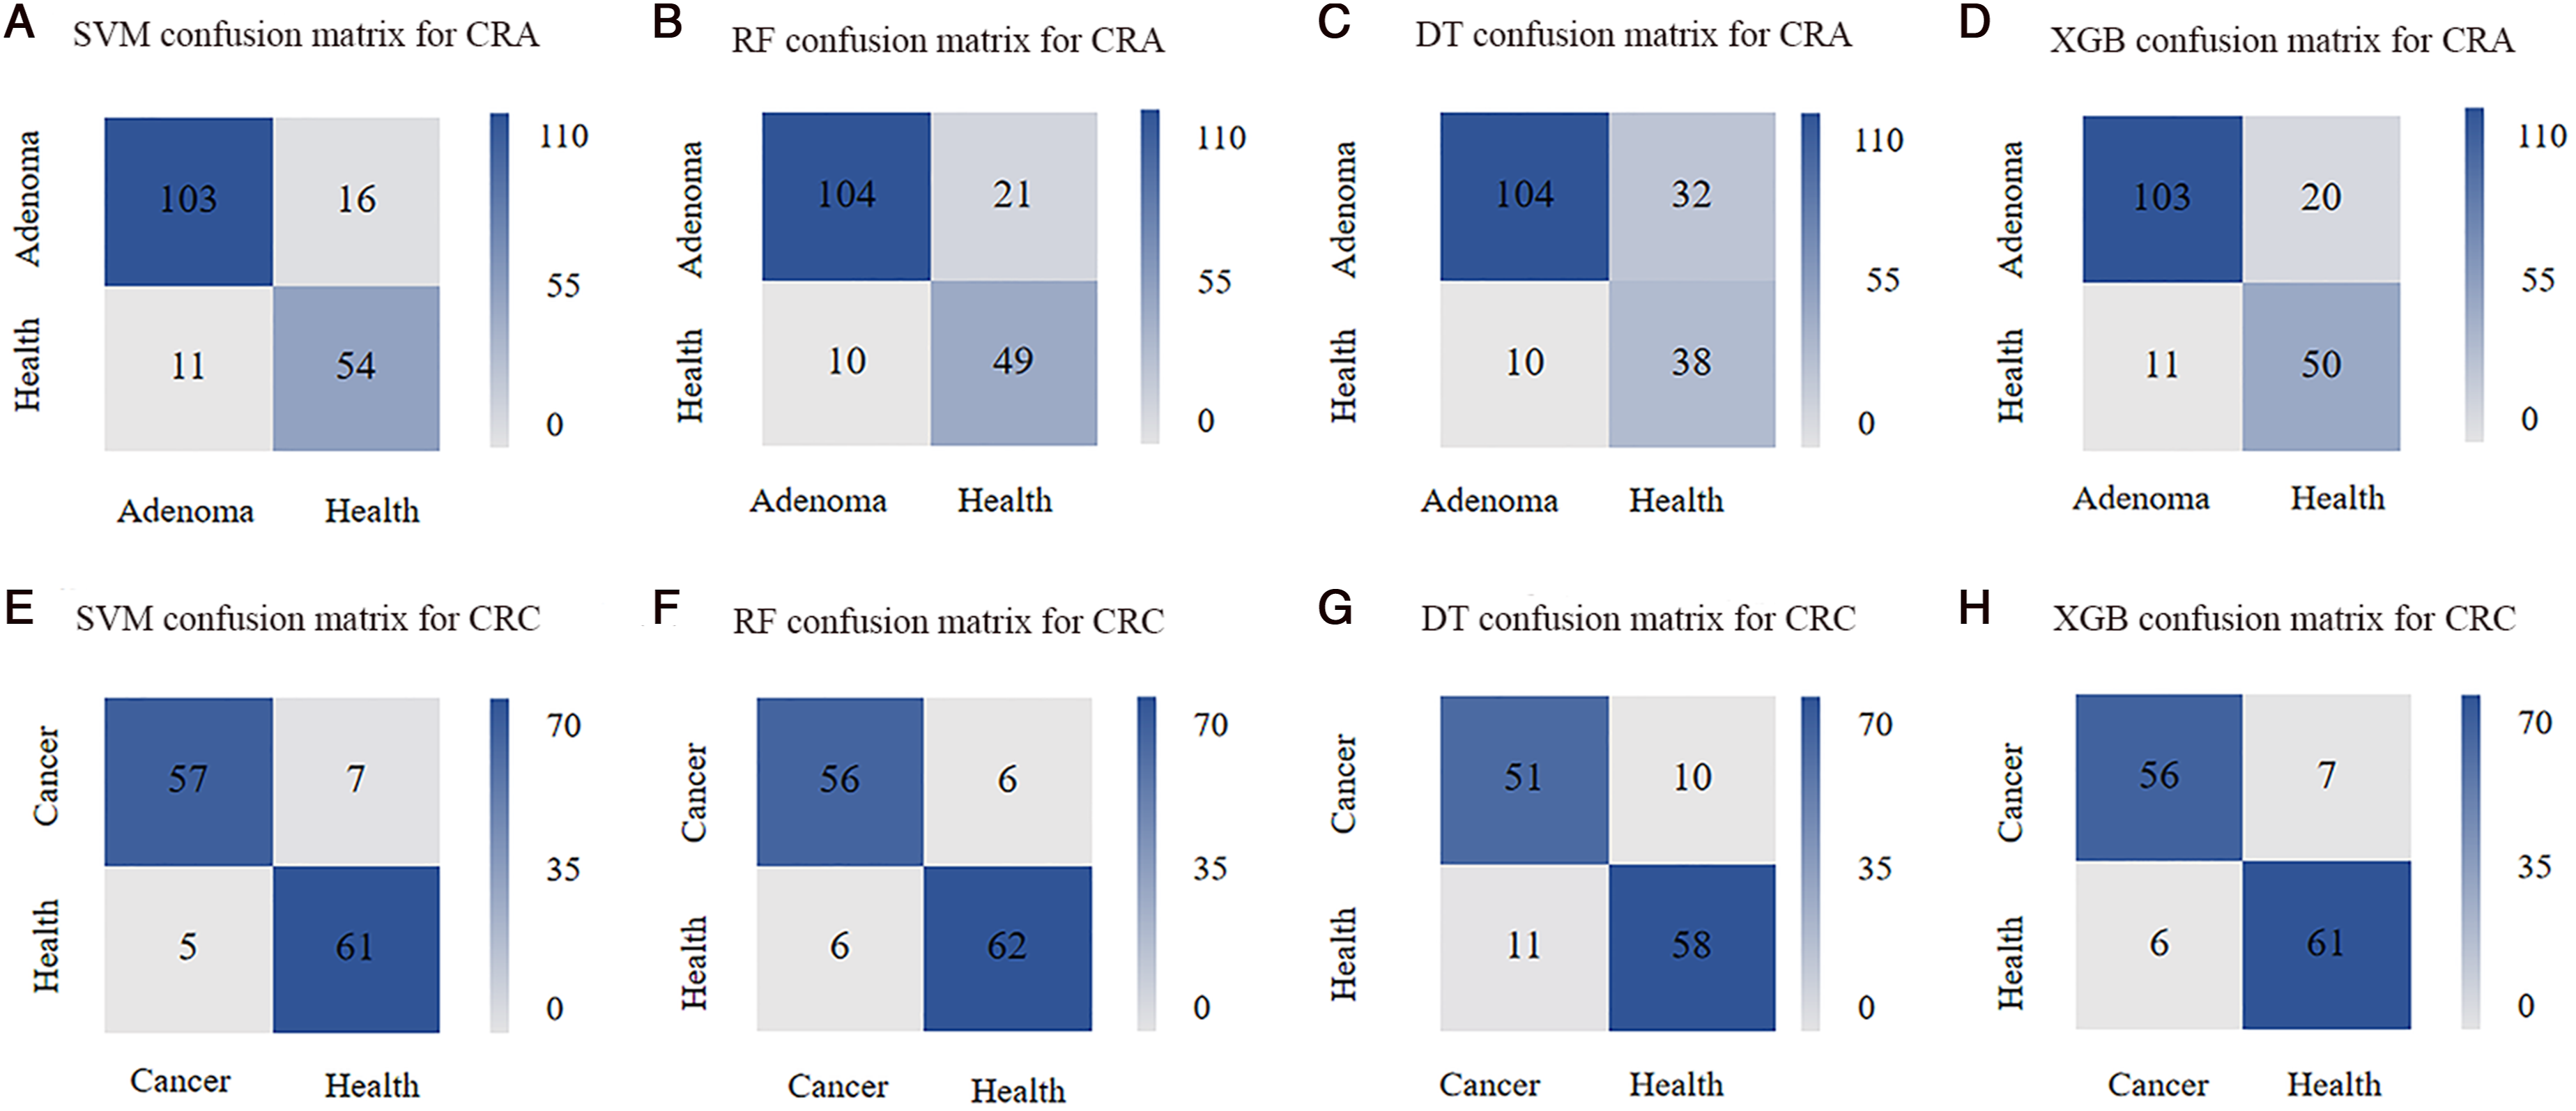
Model Comparisons and Validations of CRA
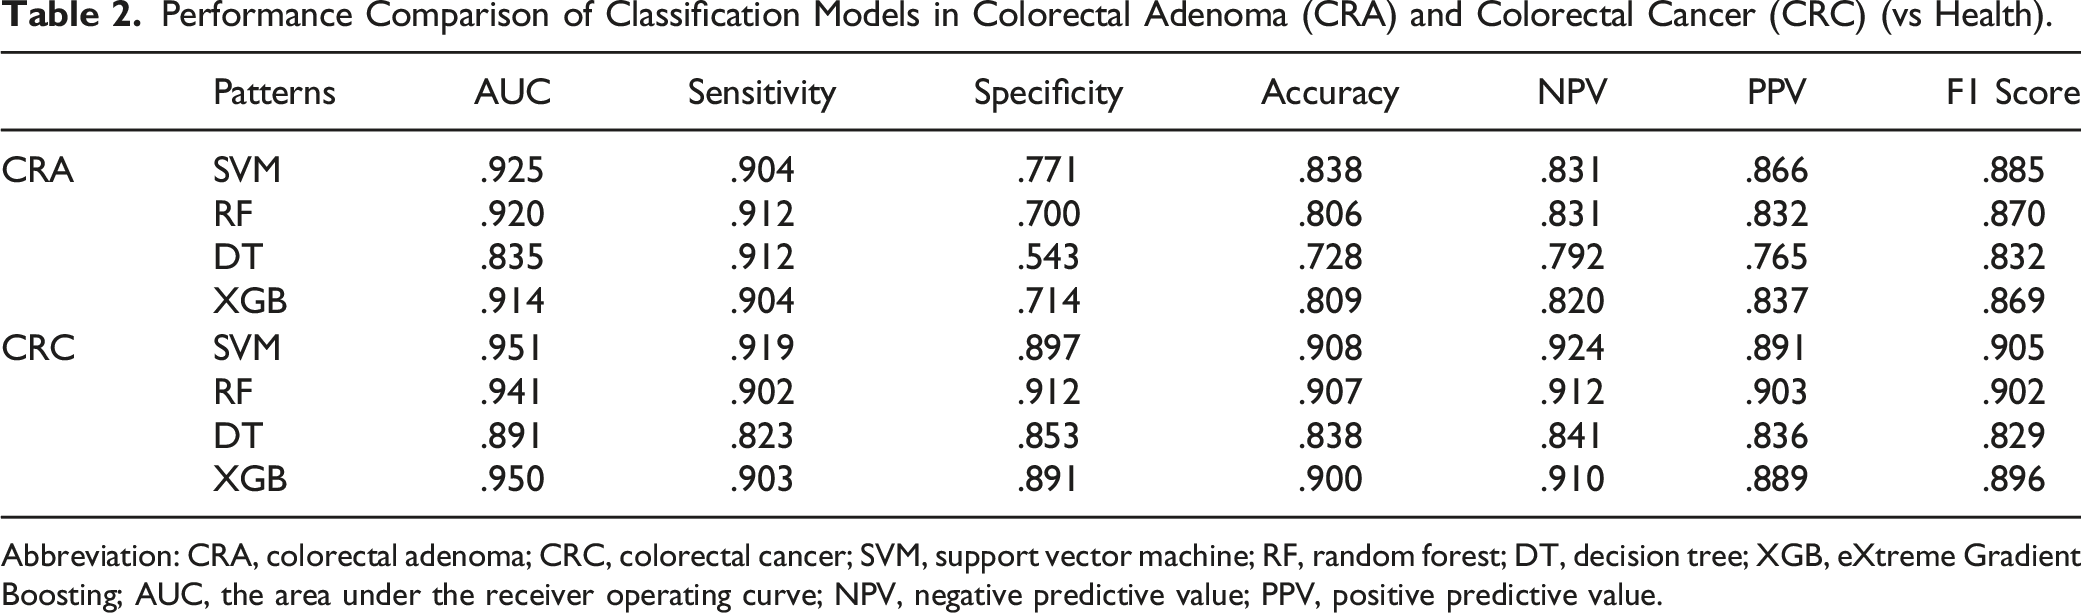
We employed 4 algorithms (RF, DT, SVM, and XGB) to construct predictive models for CRC and CRA detection, leveraging conventional laboratory biomarkers from Shenzhen Luohu People's Hospital. The ROC was used to assess model’s robustness (Figure 4). The sensitivity, specificity, AUC, and other evaluation indicators of testset are reported in Table 2. Compared with ML models, traditional tumor markers have the lowest differential diagnosis ability (AUC for CEA: .530, AFP: .580, CA199: .502, Table S1). The SVM and RF models demonstrated higher accuracy (SVM, .838; RF, .806) and AUC values (SVM, .925; RF, .920) than other approaches. For CRA detection, the SVM model discriminated CRA patients from healthy individuals with an AUC of .925 (.885 to .964), a sensitivity of .904, and a specificity of .771, showing the best performance. In contrast, the decision tree model performed worst among the 4 models, with an AUC of .835 (95% CI: .777–.894), ACC of .728, and specificity of .543. Performance of machine learning models of CRA and CRC. Receiver operating characteristic (ROC) curve for machine learning models of CRA (A), CRC (B), nAA (C), and AA(D) constructed using 26 biomarkers. ROC curve for simplified models of CRA (E) and CRC (F). Performance Comparison of Classification Models in Colorectal Adenoma (CRA) and Colorectal Cancer (CRC) (vs Health). Abbreviation: CRA, colorectal adenoma; CRC, colorectal cancer; SVM, support vector machine; RF, random forest; DT, decision tree; XGB, eXtreme Gradient Boosting; AUC, the area under the receiver operating curve; NPV, negative predictive value; PPV, positive predictive value.
To accurately identify high-risk colorectal adenomas and optimize resource allocation, we utilized our established CRA model to validate its diagnostic efficacy in both AA and nAA populations. Participant characteristics are presented in Table S2, revealing that only CA199 differed between AA and nAA groups, while MONO, PLT, TP, and ALB showed notable distinctions compared to healthy controls and CRC patients. The SVM algorithm showed superior discriminative ability for distinguishing nAA or AA patients from healthy controls (Figure 4(C),(D)), with an AUC of .775, sensitivity of .776, specificity of .774 for nAA, and an AUC of .845, sensitivity of 0827, specificity of .863 for AA (Table S3).
Model Comparisons and Validations of CRC
Table 2 details the multi-model performance for a dataset comprising 204 CRC patients and 229 healthy controls. In the test dataset, conventional serum tumor markers showed inferior quality in CRC recognition (CEA: .762, AFP: .587, CA199: .624, Table S1), with potential for missed or misdiagnosis. In comparison, all ML methods except DT demonstrated superior prediction. Noteworthy, the SVM models had observably superior diagnostic value to distinguish CRC patients from healthy individuals in Figure 4(B), whose AUC, sensitivity, and specificity were .951 (95% CI: .913–.990), .919 and .897, respectively. Moreover, RF model with 26 candidate biomarkers provided excellent predictive capabilities (AUC: .941, sensitivity: .902, specificity: .912), significantly improving over CEA and CA19-9 biomarkers.
To confirm the generality or specificity of the CRA model, we selected other gastrointestinal tumors that are not CRC for next validation, including 60 gastric cancer (GC) and 61 liver cancer (LC) cases. The results showed that the model is not only applicable to CRC, but other gastrointestinal malignancies (Table S4), with the SVM model demonstrating optimal prediction in GC (AUC: .905, sensitivity: .885, specificity: .925) and LC (AUC: .958, sensitivity: .967, specificity: .950). Enhanced predictive ability in LC may be attributed to altered albumin and globulin levels from LC patients.
Model Simplification
To optimize the diagnostic tool, we performed a feature reduction using logistic regression. CEA, HGB, LMR, TG, HDL, and GLU were independent factors for the CRC model, and NEUT, HGB, LMR, SII, A/G, UREA, HDL, and GLU (Table S5) for the CRA model. Simplified model were built with above features, enable easier calculation, and employ by reducing the number of features. Subsequent simplified models, excluding the DT algorithm due to its underwhelming performance, were constructed. Three ML models were respectively plotted in Figure 4 (E and F), from which the ML models showed substantially higher AUC vs tumor markers. For CRA, SVM model with 6 indicators achieved an AUC of .826 and a sensitivity of .864 in Table S6. However, the low specificity (.591) of simplified model precludes clinical application. For CRC reduced model, the RF model also showed excellent predictive value, with the results of the ROC, sensitivity, specificity, accuracy, NPV, PPV, and F1 score were .946, .885, .913, .899, .900, .900, and .892. Overall, the RF model, whether using 26 features or reduced feature, consistently exhibited superior performance, cementing its potential clinical relevance.
Discussion
CRC patients are generally diagnosed at advanced stages, with high tumor load and neurovascular invasion, resulting in short survival times and poor prognosis outcomes. Early detection of lesions, even intercepting disease progression during precancerous phases like CRA or inflammatory bowel disease, could shift the diagnostic window and dramatically alter prognosis. This study leveraged routine laboratory data to develop accurate and reliable ML approach for detecting CRC and CRA. The RF model, integrating 26 candidate biomarkers, had the best performance for CRC, with a sensitivity of .902 and specificity of .912. SVM approach was superior for CRA identification, boasting sensitivity and specificity values of .904 and .771.
Recent advancements in artificial intelligence and ML have revolutionized the medical arena. This technology is efficiently beneficial for researchers to manage vast, fragmented data, unravel intricate feature relationships, and bolster diagnostic capabilities, assisted pathological recognition, and personalized treatments. 28 Table S7 demonstrated the performance of models in previous studies. Yu et al utilized whole slide images (WSI) for accurate recognition of CRC by the semi-supervised learning (SSL) method, and its AUC (.974) was close to that of a human pathologist (.969). 29 Li et al established a CRC model based on the 4 indicators (CEA, HGB, HDL, and Lp(a)) (AUC: .849, sensitivity: .833, specificity: .815), and the results were slightly lower than ours. 30 In the study by Mark C et al, CRC detection model had lower performance in sigmoid colon and rectum cancer and had the highest accuracy for detecting right-sided CRC. 31 Cui et al proposed that a method based on important serum proteins could be a sensitive and non-invasive tool for a SVM model to predict CRC with an AUC of .933. 32 Pawelka D et al found that a two-class Bayes Point Machine based on miRNA expression profiles has the potential to diagnose and prognosis. 33 Wan et al predicted early CRC using 2 classification methods (LR and SVM) and secured good results. 34 A comparison with existing models accentuates our model's cost-effectiveness utilizing routinely accessible blood indicators, while maintaining remarkable sensitivity and accuracy.
At present, the main diagnostic methods for CRC are colonoscopy and pathology, which are highly invasive and may cause complications. Actually, patients underwent a large number of laboratory tests during physical examination or hospitalization, such as blood routine and tumor markers, which might reflect the disease status immediately and guide CRC detection and treatment strategies. CEA and CA199 have been identified as CRC biomarkers for predicting treatment response and monitoring progression or recurrence. 29 Tumor-associated inflammation has drawn more attention, with inflammatory cells and mediators comprising the tumor microenvironment. Similarly, indicators like NEUT, PLT, PLR, and NLR, reflecting localized immune and systemic inflammatory responses, are relevant to CRC prognosis. 35 Various cytokines produced by leukocytes can facilitate the proliferation and metastasis of tumor cells. Some sufferers may have anemia symptoms such as lower hemoglobin and physical emaciation due to gastrointestinal bleeding, tumor invasion, and tumor-associated inflammatory cytokines. 36 ALB levels may be elevated, GLB levels may be reduced, and A/G may be inverted because of self-consumption of CRC patients. The changes in AFP, ALT, and AST may indicate severely impaired liver function. Kim YR et al found that elevated UA and lowered ALB and GLB correlated with cancer risk, possibly from oxidative stress, which had the capability to lead to DNA breakage and point mutation. 37 The epidemiological data indicated that a high-fat diet, low-fiber diet, and diabetes mellitus are correlated with a greater CRC risk.38,39 The disorder of lipid metabolism levels caused by inflammation, oxidative stress, and insulin resistance, including TG, LDL, and HDL, may be closely associated with the occurrence of gastrointestinal malignancies. 40 The previous studies revealed that serum HDL-C levels are reduced in patients with CRC. 41 All these data are readily available through clinical laboratories.
In this study, we developed innovative predictive models for CRC and CRA via selected biomarkers using 3 ML models. The CRA simplified model (Table S6) has lower performance than SVM model based on 26 multi-targets panel (sensitivity: .904 vs .864, specificity: .771 vs .591 and AUC of CRA: .925 vs .826). Due to poorer performance, the CRA simplified model was unqualified. Compared with models built with 26 indicators (Table 2), there is no obvious decrease in these 2 performance assessments of sensitivity (RF model of CRC: .902 vs .885), specificity (RF model of CRC: 0912 vs .913), and AUC (model of CRC: .941 vs .946). Notably, our CRC simplified model, with fewer indicators, did not exhibit a substantial decline in performance metrics, presenting a more practical option for clinical applications. However, the models were not specific and based exclusively on routine tests, which could not distinguish CRC from other cancers, warranting specialized inspections for abnormal results. Finally, we assessed against the SVM model with GC and LC lab data, yielded AUCs of .905 and .958, respectively, indicating its potential utility in detecting other gastrointestinal malignancies. We will continue to expand the sample size for other cancers in our follow-up studies to ascertain the cancer model’s universal and applicable.
The heightened prevalence of CRC in seniors and males can be attributed to lifestyle and other known risk factors. Besides, Xu et al revealed the effect of androgen on promoting proliferation and inhibiting differentiation of intestinal stem cells by targeting androgen receptors in intestinal stromal cells to negatively regulate BMP pathways. 42 The study provided a feasible interpretation for the higher incidence of CRC in males. Furthermore, prior researches found that CRC etiology involves multifaceted interactions between environmental triggers, genetic predispositions, and other high-risk factors. A high-fat diet and low-fiber diet correlates with a greater risk of CRC. Our ML models are instrumental for early screening and diagnosis due to their exemplary predictive capacities. The model appeared superior accuracy for colon cancer over rectal cancer and excelled in diagnosing advanced stages (Figure S1), and there was no discernible difference between the gender and age groups (Figure S2). Sensitivity generally increases with tumor stage. There was no significant difference in age, probably because the age groups were not more definite. The high accuracy of colon cancer may be due to the fact that colon cancer has a higher morbidity than rectal cancer. 43 CRC patients at late stages are easier to detect based on clinical blood markers on account of symptoms such as anemia, weight loss, and apparent metabolic disorders. Although the performance of the simple model for early-stage cancer is slightly lower than that for late-stage cancer, the value of the diagnosis is still not negligible.
There are several limitations to our study. (1) Although we used the median value to compensate for missing data for a few patients, it may introduce bias in the prediction results. (2) This study's small sample size, encompassing only Shenzhen Luohu People's Hospital, limits its generalizability. (3) Furthermore, while our models serve as robust clinical aids, they cannot supersede colonoscopy and pathological examination. In the end, the results future endeavors require further multi-center, large sample prospective study to confirm findings.
Conclusion
In our investigation, 4 ML models were constructed and compared, leveraging routine clinical data to predict CRA and CRC. Our results highlight the SVM model, incorporating 26 characteristics demonstrated the best performance in both CRA and CRC prediction. In addition, for the simplified CRC model, RF algorithm outperformed its counterparts. Summing up the above, compared with other models, the RF emerges as a potentially non-invasive, straightforward, and robust tool for cancer detection.
Supplemental Material
Supplemental Material - Blood Biomarkers Panels for Screening of Colorectal Cancer and Adenoma on a Machine Learning-Assisted Detection Platform
Supplemental Material for Blood Biomarkers Panels for Screening of Colorectal Cancer and Adenoma on a Machine Learning-Assisted Detection Platform by Hui Wang, Zhiwei Zhou, Haijun Li, Weiguang Xiang, Yilin Lan, Xiaowen Dou, and Xiuming Zhang in Cancer Control
Footnotes
Declaration of Conflicting Interests
The author(s) declared no potential conflicts of interest with respect to the research, authorship, and/or publication of this article.
Funding
The author(s) disclosed receipt of the following financial support for the research, authorship, and/or publication of this article: This work was supported by the Shenzhen Fundamental Research Program [No. JCYJ20190812171215641] and Shenzhen Key Medical Discipline [No. SZXK054].
Ethical Statement
Data Availability Statement
Supplemental Material
Supplemental material for this article is available online.
Appendix
References
Supplementary Material
Please find the following supplemental material available below.
For Open Access articles published under a Creative Commons License, all supplemental material carries the same license as the article it is associated with.
For non-Open Access articles published, all supplemental material carries a non-exclusive license, and permission requests for re-use of supplemental material or any part of supplemental material shall be sent directly to the copyright owner as specified in the copyright notice associated with the article.