
Abstract
Background
Tumor markers (TMs) are important for the prognosis of gastric cancer (GC). However, the prognostic importance of the tumor marker index (TMI) based on GC-specific TMs for advanced gastric cancer (AGC) still needs to be further explored.
Methods
We retrospectively examined patients who underwent radical gastric cancer surgery between February 2014 and June 2016 at the Department of Gastroenterological Surgery, Affiliated Cancer Hospital, Harbin Medical University. The patients were divided into training and validation groups. TMI was determined as the geometric mean of the standard cancer antigen 19-9 (CA19-9) and carcinoembryonic antigen (CEA) levels. Patient overall survival was assessed using the Kaplan–Meier method. Independent prognosis-associated risk factors were identified using Cox hazard regression models. A nomogram model incorporating TMI and clinicopathological factors was developed, and its performance was evaluated using a decision curve analysis, concordance index, and calibration plots.
Results
In the TMI training cohort, the cutoff value was set at .439, categorizing patients into TMI-High and TMI-Low groups. The 5-year survival rate in the TMI-Low group significantly surpassed that in the TMI-High group (78.2% vs 58.1% and 49.7 vs 41.6, P < .001). TMI emerged as an independent prognostic factor. The nomogram accurately predicted patient prognosis by using TMI and clinicopathological characteristics. Validation of the TMI in the independent cohort yielded satisfactory results.
Conclusion
The TMI constructed based on specific TMs associated with gastric cancer can offer a precise prognostic prediction for patients.
Keywords
Introduction
According to current cancer statistics, gastric cancer (GC) ranks as the fourth most common malignant tumor worldwide, accounting for over 780,000 deaths annually. It stands as the second leading cause of cancer-related deaths.1,2 Particularly, a significant burden in China is reported, with its new GC cases constituting about 44% of global total each year and nearly half of the global GC-associated mortalities.3,4 Due to the lack of specific early-stage symptoms, the identification rate of early gastric cancer (EGC) is poor in China. Therefore, advanced gastric cancer (AGC) remains the dominant subtype in China, comprising over 80% of GC cases, and the 5-year survival rate for these cases is below 30%.5–7 This scenario exerts considerable public health strain in China, improving the prognosis of AGC as a critical research topic.
Tumor markers (TMs) are biochemical substances abnormally produced or elevated in response to the emergence, progression, invasion, and metastasis of malignant tumors. These markers reflect the distinctive characteristics of tumor cells. The first such discovery was the carcinoembryonic antigen (CEA) in colon cancer specimens by Gold and Freedman in 1965. Since then, a multitude of TMs, including cancer antigen 19-9 (CA19-9) for rectal cancer, cancer antigen 72-4 (CA72-4) which recognizes mouse epitopes, and cancer antigen 12-5 (CA12-5) for ovarian cancer, have been identified.8–12 These TMs are routinely used to diagnose specific patient populations and monitor tumor dynamics. Notably, CEA, CA19-9, and CA72-4 are associated with the onset, progression, and recurrence of GC,13,14 and the TM level in patients with GC correlates positively with the pTNM stage, 15 which suggests that TMs can be utilized to assess the prognosis of patients with AGC. However, given the marked heterogeneity of GC, the diagnostic efficacy and predictive capabilities of TMs might vary among patients with GC. 16 Muley et al. 17 initially proposed a tumor marker index (TMI), derived from the geometric mean of CEA and serum cytokeratin 211 (CYFRA 21-1) concentrations, for non-small cell lung cancer (NSCLC). This TMI showcased superior predictive accuracy compared to individual TMs, particularly in estimating the prognosis of patients with stage I NSCLC. Subsequently, Qiao et al. 18 integrated SCC and CYFRA 21-1 to develop a TMI and further incorporated fibrinogen to construct the F-TMI, widely used in esophageal squamous cell carcinoma (ESCC) prognosis. These advancements underline that TMIs, tailored to specific tumor types, can enhance predictive performance and prognostic precision while providing a more comprehensive evaluation of the degree of tumor activity. However, the role of TMI in AGC remains under-researched, emphasizing the need to investigate its clinical relevance and prognostic value.
Between February 2014 and June 2016, we conducted a study on patients with AGC who underwent major surgical procedures at the Department of Gastrointestinal Surgery, Harbin Medical University Affiliated Cancer Hospital. This study aimed to evaluate the predictive performance of TMs including CEA, CA19-9, CA72-4, and CA12-5. Based on these evaluations, a TMI was developed, and its clinical utility was assessed. Subsequently, a nomogram prediction model was constructed, incorporating both the TMI and the clinicopathological features of the patients.
Materials and Methods
Patients
Between February 2014 and June 2016, we conducted a retrospective review of patients who underwent radical GC surgery at the Department of Gastrointestinal Surgery, Affiliated Cancer Hospital of Harbin Medical University. These patients were subsequently divided into training and validation cohorts. The diagnosis of GC was established using tissue samples obtained through preoperative gastroscopy. Standard preoperative assessments included chest computed tomography (CT), abdominal CT, echocardiogram, ultrasound of the supraclavicular lymph nodes, electrocardiogram, gastroscopy, hematological tests, and TMs.
Patients were excluded from the study based on the following criteria: (1) preoperative radiation and chemotherapy; (2) previous history of other malignant tumors; and (3) hepatic and renal insufficiency.
Clinicopathological Data
Collected clinicopathological data encompassed sex, age, TMs, tumor diameter, tumor location, histological type, pTNM stage, presence of nerve invasion, vein invasion, and postoperative chemotherapy. Surgical procedures and postoperative chemotherapy regimens adhered to the Japanese GC treatment guidelines.19,20 This study conforms to the REporting recommendations for Tumor MARKer prognostic studies (REMARK) criteria. 21 All patient details in this study were de-identified. The study included only 500 patients who received complete chemotherapy at our institution.
Hematology Sample
For each participating patient, hematological samples were collected one week before the surgery during a fasting state. Serum CEA, CA19-9, CA12-5, and CA72-4 levels were measured using enzyme immunoassays on a Cobas Core analyzer in a clinical laboratory setting. The established upper normal limits for CEA, CA19-9, CA12-5, and CA72-4 were 5 ng/mL, 37 U/mL, 35 U/mL, and 6.9 U/mL, respectively.
Construction of the TMI
The calculation method for TMI was proposed by Muley et al.
17
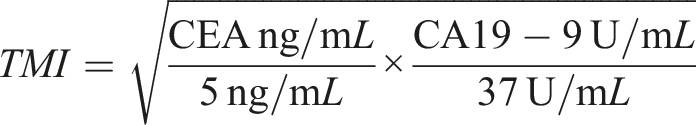
For NSCLC, the TMI is derived from the arithmetic square root of the geometric mean of SCC and CYFRA 21-1 concentrations. In our study, selection of specific TMs was based on receiver operating characteristic (ROC) curve analysis. This analysis indicated that CEA and CA19-9 exhibited superior predictive performance compared to CA72-4 and CA12-5. Consequently, the TMI was constructed using the geometric mean of normalized serum concentrations of CEA and CA19-9. Normalization was achieved by dividing the individual marker levels by their diagnostic cutoff values: 5 ng/mL for CEA and 37 U/mL for CA19-9. The TMI was calculated as the square root of the product of CEA concentration/5 ng/mL and CA19-9 concentration/37 U/mL. The cutoff value with the optimal predictive performance was selected for the grouping: TMI values below this cutoff were classified into the low group, while those above were designated to the high group.
Statistical Analysis
To evaluate the prognostic efficacy of different TMs, the area under the curve (AUC) of the ROC curve was computed. The optimal cutoff value was identified using the Youden index. For the time-independent ROC (T-ROC) analysis, the R package time ROC was employed. The chi-square test assessed the association between patient characteristics and TMI. Overall survival rates were determined using the Kaplan–Meier approach. Overall survival (OS) was defined as the duration from the surgery date to the date of death from any cause, and it was characterized using the 5-year survival rate and mean. Cox proportional hazards regression models evaluated independent risk factors impacting patient prognosis, providing hazard ratios (HRs) and 95% confidence intervals (CIs).The R programming language facilitated the creation of the nomogram. Calibration plots, constructed using Hosmer’s goodness-of-fit test, illustrated the relationship between the predicted probabilities and observed outcomes. The nomogram’s accuracy was gauged using a consistency index, while decision curves constructed the predictive ability of the nomograms. All statistical analyses were conducted using SPSS for Windows (version 26.0, IBM; Armonk, NY, USA) and R software (version 4.1.2, R Foundation for Statistical Computing, Vienna, Austria). A P-value of less than .05 was considered statistically significant.
Results
Patient Characteristics
Basic Characteristics of Patients.

P values < 0.05.
The validation group included 290 patients (Table 1), consisting of 207 men (71.4%) and 83 women (28.6%), with an average age of 59 years, ranging from 31 to 85 years. According to pTNM stage, 37 (12.8%), 110 (37.9%), and 143 (49.3%) patients were stage Ⅰ, Ⅱ, and Ⅲ, respectively.
Construction and Evaluation of TMI’s Predictive Performance
In the training cohort, the ROC analysis of tumor markers revealed AUC values of .611 (95% CI: .560–.662) for CEA, .606 (95% CI: .558–.654) for CA19-9, .531 (95% CI: .481–.581) for CA72-4, and .537 (95% CI: .489–.586) for CA12-5. Owing to their superior AUCs, CEA and CA19-9 were chosen to construct the tumor marker index (TMI). The resulting AUC for TMI was .660 (95% CI: .612–.707) (Figure 1(A)). Further, time-dependent ROC (T-ROC) analysis revealed peak AUC values for TMI of .615 at one year and .662 at three years (Figure 1(C)). The optimal cut off for TMI, as determined by the ROC curve, was .439. This led to classifying 404 patients (63.5%) as TMI-Low and 232 patients (36.5%) as TMI-High. ROC and T-ROC curve of TMI, CEA, CA19-9, CA72-4, and CA12-5 level among total patients: (A) training cohort and (B) validation cohort.
Subsequent validation in an independent cohort reaffirmed TMI’s robustness. The ROC curve in this cohort exhibited a peak AUC of .628 (95% CI: .561–.695) for TMI (Figure 1(B)). The T-ROC analysis further accentuated the model’s performance with the highest AUCs for TMI recorded as .738 at 1 year and .698 at 3 years (Figure 1(D)).
The Effect of TMI on Prognosis
Chi-Square Analysis of Patient Characteristics and TMI.
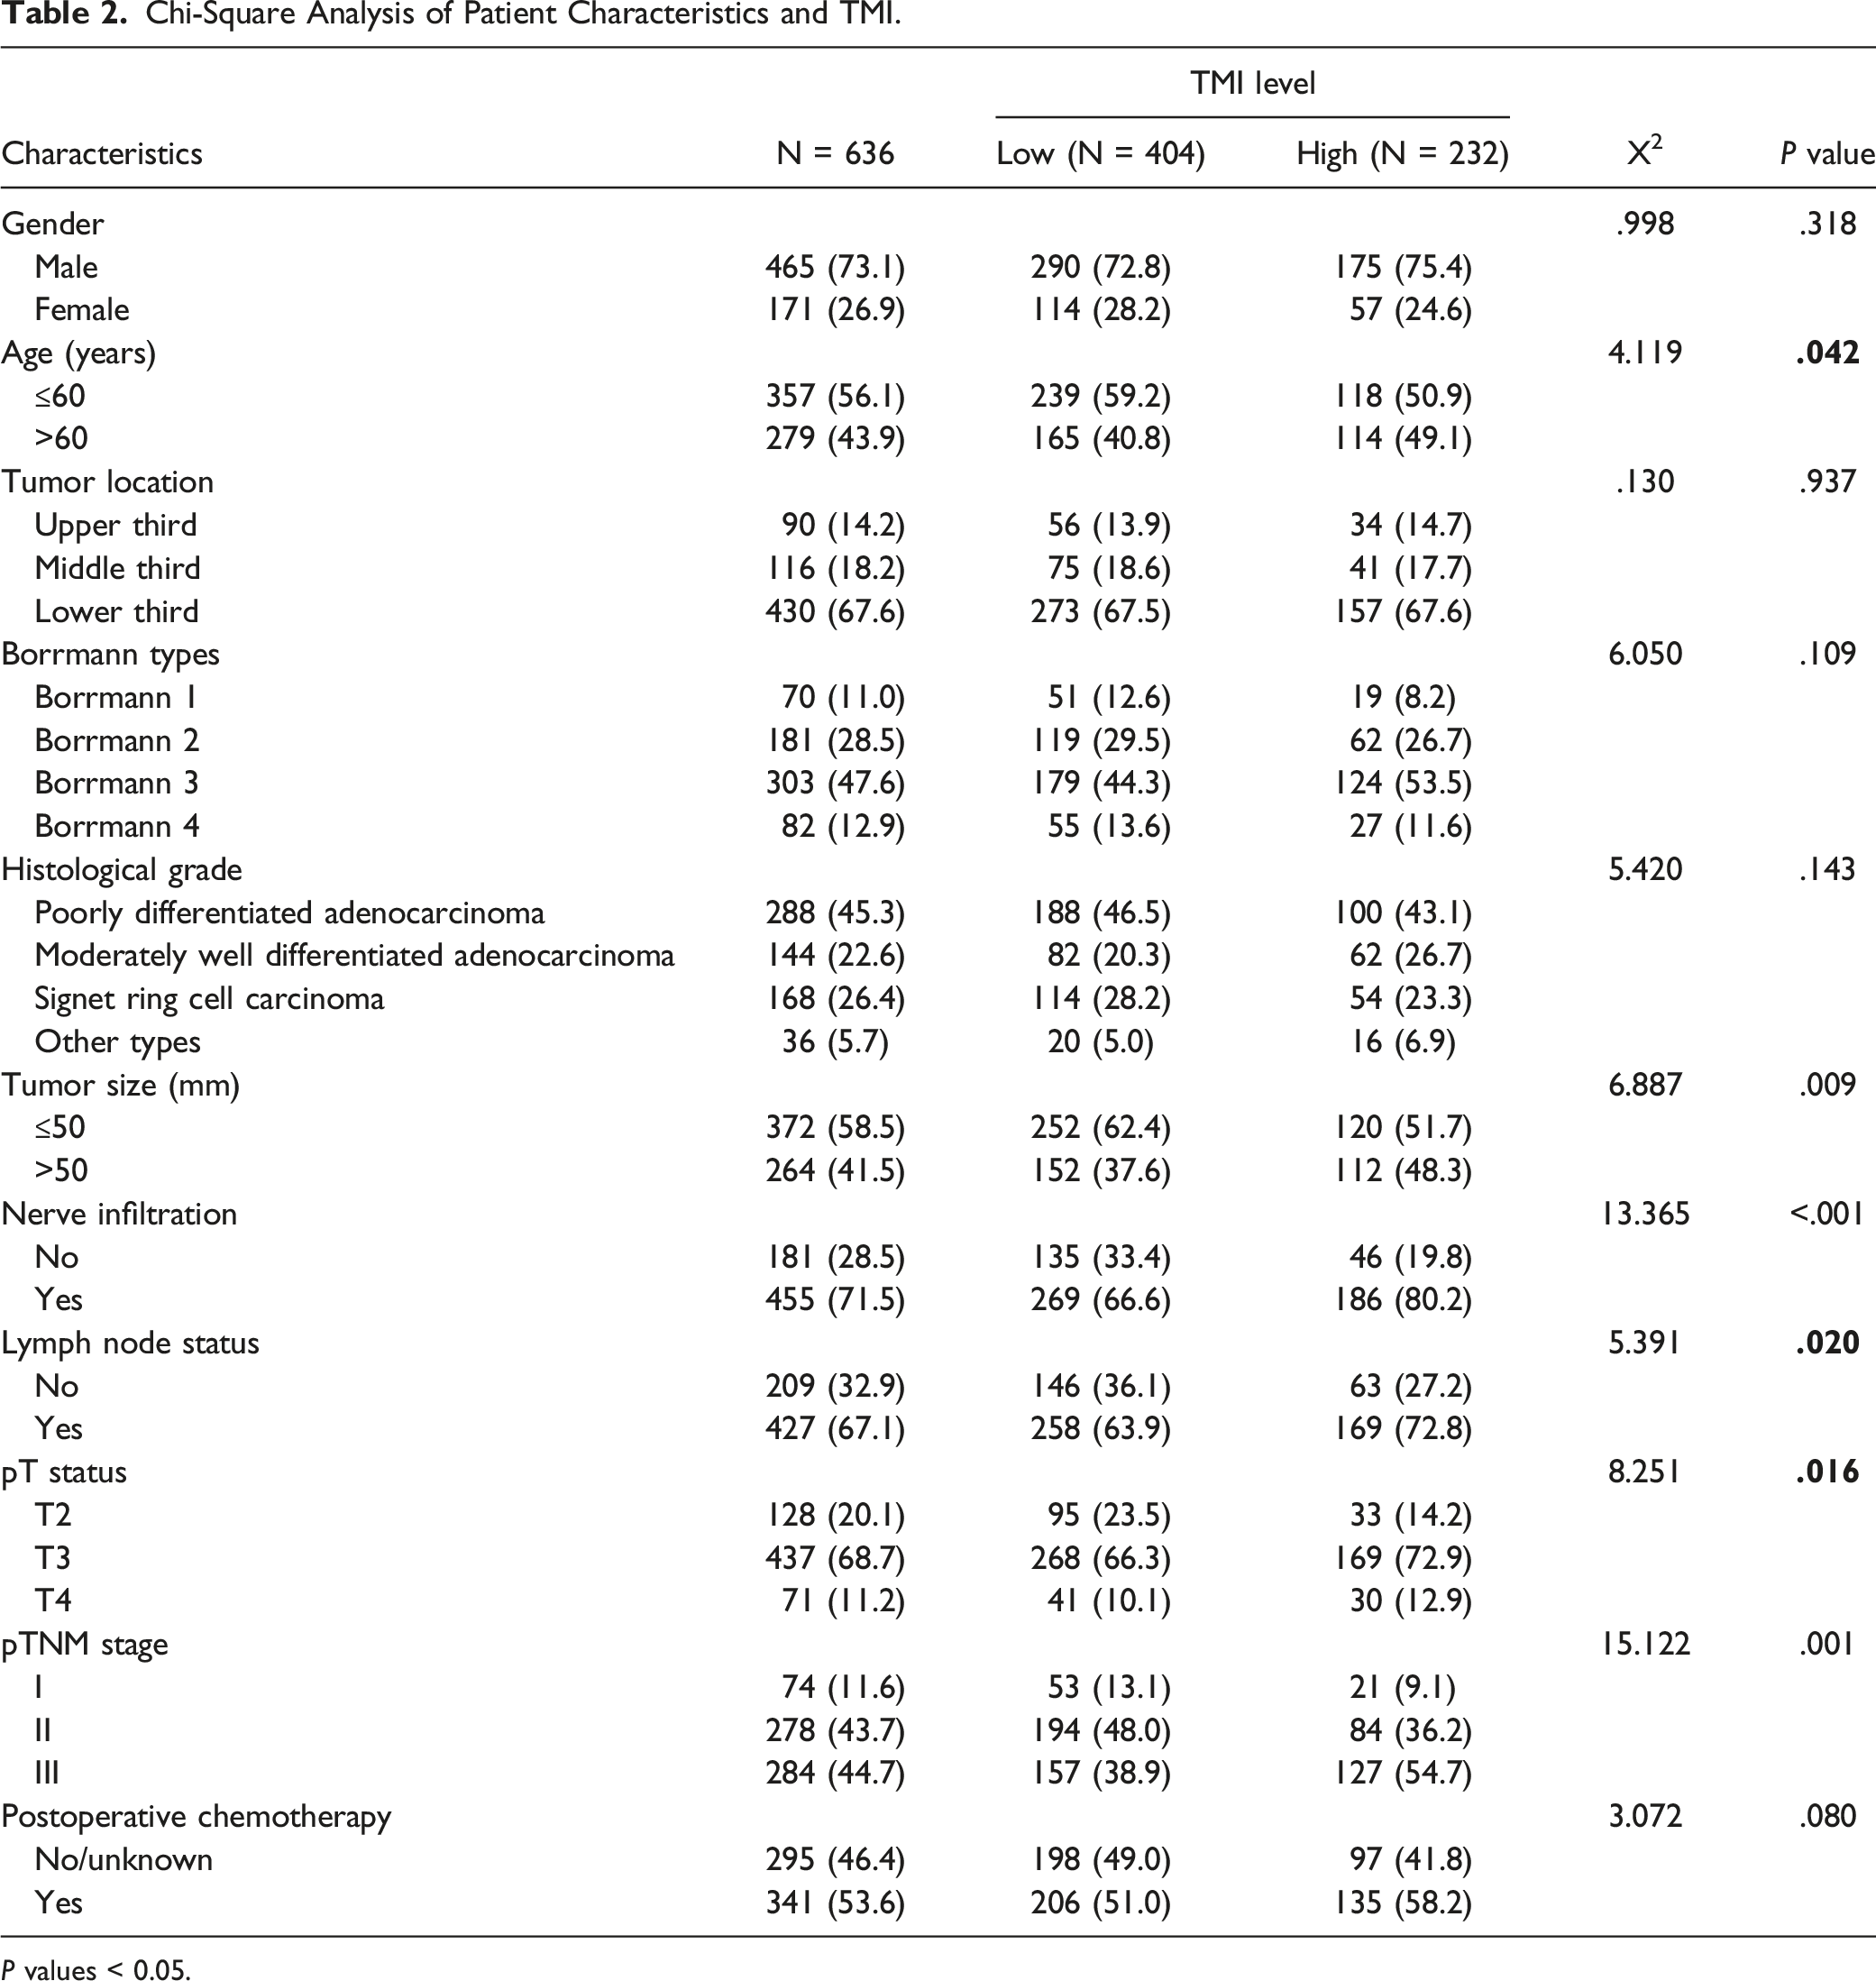
P values < 0.05.

Patient survival curve analysis: (A-D) patient survival curves based on TMI in training cohort at whole stage, stage I, stage II, and stage III and (E) patient survival curves based on TMI in validation cohort at whole stage.
Contrastingly, in the validation set, a pronounced enhancement in the 5-year survival rate was observed in the TMI-Low group, standing at 69.7% compared with 50.1% in the TMI-High group (with means of 46.8 vs 36.3, respectively, P < .001) (Figure 2(E)).
The Impact of TMI on Postoperative Chemotherapy
In the training cohort, patients treated with postoperative adjuvant chemotherapy for stages II and III showed a significantly higher 5-year survival rate compared with their non-treated counterparts. This difference was primarily pronounced in the TMI-High group (61.1% vs 41.9% and 44.7 vs 34.4, respectively) (P = .001) (Figure 3(A)-(B)). However, the TMI-Low group did not exhibit a similar trend (P = .490) (Figure 3(A)-(B)). The effect of chemotherapy on survival in TMI-High and TMI-Low patients: (A-B) training cohort and (C-D) validation cohort. (A) and (C): TMI-High. (B) and (D): TMI-Low.
In the validation cohort, patients with TMI-High who received postoperative chemotherapy distinctly outperformed those who abstained, with 5-year survival rates standing at 52.6% vs 35.6% (37.3 vs 30.7, P = .030). Conversely, such a difference was absent in the TMI-Low segment (P = .662) (Figure 3(C)-(D)).
Univariate and Multivariate Analyses
Patients Prognostic Factors Using Cox Regression Analysis in Univariate and Multivariate Analyses.

P values < 0.05.
Nomogram for Predicting Patient Prognosis
In the training cohort, we incorporated the pTNM stage, Borrmann tumor stage, and TMI, identified as distinct risk factors for prognosis, into a prognostic nomogram (Figure 4(A)). The accuracy of this nomogram in predicting the 3-year and 5-year OS rates is reflected in AUC values of .791 (95% CI: .750–.833) and .767 (95% CI: .725–.809), respectively (Figure 4(B)-(C)). An assessment of its predictive power yielded a C-index of .734 (Figure 5(A)). Calibration plots confirmed the nomogram’s aptitude in predicting the 3-year and 5-year OS (Figure 6(A)-(B)). Further, the decision curve analysis indicated the nomogram’s superior net benefit over pTNM staging within the relevant threshold range (Figure 7(A)-(B)). When applied to a validation cohort, the nomogram maintained its predictive integrity. The corresponding AUCs for the 3- and 5-year OS predictions stood at .777 (95% CI: .720–.835) and .755 (95% CI: .666–.813) (Figure 4(D)-(E)), with a C-index of .723 for the entire patient group (Figure 5(B)). Calibration plots further attested to the nomogram’s capability in projecting the 3- and 5-year OS rates (Figure 6(C)-(D)). Notably, across all thresholds, the decision curve revealed the nomogram’s net benefit to exceed that of the pTNM stage (Figure 7(C)-(D)). Established nomogram model and forecast of the 3- and 5-year survival: (B-C) training cohort and (D-E) validation cohort. The C-index of total patients: (A) training cohort and (B) validation cohort. The calibration chart of nomogram predicting 3-year and 5-year prognosis among whole patients: (A-B) training cohort and (C-D) validation cohort. The decision curve analysis of nomogram and pTNM in 3-year and 5-year among whole patients: (A-B) training cohort and (C-D) validation cohort.


These findings demonstrate that the nomogram created using the TMI and clinicopathological traits of patients may reliably predict patient prognosis. The nomogram was validated and found suitable for clinical use.
Discussion
While recent advancements in China have enhanced the detection rates for EGC, the AGC remains predominant with a 5-year survival rate lingering below 30%.5–7 A preceding meta-analysis indicated that TM positivity rate is notably high in AGC and escalates with the advancing stage. Nevertheless, the positive rate for various TMs in stage III GC stands at merely 30%, indicating a deficiency in addressing clinical demands. 15 Recently, Muley et al. 17 successfully applied the TMI constructed by CEA and CYFRA 21-1 in NSCLC to improve predictive performance and prognostic evaluation accuracy. However, the sensitivity of TMs varies according to the tumor tissue. Therefore, our choice was tailored to the more specific TMs associated with GC. Consequently, our findings affirm that the TMI, constructed using CEA and CA19-9, offers enhanced clinical utility, serving as a reliable tool to assess the prognosis of patients with AGC.
Serum TMs offer the dual advantages of simplicity and accessibility, with patients commonly undergoing these tests prior to surgical interventions. Given the pronounced heterogeneity characterizing GC, distinct TMs in GC manifest varying predictive efficacies.13–15 Furthermore a definitive, specific TM for GC remains elusive, 22 and the practical utility of many TMs is often curtailed by the tumor’s activity level. For instance, while EGC typically presents with inconspicuous TM elevations, AGC is frequently associated with substantial increases. 23 According to this study, the AUCs of CA19-9 and CEA surpassed those of CA72-4 and CA12-5, a finding contrasting that of Yang et al. 24 This discrepancy potentially stems from patient heterogeneity. Research highlights that TM levels can be influenced by age 25 and that the expression and activity of transforming growth factor β (TGF-β) amplify in younger patients, subsequently enhancing the expression of Smads factors. 26 The TGF-β plays pivotal roles across a spectrum of biological processes, including cancer progression, embryonic development, extracellular matrix synthesis, cell proliferation, and differentiation. 27 Additionally, TGF-β, in conjunction with Smad3, modulates the transcription and secretion of CEA. Given that our study predominantly featured patients below the age of 60 and considering that GC exhibits more aggressive tendencies in younger demographics, the heightened specificity of CEA in our sample becomes comprehensible. During local cancer progression, the unchecked proliferation of cancer cells, coupled with diminishing oxygen supply, results in an imbalance between oxygen supply and consumption, intensifying local hypoxia.28,29 Kannagi et al. suggested a strong correlation between GC’s invasion depth and the CA19-9 level. As the tumor invasiveness deepens, the local oxygen content gradually decreases and promotes the transcription of sugar genes synthesized by CA19-9, leading to its surge. 30 However, the present study included only AGC, and its degree of hypoxia was higher than that of the early GC, and found that CA19-9 had a higher predictive performance. The prognosis of patients with AGC may be assessed using CA19-9, which suggests that selecting appropriate TMs according to patient characteristics can improve prediction accuracy.
In addition to patient heterogeneity, there are differences in TM sensitivity and predictive performance between patients from different regions. Studies in northeastern and southern China showed that the sensitivity of CEA in the diagnosis of GC was 49.6% and 34.78%, respectively, and that of CA19-9 was 49.6% and 52.61%, respectively.31,32 We consider that the difference in sensitivity and predictive performance of TMs in different regions may be affected by diet. 33 The dietary habits of Northeast China and South China are different. The northeastern region is dominated by a high-salt pickled diet, whereas the southern region prefers a light diet. A diet high in salt not only fosters Helicobacter pylori infections but could also instigate shifts in the gut microbiome. The intertwined relationship between the intestinal microflora and the human immune system has implications for tumor growth and progression.34,35 In addition, the economic disparities further complicate this landscape. Northeast China being relatively less affluent, only few people routinely undergo gastroscopic physical examination. Consequently, a larger proportion of patients in this region present with aggressive forms of AGC. These regional variations in GC activity could feasibly account for the observed differences in the predictive performance and sensitivity of TMs. Positioned in Northeast China, our institution has identified CEA and CA19-9 as high-performing predictive TMs, which is consistent with Fang’s study. 31 Our results also suggest that the selection of specific TMs according to the region is helpful to more precisely forecast patient prognosis and evaluate the biological behavior of tumors. This approach is cost-effective and optimizes the sensitivity and specificity of disease diagnosis and screening. Furthermore, it provides invaluable insights that can guide therapeutic strategies, ultimately translating to better patient care.
TMs are significantly related to the prognosis of patients with GC. Several studies have shown that an increase in tumor markers corresponds to a deteriorated prognosis with the aggravation of pTNM stage.36–39 In addition, Sun et al. found that chemotherapy significantly reduced tumor marker levels, 40 whereas Jin Moriyama et al. observed a surge in TM levels concurrent with GC recurrence. 41 Collectively, these revelations affirm the pivotal role of TMs in the realm of GC. However, the inherent heterogeneity of GC, owing to its aggressive malignant nature, poses challenges. Singular reliance on TMs to project prognosis of GC often leads to a prediction bias. Therefore, we used tumor markers in combination and found that the combined marker index was superior to that of the tumor markers alone. Therefore, it is feasible to use a tumor marker index to evaluate patient prognosis. Muley et al. constructed a TMI based on blood TM levels in patients with NSCLC, which can correctly predict a patient’s prognosis for stage I NSCLC, and found that higher TM levels are often related to later pT stage, pTNM stage, and lymph node metastasis. 17 We constructed a GC-specific TMI. A compelling finding from our study was the ascending proportion of patients in the TMI-High category, concurrent with the increase of tumor aggressiveness. Moreover, a comparison of AUC values underscored the enhanced predictive potential of TMI vis-à-vis singular TMs. Notably, patients stratified into the TMI-High cohort had a pronouncedly dismal 5-year survival outlook, particularly those at clinical stage III. This observation reaffirms the notion that elevated TM levels are harbingers of a poor prognosis. Furthermore, our Cox regression highlighted TMI as an independent prognostic determinant for patients with AGC post radical surgery. Consequently, the TMI may serve as a solitary metric for assessing the prognosis of patients with AGC, encapsulating the multifaceted nature of GC and offering a more nuanced prognostic perspective.
Postoperative chemotherapy can significantly improve the prognosis. 42 Our study discovered that patients with stage II and III tumors in the TMI-High group, the benefits are more pronounced, partly due to fewer instances of gastric signet ring cell carcinoma (SRCC). SRCC has great spreading ability and prolonged new lymphangiogenesis, which is absent an effective immune reaction. Moreover, SRCC cells lack free ribosomes, contain abundant lysosomes and mucus, and have different invasion and metastasis mechanisms, which hinder the application of anticancer drugs and make them relatively insensitive to chemotherapy. Multiple studies indicate similar outcomes for patients with SRCC, regardless of whether they receive chemotherapy or not.43-45 Moreover, higher serum TM levels indicate a larger tumor burden, and these patients tend to respond better to chemotherapy.46,47 This observation offers a plausible reason why the TMI-High group gains more from postoperative chemotherapy. In essence, the effectiveness of chemotherapy is influenced by the tumor’s intrinsic characteristics and its burden, as inferred from serum TM levels.
In clinical practice, medical professionals have discovered that the pTNM staging system can accurately forecast the prognosis of patients with GC. We created a nomogram based on the TMI and clinicopathological characteristics of the patients and discovered that the AUC of the nomogram was greater than that of the pTNM staging system. The AUCs of the nomogram for forecasting 3-year and 5-year OS rates were .791 and .767, respectively. We also evaluated the predictive performance of the nomogram, and the C-index of patients was .734, which demonstrated that the nomogram was effective in predicting the 3- and 5-years OS. Moreover, the decision curve demonstrated that within the threshold range, the nomogram’s overall net benefit was greater than that of the pTNM. In addition, the nomogram constructed based on TMI and clinicopathological characteristics was well-tested. Thus, the nomogram created for patients with GC can clearly benefit patients with AGC and may be considered for therapeutic use.
However, this retrospective study has some limitations. Being a single-center study, it inherently carries the biases of a homogenous population and setting-specific clinical practices. While our internal validation supported the nomogram’s validity, its generalizability remains to be proven via external validations in diverse settings. Another area of concern is the singular measurement of tumor markers before surgery. Given the dynamic nature of tumor marker levels, continuous monitoring after surgery might yield a more comprehensive prognostic picture. Furthermore, our study’s exclusive focus on patients with AGC undergoing radical surgery may limit the applicability of our findings to the entire spectrum of GC. Finally, we did not estimate the sample size based on an experimental approach; therefore, our results may have been limited. Thus, future prospective studies with more serum samples and more patients are required to validate these findings.
Conclusion
The TMI established based on serum CEA and CA19-9 levels in patients with GC can predict the prognosis of patients with AGC undergoing radical surgery, and the elevated TMI levels indicate poorer prognosis. Additionally, the integration of the TMI with the clinicopathological attributes in our nomogram enhances its accuracy in predicting the survival outcomes of patients with GC.
Footnotes
Author’s Contribution
Jiaqi Zhang designed and conceived the project together and participated in the collection and assembly of data, data analysis and interpretation, and manuscript writing. Xin Yin, Hao Wang, Tianyi Fang, Jialiang Gao, Ziyu Zhu, and Chunfeng Li participated in acquisition, analysis, and interpretation of data. Yufei Wang, Xibo Wang, Zhanfei Lu, Junpeng Wu, Yimin Wang, and Yao Zhang participated in patient information collection. Yingwei Xue participated in the design and supervision of research and substantially revised and critically reviewed the article. All authors made a significant contribution to the work reported, whether that is in the conception, study design, execution, acquisition of data, analysis and interpretation, or in all these areas; took part in drafting, revising, and critically reviewing the article; gave final approval of the version to be published; agreed on the journal to which the article has been submitted; and agreed to be accountable for all aspects of the work.
Declaration of Conflicting Interests
The author(s) declared no potential conflicts of interest with respect to the research, authorship, and/or publication of this article.
Funding
The author(s) disclosed receipt of the following financial support for the research, authorship, and/or publication of this article: This study was supported by the Nn10 Program of Harbin Medical University Cancer Hospital, China (No. Nn10 PY 2017-03), and Study on the Mechanism of REG/NLRP3 Induced Pyrogen Death in Gastric Cancer Cells Mediated by Nano-Gold Containing Huangdoxin B. 2022 Heilongjiang Natural Science Foundation Co-guided Project LH2022H063.
Ethical Statement
Open Access statement
This article is an open access article that was selected by an in-house editor and fully peer reviewed by external reviewers. It is distributed in accordance with the Creative Commons Attribution-NonCommercial (CC BY-NC 4.0) license, which permits others to distribute, remix, adapt, and build upon this work noncommercially and license their derivative works on different terms, provided the original work is properly cited and the use is noncommercial. See: ![]()