
Abstract
Objectives
To evaluate outcomes and cost-effectiveness of targeted therapy sequencing for metastatic and recurrent cervical cancer.
Method
Models were simulated based on phase II and III trials on bevacizumab (bev) from GOG-240, cemiplimab (cemi) from GOG 3016, pembrolizumab (pembro) from KEYNOTE-826, and tisotumab vedotin (tiso) from GOG 3023. Costs were based on IBM Micromedex RED BOOK™ and company listed costs.
Results
For [chemo + bev → chemo], total cost was $125,918.04, with median overall survival (mOS) of 21.8 months, and cost-effectiveness ratio (CER) of $119,835.79. For [chemo + bev → cemi], total cost was $187,562.99 with mOS of 28.5 months and CER of $162,039.16. For [chemo + bev + pembro → chemo], total cost was $319,963.78 with mOS 32.9 months and CER of $249,930.10. For [chemo + bev + pembro → tiso], total cost was $455,204.45, with mOS 36.5 months and CER of $320,072.99.
Conclusion
The combination of immunotherapies and biologics have significantly increased overall survival, but with associated higher costs, primarily related to drug costs.
Highlights
Several novel agents have demonstrated improvement in cervical cancer outcomes. Costs-effectiveness of these drugs in individual trials has been studied, but not in their sequential use. We demonstrate relative cost-effectiveness based on each drug sequence.
Introduction
Despite significant advances in screening and treatment, cervical cancer remains one of the leaders in oncologic years of life lost, with over 600,000 cases and 300,000 deaths annually worldwide. 1 For patients with recurrent and metastatic disease, prognosis is overall poor, and until recently the standard of care was cytotoxic chemotherapy.2,3
In the last decade, biologic and targeted agents have been added to the arsenal. The Gynecologic Oncology Group (GOG)-240 study demonstrated that the addition of anti-angiogenesis agent bevacizumab to chemotherapy resulted in improved survival. 4 More recent publications include KEYNOTE-826, adding programmed death 1 (PD-1) agent pembrolizumab to platinum-doublet chemotherapy with bevacizumab. 5 The innovaTV 204/GOG-3023/ENGOT-cx6 trial showed durable response with anti-tissue factor antibody-drug-conjugate tisotumab vedotin. 6 Finally, the benefit of PD-1 inhibitor cemiplimab was shown in the EMPOWER-Cervical 1/GOG-3016/ENGOT-cx9 trial. 7
Previous investigators have performed cost effective analyses of these novel targeted therapeutics.8-11 However, these studies only investigated these agents within their individual trials, rather than in combination or sequenced analyses. For example, in liver cancer, Sherrow et al utilized a Markov model to investigate optimal and cost-effectiveness of several agents in various sequencies 12 and has been done in breast cancer as well. 13 To our knowledge, there have been no such studies in cervical cancer. To that end, we performed a cost analysis of various sequences of upfront and second-line treatment of novel cervical cancer agents in the recurrent and metastatic setting.
Methods
Models were simulated based on 3 potential treatment sequences, selected based on anticipated decision-models that clinicians would encounter: (1) doublet first-line chemotherapy + bevacizumab (chemo-bev) from the GOG-240 study, then second-line cemiplimab (cemi) from the GOG-3016 trial [chemo + bev → cemi]; (2) doublet chemo + bev + pembrolizumab (chemo + bev + pemb) from KEYNOTE-826, then second-line single agent chemo based on GOG 3016 [chemo + bev + pemb → chemo]; and (3) doublet chemo + bev + pemb, then second-line tisotumab vedotin (tiso) from GOG 3023 [chemo + bev + pemb → tiso]. These were compared to a reference of prior standard of care with chemo + bev from the GOG 240 study followed by single agent chemotherapy (chemo) based on the GOG 3016 study [chemo + bev → chemo].
Costs of Therapies.

aSingle agent chemotherapy agents included: pemetrexed, topotecan, irinotecan, gemcitabine, and vinorelbine.
Costs derived from IBM Micromedex RED BOOK™ wholesale acquisition costs (WAC), or where not available, from costs listed by each respective company.
A Markov-modeling approach was utilized to evaluate the cost-effectiveness of different first-line and second-line treatment sequences. The model allowed for 9 possible states and the transition probabilities (in 1-month increments) were derived from the provided study data from published trial data (Figure 1). For treatments with multiple data sources, weighted averages (across multiple reviewers) were used to obtain estimates of the toxicity, progression, and survival rates. Survival data were derived from published trial data and median, 4, 6, 12, 18, 24, 36, and 60 month time points were analyzed. Data were derived from the Kaplan–Meier curves supplied in each publication. Conditional probability calculations were used to estimate which portion of progression-free survival (PFS) events was patient death and which portion was progression. Markov model schema.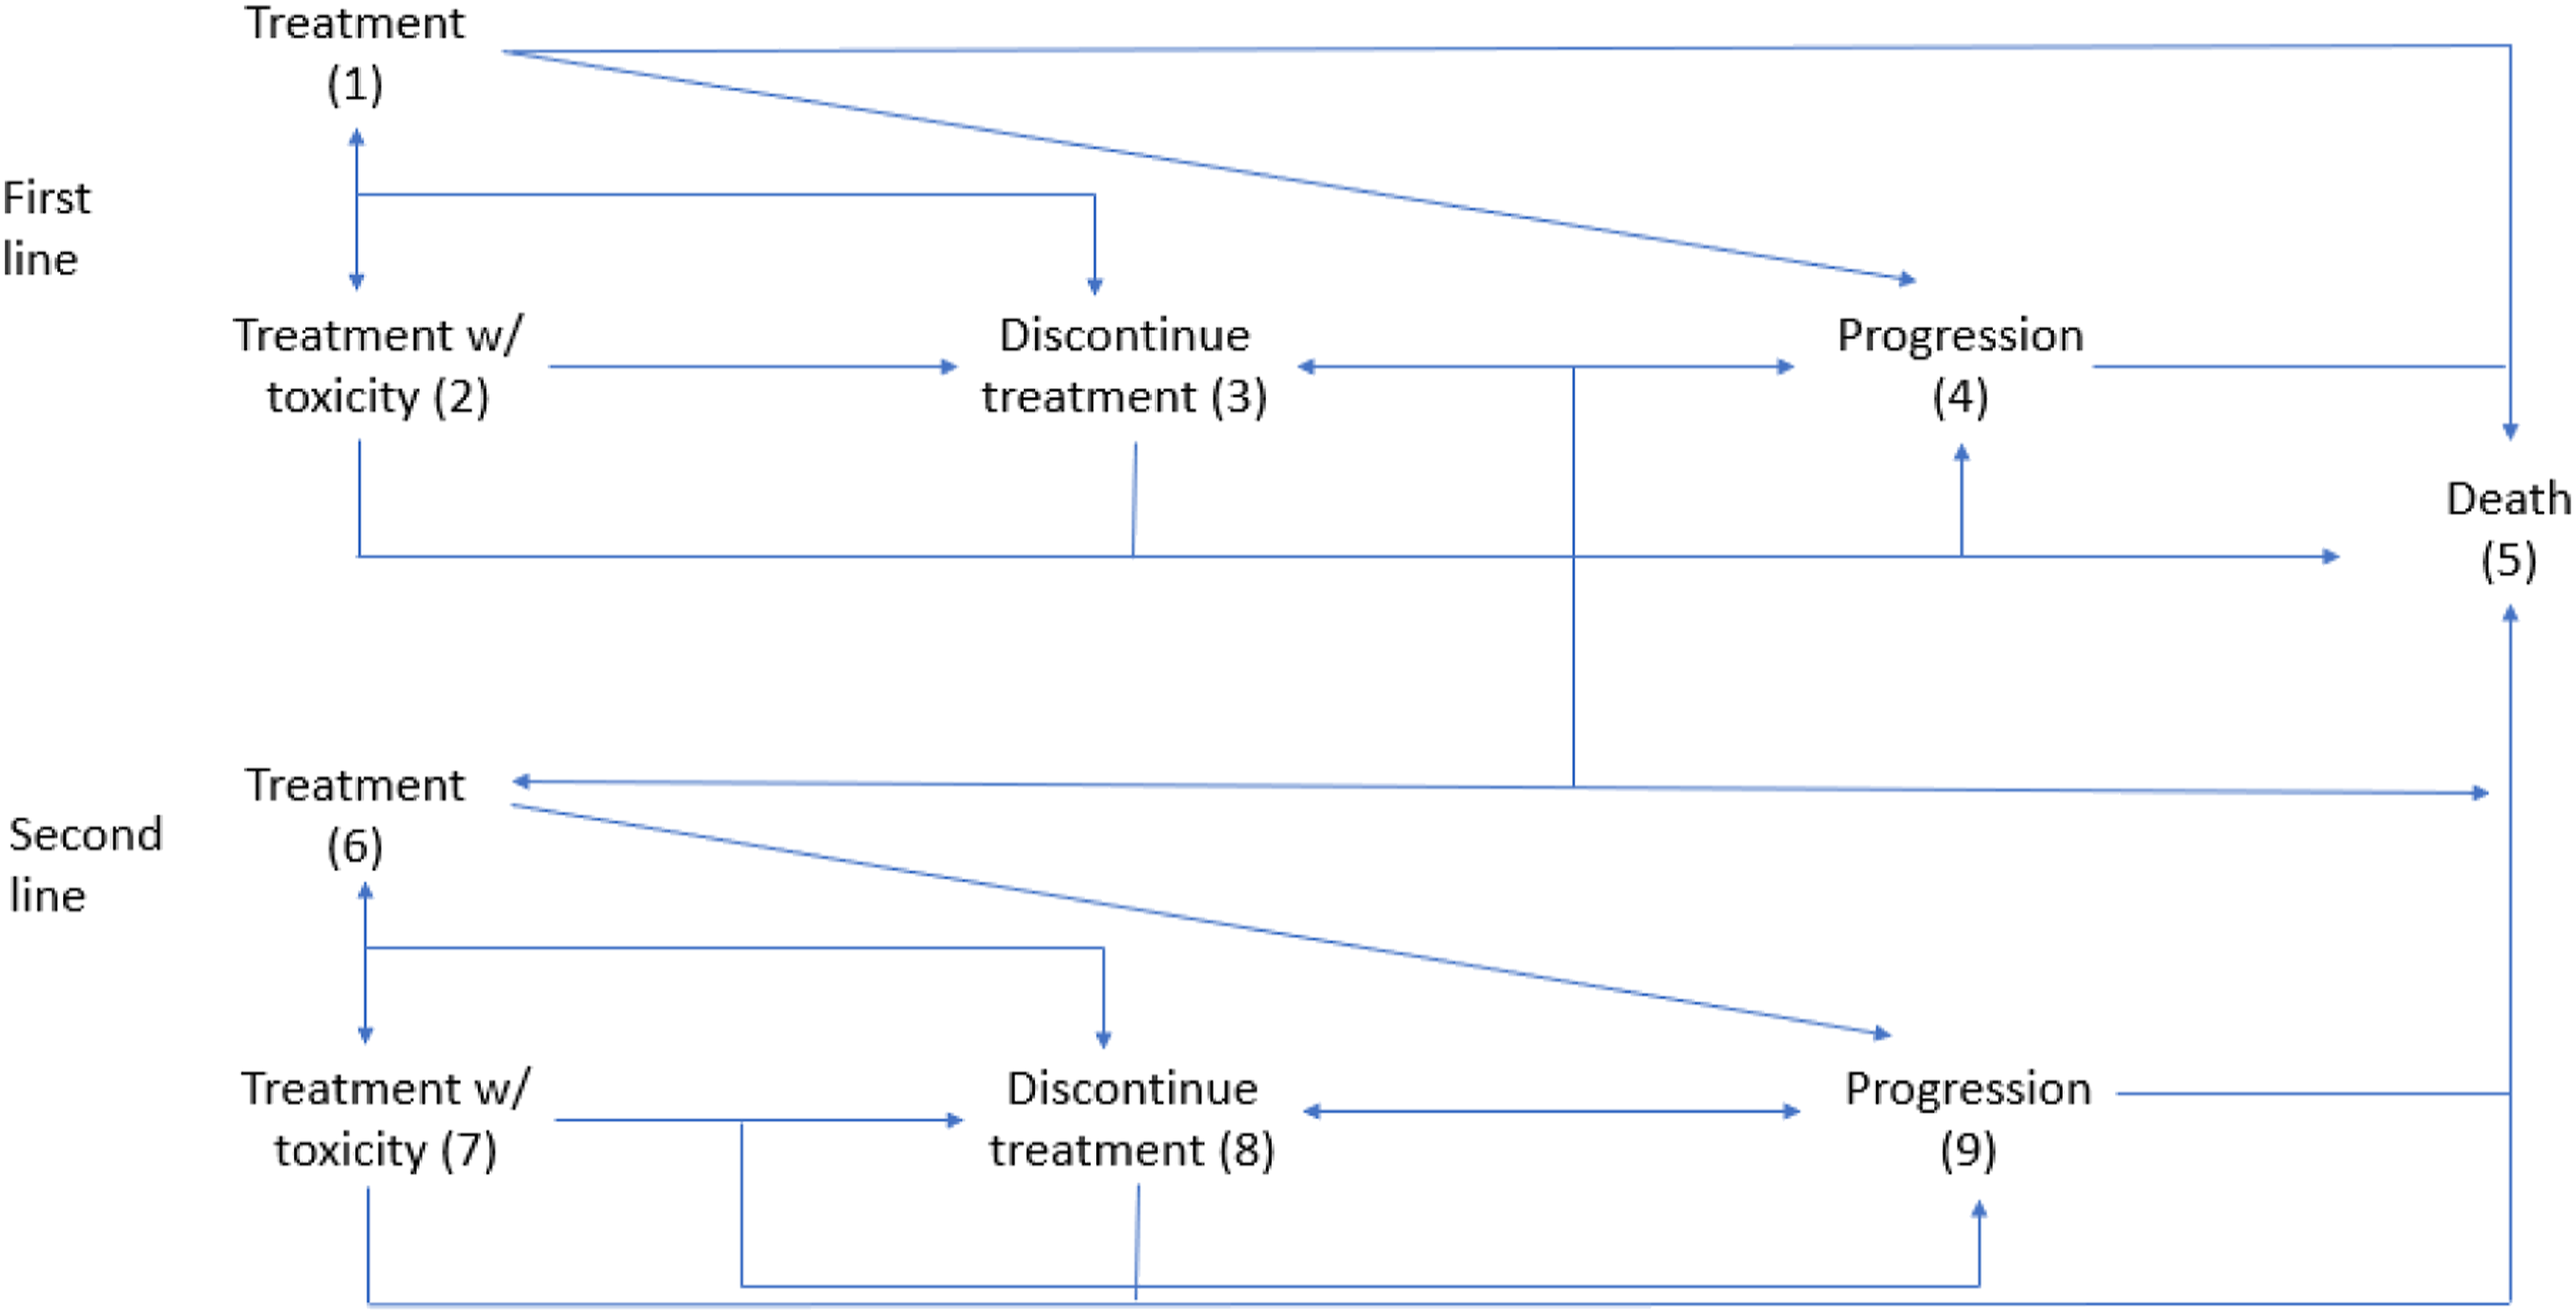
For the first-line treatment, the states included: treatment (1), treatment with toxicity (2), discontinuation due to toxicity (3), progression (4), and death (5). Patients in state 1 could move to any of the 5 states; patients in state 2 could move to any other state; patients in states 3 and 4 transitioned to the second-line treatment (states 6-8) or to state 5; and patients in state 5 (death) remained there. For the second-line treatment, the states included: treatment (6), treatment with toxicity (7), discontinuation due to toxicity (8), progression (9), and death (5). Patients in state 6 could move to any of the 5 states (5–9); patients in state 7 could move to any other state; patients in state 8 could remain in that state or transition to progression (9) or death (5); patients in state 9 could remain there or transition to death (5); and patients in state 5 (death) remained there.
A health utility was assigned to each treatment state: patients on treatment received a mean health utility (MHU) of .84, patients who progressed received a mean MHU of .50, patients who had toxicity received a mean MHU of .70, and patients who died received a mean MHU of 0. The mean MHU values are consistent with the results per Le et al and the observed health utility for a given patient was randomly generated using a Beta distribution based on the mean MHU for a given state. 14 The QALY was then obtained by summing across all treatment states the product of the state’s healthy utility and the time in the given state.
Monte-Carlo methods were used to simulate the experience of 1,000,000 patients per treatment sequence for a 60-month period. The patients moved through different states based on the derived transition matrices, and accumulated costs and QALYs based on the states they experienced.
The following quantities describe the operating characteristics of the different treatment sequences and were calculated from the simulated data: (1) QALY = the number of quality life years accumulated by a patient. If a patient was on treatment (with no toxicity or progression) for the entire simulated year, then QALY = 1. If a patient died during the first month, then QALY = 0. If a patient experienced toxicities or progression, then the QALY will range between 0 and 1. (2) Cost = the accumulated cost based on the treatment received. (3) CER = Cost-effectiveness ratio, which is the ratio of the average cost relative to the average QALY. Essentially, this quantity represents the cost (in dollars) required to achieve 1 quality of life year. (4) Toxicity rate = the percentage of simulated patients that experienced toxicity at some point during treatment. (5) Average survival = the average survival time (in months) after the simulated. A net-benefit analysis was performed to determine cost-effectiveness based on pre-specified thresholds, similar to a willingness to pay model. 15 Models were based on 2 possible thresholds at $150,000 and $300,000.
A sensitivity analysis was conducted to evaluate the impact of the subjective QALY measure on the operating characteristics of the treatment sequences. The QALY weights were reduced and variability in the beta distributions was increased (ie less consistency in QALY experienced between patients). A statistical cut off of α = .05 was utilized to describe significance.
Results
Clinical Trial Treatment Sequences and Associated Costs.
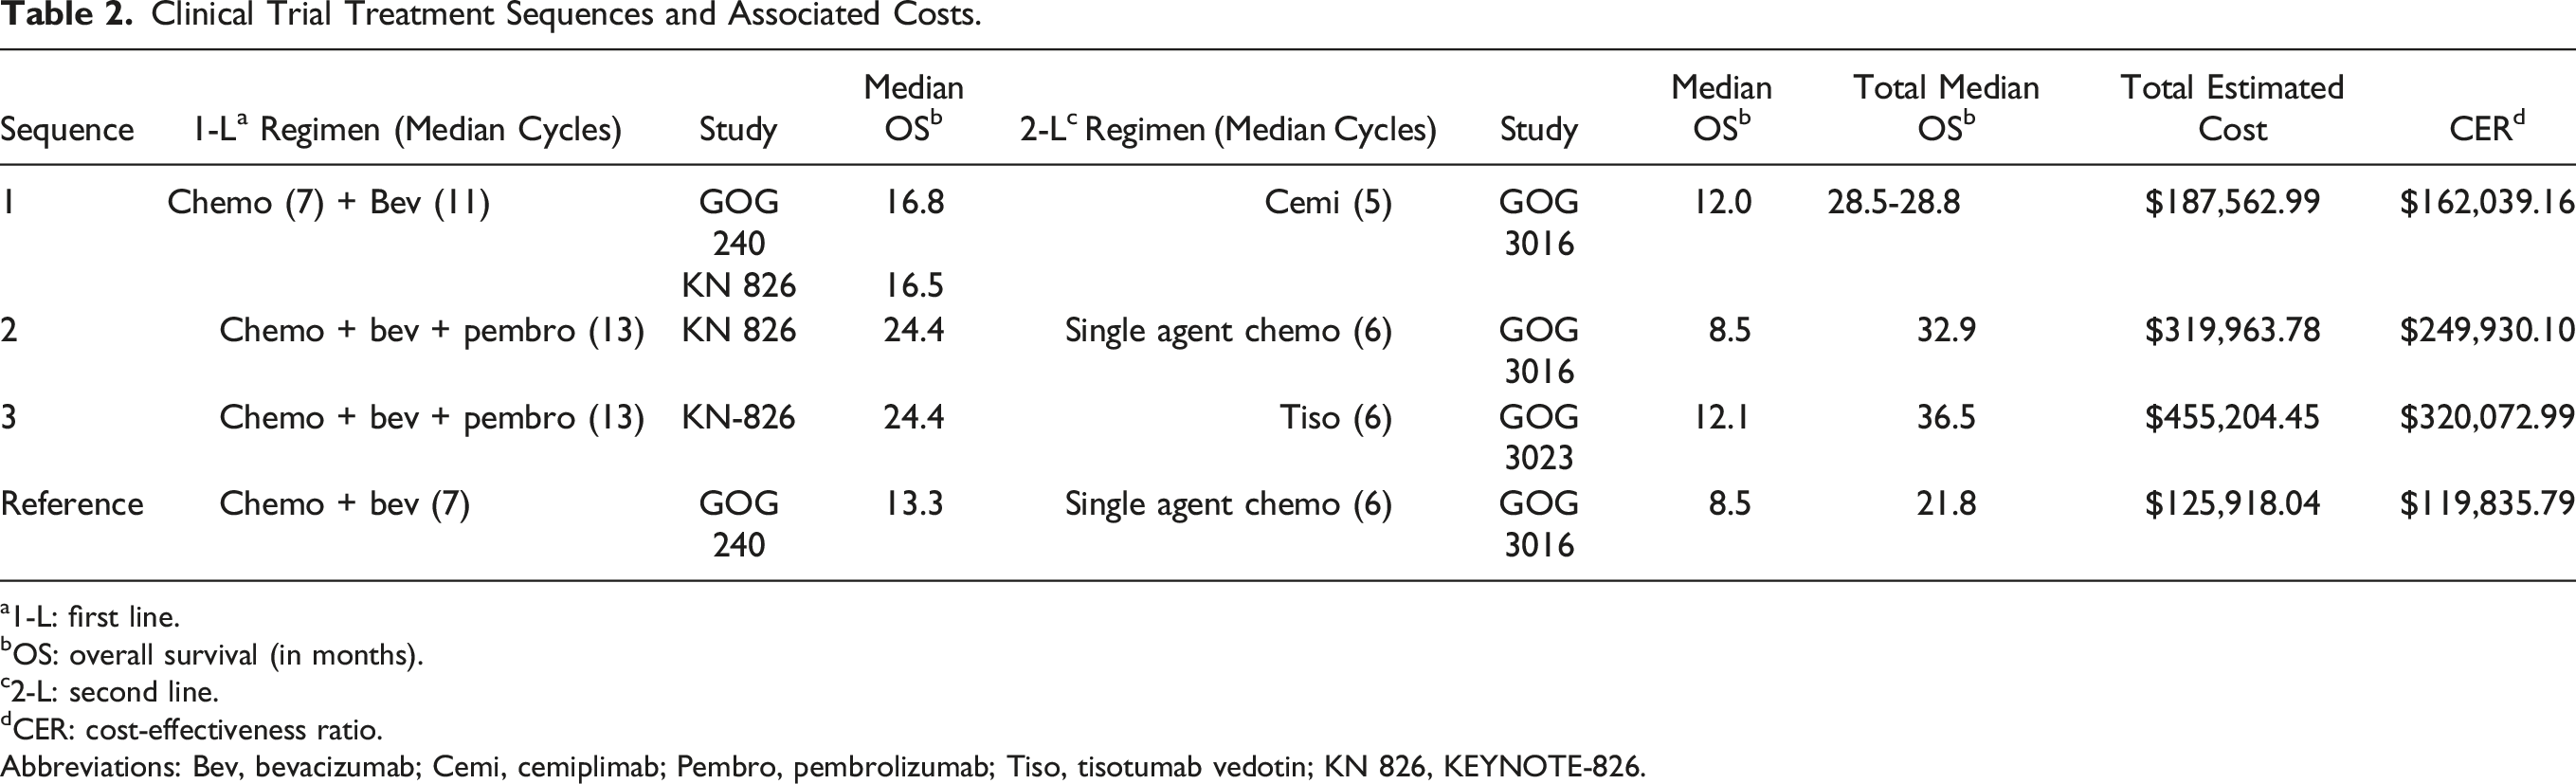
a1-L: first line.
bOS: overall survival (in months).
c2-L: second line.
dCER: cost-effectiveness ratio.
Abbreviations: Bev, bevacizumab; Cemi, cemiplimab; Pembro, pembrolizumab; Tiso, tisotumab vedotin; KN 826, KEYNOTE-826.
For the first sequence (1) [chemo + bev → cemi], median overall survival (mOS) was 16.8 months using chemo + bev (median cycles - 7), with second-line cemiplimab with mOS of 12.0 months (median cycles - 5). The total cost for the first sequence #1 [chemo + bev → cemi] was $187,562.99 with an associated mOS of 28.5 months and CER of $162,039.16.
For the second sequence (2) [chemo + bev + pembro → chemo], chemo + bev + pemb mOS was 24.4 months (median cycles - 13), with second-line chemo with mOS of 8.5 months, (median time on treatment: 10 weeks). Total cost for the second sequence [chemo + bev + pemb → chemo] was $319,963.78, with mOS for the combined regimen 32.9 months and CER of $249,930.10.
For the third sequence (3) [chemo + bev + pembro → tiso], for chemo + bev + pemb, mOS was 24.4 months (median cycles - 13, with second-line tiso with mOS of 12.1 months (median cycles 7). Total cost for the third sequence [chemo + bev + pemb → tiso] was $455,204.45, with mOS for the combined regimen 36.5 months, with CER of $320,072.99.
For the reference sequence [chemo + bev → chemo], for chemo + bev, mOS was 13.3 (median cycles – 6), with second-line single agent chemo with mOS of 8.5 months (median time on treatment: 10 weeks). Total cost for reference regimen [chemo + bev → chemo] was $125,918.04, with mOS for the combined regimen 21.8 months and CER of $119,835.79.
Cost-Effectiveness Analysis and Net Benefit/Willingness to Pay Analysis.

For this reason, we then performed a CER analysis based on QALY, as displayed in Supplemental Table A. Overall the reference sequence 4 of [chemo + bev → chemo] has the lowest CER, followed by sequence 1 [chemo + bev → cemi], although these were significantly lower compared to when not adjusted by QALY. Still, all sequences had QALY-adjusted CER above $100,000.
Discussion
Recent developments of novel agents have begun to fill a largely unmet clinical need for women with advanced, recurrent, or metastatic cervical cancer. These include standardized chemotherapy regimens of cisplatin-paclitaxel from GOG-204, the addition of bevacizumab in GOG-240 and pembrolizumab in KEYNOTE-826, as well as single agent immunotherapy agent cemilipimab and antibody-drug-conjugate tisotumab vedotin.2,4-7,16 Our economic analysis of these studies suggests that the combination and sequence of chemotherapy, immunotherapies, and biologics have substantially increased overall survival. However, the introduction of targeted therapy is also associated with significantly higher costs. Total costs ranged from $125,918.04 for our reference sequence of [chemo + bev → chemo] to $455,204.45 for [chemo + bev + pembro → tiso].
Previous analyses of cost-effectiveness for the individual trials utilized in our study have been published.9-11 However, these authors did not perform analyses of each trial in context to assist in the decision making of optimal and cost-effective sequencing of treatment. Phippen et al demonstrated that the addition of bevacizumab to previous standard of care in GOG-240 approached but did not quite meet cost-effectiveness standards. 10 Shi et al recently performed a cost-effectiveness analysis of the KEYNOTE-826 trial and found that pembrolizumab must be sold at less than half its current price in order to be considered cost-effective. 11 Our study too demonstrates the high cost of this regimen. However, it also demonstrates that with the utilization of chemotherapy, bevacizumab, and pembrolizumab, followed by tisotumab-vedotin [chemo + bev + pembro → tiso], while overall costs are highest, the survival benefit also appears to be the greatest. Comparing our data and cost-effectiveness analyses to prior studies is limited by changes in costs due to inflation. For example, while $100,000 ICER/QALY is typically utilized as acceptable rate, $100,000 in 2015 equates to $120,299.35 in 2022. 17
The major limitation to reducing costs of these treatments is drug cost themselves. One consideration for lowering costs is differential dosing and timing of pembrolizumab and other novel agents which rely on infusion centers. In order to limit COVID exposure to immunocompromised cancer patients, some oncologists dosed pembrolizumab every 6 weeks instead of every 3 weeks, which may have lowered overall healthcare costs. Although not studied in our paper, there are data to suggest non-inferiority of this regimen. 18 Additionally, personalized dosing of pembrolizumab and other biologics in cervical cancer may result in significant cost-savings as demonstrated in other common cancer types, as well as lowering wastage by altering drug packaging.19-21 One sign of hope lay in the lenvatinib dosing schedule. Data presented at the Society of Gynecologic Oncology 2022 meeting noted that the dosing and packaging of lenvatinib had led to significant medical waste. When lenvatinib’s parent company Eisai (Tokyo, Japan) became aware of this, in partnership with oncologists, they instituted a buy-back program to reduce cost burden on patients and insurers. 22
As biologics are utilized more frequently following the practice adoption of these trials, and as they potentially become more common in other settings in cervical cancer, addressing this cost conundrum will become increasingly more important. By some estimates, drugs for oncology already account for the largest spending of any specialty, and this trend appears to be increasing. 23 These high costs translate into huge burdens on country’s economic health, and many countries may not fund novel agents which are available in countries like the United States. 23
For cervical cancer specifically, one cost-effective measure that may avoid these expensive treatments for advanced and recurrent disease are guideline-consistent primary and/or secondary prevention. As a preventable cancer, both the HPV vaccination and routine screening appear to be effective and cost-effective based on prior analyses.24-29 However, for the large and increasing number of patients diagnosed with advanced-stage disease for whom recurrence is common, these novel treatments studied will become increasingly important. 30
Our study has certain limitations. First, cemiplimab is not FDA-approved specifically for cervical cancer, although it is FDA approved for other cancers and may still be used off-label. Additionally, survival, quality of life and toxicity data were derived from trials and there exists heterogeneity between trial designs, patient populations, and subsequent lines of therapy. These serve as confounders when attempting to compare trials, especially given the long-time interval between our reference trial and more recent trials. Our study relies on this data—future studies will need to be performed utilizing real-world data to corroborate these findings. Additionally, our costs were estimated from drug company listings as well as wholesale acquisition cost pricing, which may not accurately represent the actual drug cost for any given individual given pricing variability and inflation. Our analysis of toxicity was also limited—given the number of trials and various potential toxicity outcomes, we did not include toxicity costs that were specific to each trial/novel drug, but rather general toxicity costs for common adverse events in the trials. For example, tisotumab-vedotin is known to cause ocular toxicity necessitating additional visits by ophthalmologists. 31 Agent-specific costs such as these were not included, although previous analyses have demonstrated that for these novel agents in gynecologic oncology, the vast burden of costs is due to the drug costs themselves rather than toxicities specific to each therapeutic agent. 10 Also, our study derived data for tisotumab-vedotin from a single arm phase II trial, and we also used weighted averages from multiple trial data sources. Our analysis only includes the first line and second line of treatment for cervical cancer patients - we did not perform analyses for patients who may have had alternate regimens prior to the utilization of these novel agents and cannot assess the costs for this patient population. Additionally, our willingness to pay thresholds was set at $150,000 and $300,000—there exists significant debate as to what should be considered cost-effective between countries and various specialties.32-34 Lastly, the transition probabilities of the Markov models were invariant to time (ie constant hazards) and more comprehensive models could better differentiate between similarly behaving treatment sequences. However, our study is strengthened by its utilization of a sequential treatment costs model as has been previously published in other forms of cancer. 12 To our knowledge, this is the first study to investigate these sequences of novel therapeutics in this setting.
Conclusion
The treatment landscape for advanced, metastatic, and recurrent cervical cancer is quickly changing. The combination of immunotherapies and biologics has significantly increased overall survival, but also increased cost, and at this time are likely not considered cost-effective. Weighing the cost to the healthcare system must be balanced against the benefit of years-survival with these novel agents, or until additional cost-saving methods can be implemented.
Supplemental Material
Supplemental Material - Sequential Targeted Therapy for Advanced, Metastatic, and Recurrent Cervical Cancer: A Cost-Effectiveness Analysis of the Patient Journey
Supplemental Material for Sequential Targeted Therapy for Advanced, Metastatic, and Recurrent Cervical Cancer: A Cost-Effectiveness Analysis of the Patient Journey by Michael T. Richardson, Kristopher Attwood, Gabriella Smith, Su-Ying Liang, Katherine LaVigne Mager, Krishnansu S. Tewari, Robert L. Coleman, Daniel S. Kapp, John K. Chan, and Bradley J. Monk in Cancer Control
Footnotes
Author’s Notes
A version of this work was presented at the Society for Gynecologic Oncology 2022 Annual Conference.
Author Contributions
All authors have read the manuscript and agreed to submit it in its present form.
Declaration of Conflicting Interests
The author(s) declared the following potential conflicts of interest with respect to the research, authorship, and/or publication of this article: Dr. Chan: Acerta, Aravive, AstraZeneca, Biodesix, Clovis, Eisai, Janssen/J and J, Oxigene/Mateon, Roche/Genentech, and Glaxosmithkline/Tesaro.
Dr. Coleman: Agenus, Alkermes, AstraZeneca, Clovis, Deciphera, Eisai/BMS, Genelux, Genmab, GSK, Immunogen, OncoQuest, Onxerna, Regeneron, Roche/Genentech, Novocure, Merck, Abbvie, and VBL therapeutics.
Dr. Monk: Acrivon, Adaptimune, Agenus, Akeso, Bio Amgen, Aravive, AstraZeneca, Bayer, Clovis, Easai, Elevar, EMD, Merck, Genmab/Seagen, GOG Foundation, Gradalis, Heng Rui, ImmunoGen, Karyopharm, Iovance, Laekna, Macrogenics, Merck, Mersana, Myriad, Novartis, Novocure, OncoC4, Panavance, Pieris, Pfizer, Puma, Regeneron, Roche/Genentech, Sorrento, TESARO/GSK, US Oncology Research, VBL, and Verastem Zentalis.
Dr. Tewari: Merck, Astra Zeneca, Abbvie, GSK/Tesaro, Seagen/Genmab, Clovis, Eisai, Regeneron, and Iovance.
Funding
The author(s) disclosed receipt of the following financial support for the research, authorship, and/or publication of this article: This research was supported by the Denise Cobb Hale and Fisher Family Fund.
Ethical Approval
Our study did not require an ethical board approval as this study utilized publicly available and de-identified data from published trials. It was deemed exempt from IRB approval.
Supplemental Material
Supplemental material for this article is available online.
References
Supplementary Material
Please find the following supplemental material available below.
For Open Access articles published under a Creative Commons License, all supplemental material carries the same license as the article it is associated with.
For non-Open Access articles published, all supplemental material carries a non-exclusive license, and permission requests for re-use of supplemental material or any part of supplemental material shall be sent directly to the copyright owner as specified in the copyright notice associated with the article.