
Abstract
Introduction
Accurate prediction of patient prognosis can be especially useful for the selection of best treatment protocols. Machine Learning can serve this purpose by making predictions based upon generalizable clinical patterns embedded within learning datasets. We designed a study to support the feature selection for the 2-year prognostic period and compared the performance of several Machine Learning prediction algorithms for accurate 2-year prognosis estimation in advanced-stage high grade serous ovarian cancer (HGSOC) patients.
Methods
The prognosis estimation was formulated as a binary classification problem. Dataset was split into training and test cohorts with repeated random sampling until there was no significant difference (p = 0.20) between the two cohorts. A ten-fold cross-validation was applied. Various state-of-the-art supervised classifiers were used. For feature selection, in addition to the exhaustive search for the best combination of features, we used the-chi square test of independence and the MRMR method.
Results
Two hundred nine patients were identified. The model's mean prediction accuracy reached 73%. We demonstrated that Support-Vector-Machine and Ensemble Subspace Discriminant algorithms outperformed Logistic Regression in accuracy indices. The probability of achieving a cancer-free state was maximised with a combination of primary cytoreduction, good performance status and maximal surgical effort (AUC 0.63). Standard chemotherapy, performance status, tumour load and residual disease were consistently predictive of the mid-term overall survival (AUC 0.63–0.66). The model recall and precision were greater than 80%.
Conclusion
Machine Learning appears to be promising for accurate prognosis estimation. Appropriate feature selection is required when building an HGSOC model for 2-year prognosis prediction. We provide evidence as to what combination of prognosticators leads to the largest impact on the HGSOC 2-year prognosis.
Keywords
Introduction
Cancer of the fallopian tube, ovary or peritoneum ranks as the seventh most common cancer in women and the eighth most common cause of cancer death. 1 It yet remains one of the most difficult cancers to combat with most patients relapsing within 3 years of diagnosis. 2 The majority (90%) of these cancers are epithelial ovarian cancers (EOCs). High-grade serous ovarian cancer (HGSOC) is the most prevalent form among EOCs and is now recognised as a single entity. Indeed, of the women who die of HGSOC, 93% present with advanced-stage (International Federation Obstetrics and Gynaecology FIGO stage-III or IV) disease. 3 Interestingly, HGSOC women who receive surgical treatment have better long-term survival than those who do not, despite being diagnosed at an advanced stage. 4
The cornerstones of advanced-stage HGSOC treatment are surgical cytoreduction and platinum-based backbone chemotherapy, either as treatment following surgery (adjuvant) or as treatment both before and after surgery (neoadjuvant, NACT). 5 Optimal cytoreduction and initial tumour load are the most significant modifiable markers of survival.6,7 Following recent publications of landmark randomised studies demonstrating non-inferiority of NACT over primary surgery, it appears that NACT achieves higher complete cytoreduction (R0) rates, but the survival rates are comparable.6,8 Even when EOC patients undergo complete surgical cytoreduction and systemic chemotherapy, the risk for tumour relapse remains high.
Accurate estimation of EOC patient prognosis can be particularly useful for enhancing diagnostic precision and selection of best treatment protocols. Due to the EOC heterogeneity, a one-size-fits-all FIGO staging system approach is not justified. As the number of clinical and biological parameters under investigation increases daily, it becomes critical to assemble a large and heterogeneous amount of data and construct appropriate models. 9 Prognosis estimation can be difficult with conventional statistics because patient characteristics show multidimensional and non-linear relationship. To develop personalised treatment plans, computational approaches, such as Machine Learning (ML) models can serve the purpose by making predictions using multiple processing layers, including complex structures or multiple non-linear transformations. The evolution of ML technology in the field of gynaecological oncology has been described. 10 We previously demonstrated the feasibility of using a ML approach, the k-NN model, which is very much reflective of ‘previous clinical experience’ for accurate prediction of complete cytoreduction in advanced-stage HGSOC surgery. 11
We aimed to develop a data-driven framework by using modern ML to predict the survival outcomes of HGSOC patients from many clinical patient-specific features. We hypothesised that the prognosis prediction of HGSOC patients is multifactorial and could be accurately predicted by using ML algorithms. We performed a comparative analysis to examine the mid-term contribution of selected clinical variables to define their relative survival impact. When developing a cancer prognosis prediction model, model performance is not the sole goal but also extracting the most relevant features to better understand the data and the underlying process. Feature selection is a key step in many classification problems. 12 The study was designed to support the feature selection for different prognostic periods, using the prospectively registered data of HGSOC women, who received surgical treatment. The primary outcome was factor analysis using the Maximum Relevance Maximum Redundancy (MRMR) method for different prognostic periods. 13 The secondary outcome was the performance comparison amongst several ML prediction methods, based on a set of performance metrics, 14 including the accuracy, the sensitivity and specificity of the model, the precision and recall, the f-score and the g-score (or Fowlkes–Mallows index 15 ) for different prognostic periods. These results were directly compared to conventional Logistic Regression.
Study Design
The study was structured in two basic workflows, which ultimately integrated into one: the clinical and the engineering workflows. The clinical workflow consisted of the patient input, the patient–clinician interaction and the hospital site part. Most processes in the clinical workflow were related to the data-acquisition, data cleaning, data pre-processing and statistical compilation before feeding them in the engineering workflow. The engineering workflow included all processes related to the data processing feature extraction and ML-based feature selection and prognosis prediction. The workflow, outlined here and described in detail below, is illustrated in the conceptual diagram in Figure 1. Workflow showing integration of ML algorithms to analyse comprehensive resource of clinical, radiological and surgical data for the development of prognostic ovarian cancer models. The framework for building the predictive ML model comprised 5 steps.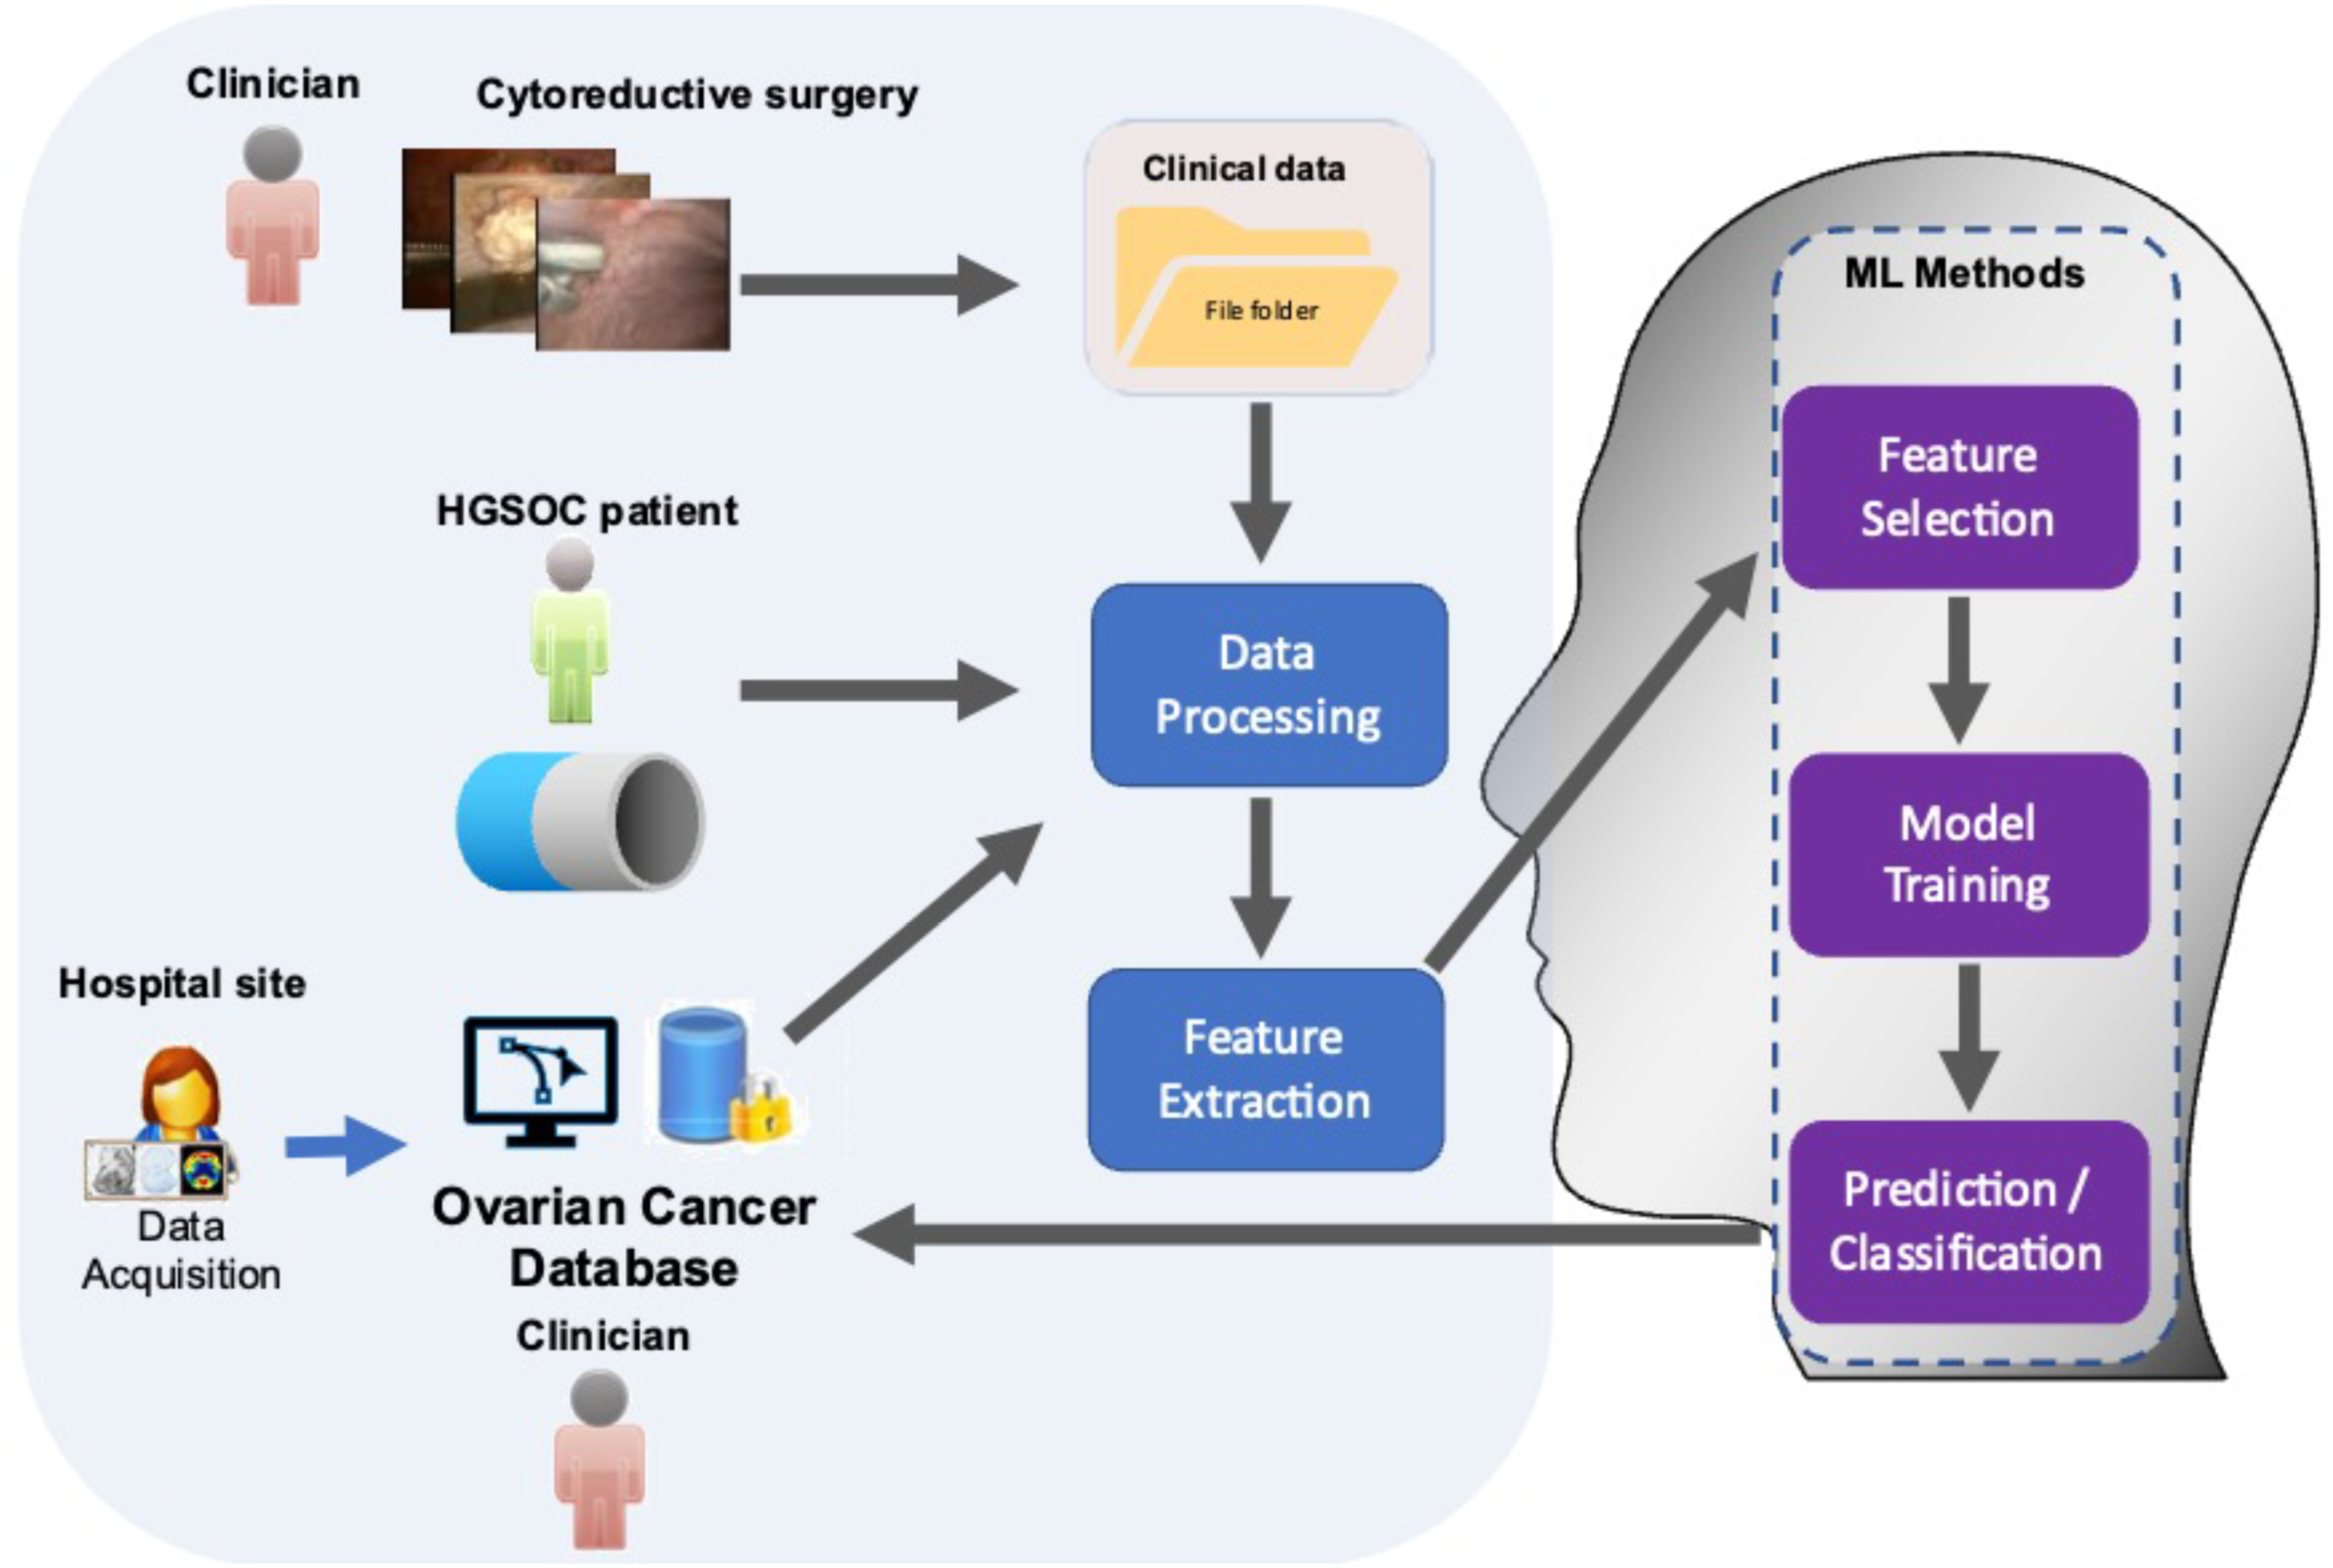
Descriptive Statistics of the Advanced-HGSOC Cohort.

For the prognosis classification, 2 groups were defined using patient survival data; patients who did not relapse or survived beyond 2 years were labeled in the positive class, and patients who relapsed or died before reaching that period were considered in the negative class.
The study was restricted to the most common prognostic variables and focused on predictive model comparisons (Table 1). Blood biomarkers such as preoperative Hb and Ca125 were not included as they appear more reliable to predict surgical outcomes or simply predict malignancy in women with adnexal masses.16,17 Equally, surveillance modalities are not used to comprehensively evaluate the prognosis of the HGSOC patients provided that the primary objective of follow-up is to detect disease that if treated early can extend survival. It is not to prolong time living with the knowledge that cancer has relapsed without extending survival. 18 Performance variables included age, Eastern Cooperative Oncology Group (ECOG) performance status (PS), radiological intraperitoneal dissemination patterns (IDP), surgical complexity score (SCS), 19 residual disease (RD), chemotherapy regimens, timing of surgery (primary debulking surgery (PDS) or interval debulking surgery (IDS)) and intra-operative disease score (DS), which is a reflection of the tumor burden. Surgical outcomes included: complete cytoreduction (R0), optimal cytoreduction (R1, 1–10 mm) or inadequate cytoreduction (R2>10 mm). 20 The SCS was assigned based on the Aletti classification as low, intermediate and high. 19 The response to chemotherapy and disease progression was defined according to RECIST criteria. 21 The DS was assigned as follows: pelvic disease, lower abdominal, upper abdominal inclusive of miliary disease, as women with miliary disease often have disease in the upper abdomen,22,23 Progression-free survival (PFS) was defined as the time from the date of diagnosis until relapse or death. Overall survival (OS) was defined as the time from the date of diagnosis until death.
The dataset was split into training and test cohorts (80%:20% ratio) with repeated random sampling, until there was no significant difference (P = .20) between the two cohorts, with respect to all variables. Subjects with missing values were omitted. Following the pre-processing stage, all quantitative variables were normalised. Categorical variables were transformed into binary dummy variables. Next, different subsets of data were labelled to solve the prognosis prediction problem. For a given time T, subjects were included or discarded from the subset. To test the HGSOC prognosis, 3 values of the prognosis period T were chosen, namely, one, two and three years. The 5-year prediction was not considered owing to data immaturity. Following preliminary testing, due to unbalanced classes, it was not possible to train a good model for the 1-year and 3-year prognosis prediction. Therefore, we focused on the 2-year prediction analysis. Only subjects with fully curated data were eligible for the 2-year prognosis prediction analysis. The prognosis prediction was then formulated as a binary classification problem. The correction for class imbalance was applied only on our efforts with the 3-year and 5-year prognosis prediction. It was applied before training the models. A repeated random selection of the prevailing class was performed to ensure statistical validity (100 iterations). For the results presented here, we did not apply any such correction on the dataset.
To address data collinearity, feature selection techniques measured the importance of a feature or a set of features according to a given measure. For feature selection, in addition to the exhaustive search for the best combination of features, we used the chi square test of independence 24 and the MRMR method, 13 as typically recommended for categorical data. The outcome of these methods is a feature ranking that shows the weighted importance of the individual features. Both methods were applied for the 2-year prognosis. The resulting rankings were used to select the set of features that led to the highest prediction accuracy. The validity of the feature selection was verified by comparing it to the exhaustive search and regularization methods. Subsequently, the optimal number of important features that would result in the highest prediction accuracy was identified. For this step, a forward selection was followed by starting with the feature of highest importance and subsequently adding features, until we reached the maximum classification accuracy.
The prognosis estimation problem was formulated as a binary classification problem. Various state-of-the-art supervised classifiers, suitable for the type and size of the dataset, were trained and tested, including Support-Vector-Machines (SVMs), 25 K-Nearest Neighbors (K-NNs), 26 Ensemble Classifiers, 27 Naïve Bayes, 28 and Logistic Regression. 29 The SVMs are highly accurate even for non-linear problems. Different kernels SVMs are flexible to identify the optimum hyperplane, to best separate the data into their categories, albeit slow for large datasets. The K-Nearest Neighbors are robust classifiers for low-dimensionality classification problems. Ensemble methods are frequently used for categorical data due to their inherent properties. They combine several different decision trees to produce better predictive performance compared to single decision trees. Bagging is a combination of decision trees to optimise the variance. We also experimented with probabilistic techniques for classification, such as Naïve Bayes and Logistic Regression. Naïve Bayes algorithms are built on the concept of conditional probability; these classifiers are computationally efficient, thus scalable to the size of the dataset and the feature set cardinality. Similarly, Logistic Regression, conventionally used in the clinical setting, gives off fast results, but has the difficulty of capturing non-linear relationships in the dataset. Due to the limitations of the dataset with respect to its size and the classes’ cardinality, ‘data-hungry’ deep-learning based classification methods were not included in this comparison. We considered Logistic Regression as our benchmark method. To promote reproducibility, the code and the model parameters promotes were made publicly available: https://github.com/AngKats/OCPrognosis
Results
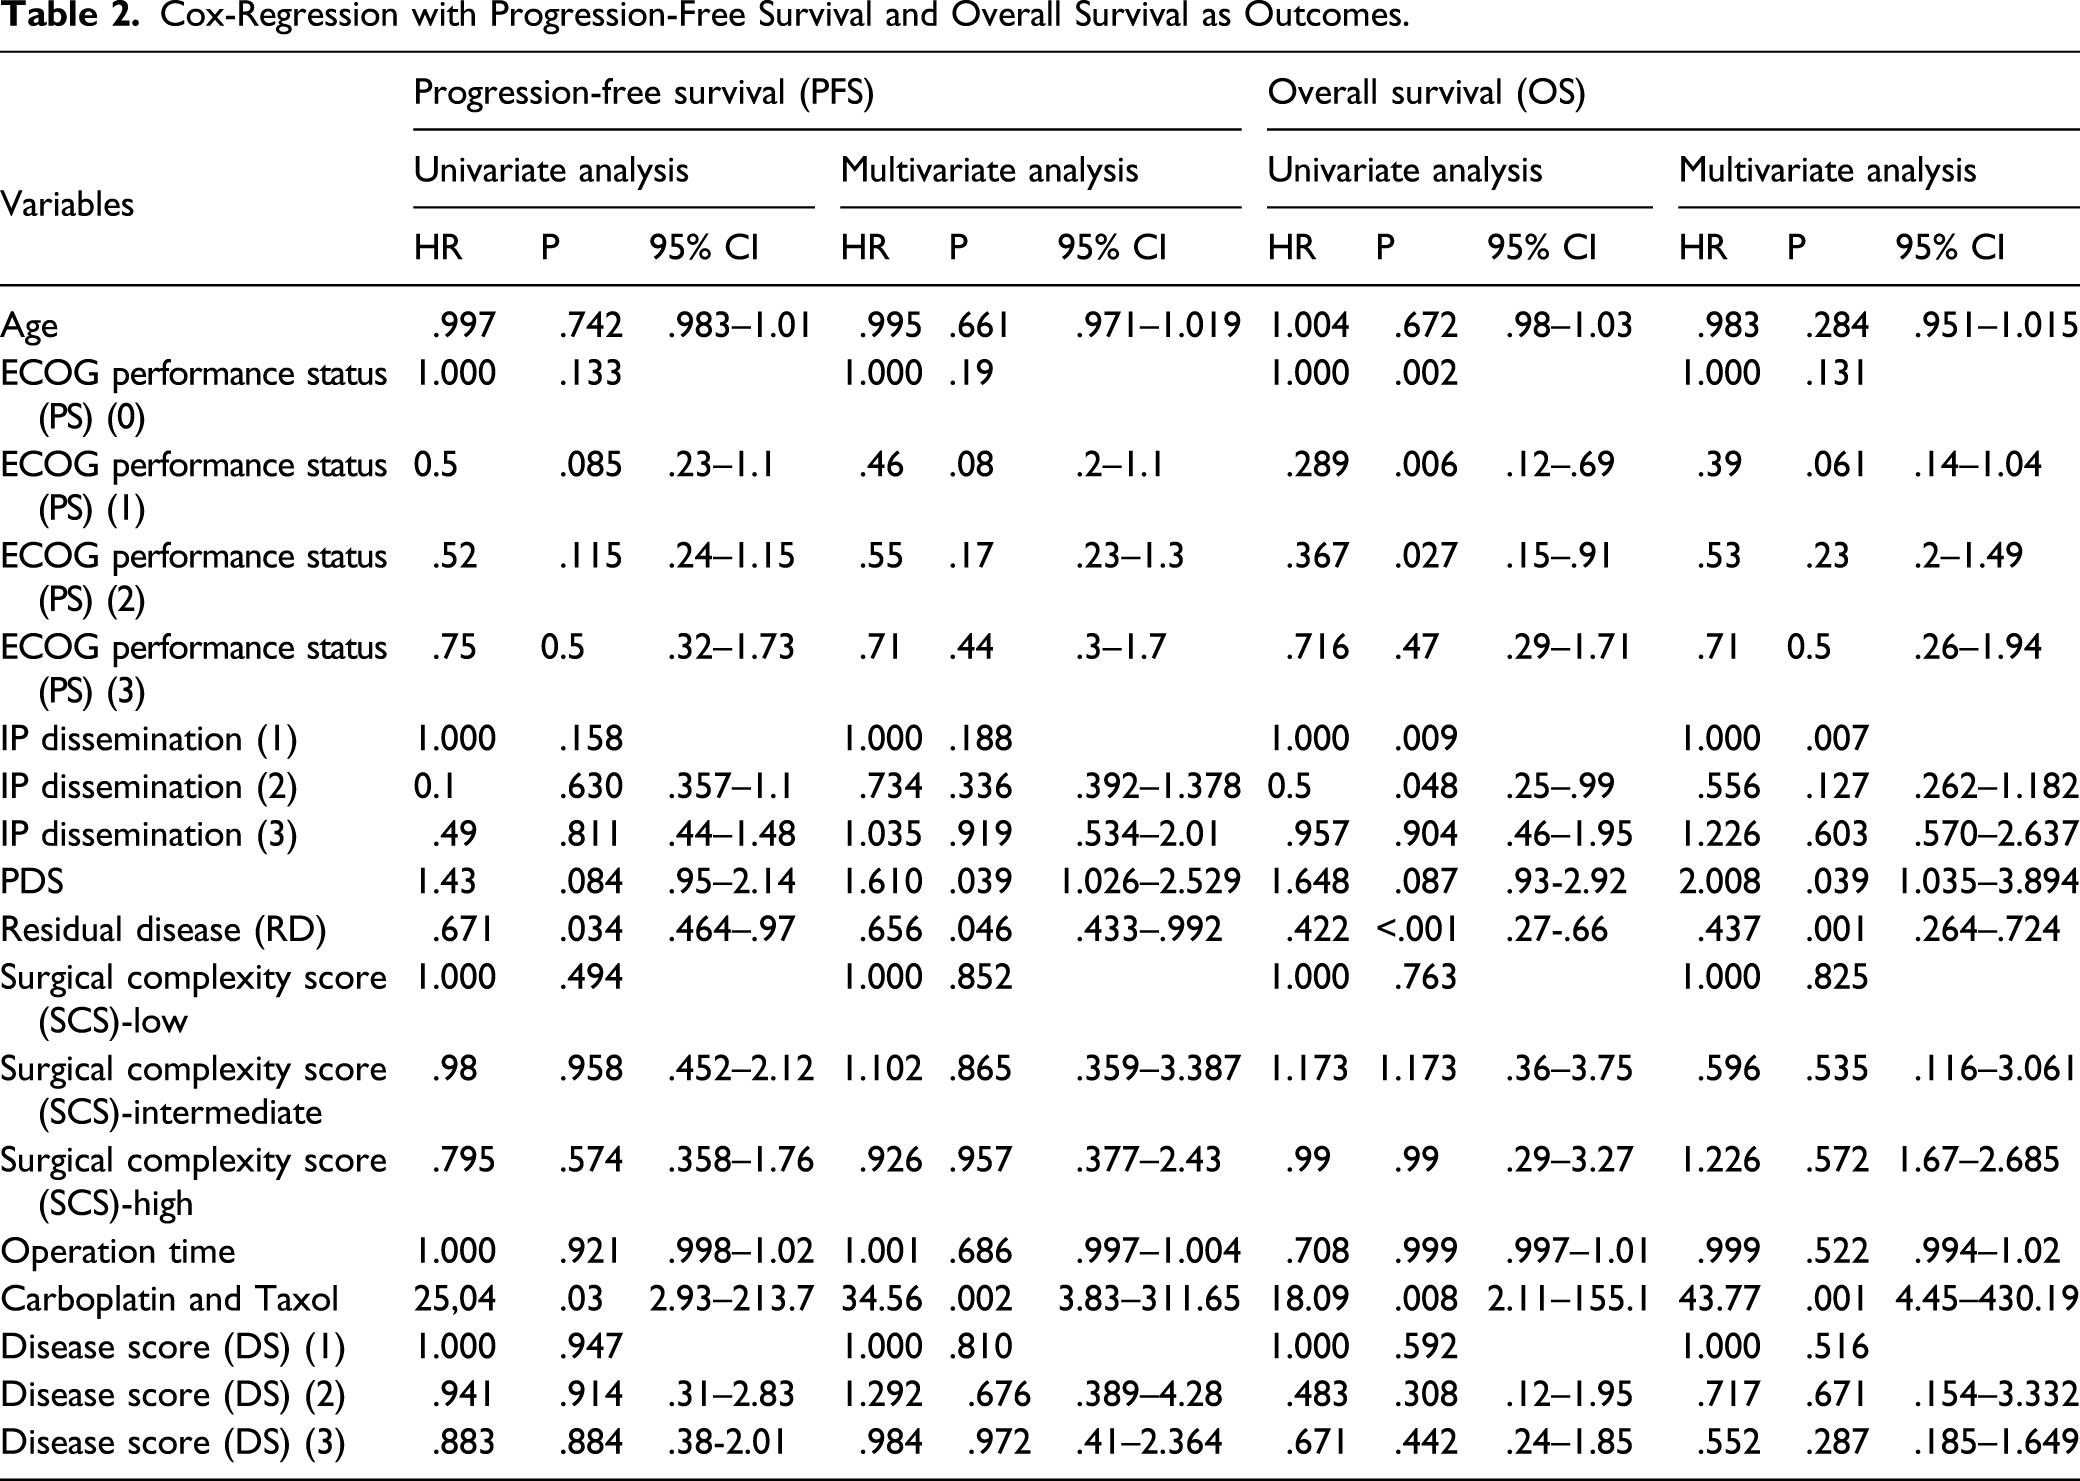
Cox-Regression with Progression-Free Survival and Overall Survival as Outcomes.

Cohort survival outcomes. Kaplan–Meier curves demonstrating (A) PFS and (B) OS analysed by complete and incomplete cytoreductive outcomes. (C) Stratification of residual disease according to intraperitoneal dissemination pattern. (D) Kaplan–Meier curves demonstrating OS according to IDP. Haematogenous metastases negatively affect OS, potentially highlighting difficulty to achieve complete cytoreduction (p:0.000).
We estimated the relative importance of the features using the chi-square test and the MRMR approaches. The results are shown in Figure 3. For the 2-year survival prediction, the mean predictive accuracy of the ML models reached 73%. As expected, the feature importance between PFS and OS outcomes was not identical. For the 2-year OS prognosis prediction, the two best performance results were achieved with the SVM – Quadratic Kernel classifier using the top-3 features (standard chemotherapy, low DS and increased SCS) selected by the MRMR algorithm Area-Under-Curve (AUC = .66) and the k-NN (5 Neighbors) with the top-4 features (standard chemotherapy, no RD, PS and low DS selected by the chi-square test [AUC = .63]) (Figure 4). The combination of good PS, PDS and increased SCS best predicted 2-year PFS with the accuracy reaching 63.5% (AUC = .62) by the SVM – Quadratic Kernel – classifier. Feature ranking graphs for 2-year PFS: (A) Univariate feature ranking for classification using chi-square tests. (B) Multivariate feature ranking using MRMR algorithm; feature ranking graphs for 2-year OS: (C) Univariate feature ranking for classification using chi-square tests. (D) Multivariate feature ranking using MRMR algorithm. Example of a confusion matrix showing a) prediction accuracy for 2-year OS by use of (A) the SVM classifier with Quadratic Kernel (AUC: .66) (B) the k-NN (AUC: .63). The example shows that the prediction is more accurate for the negative class compared to the positive class.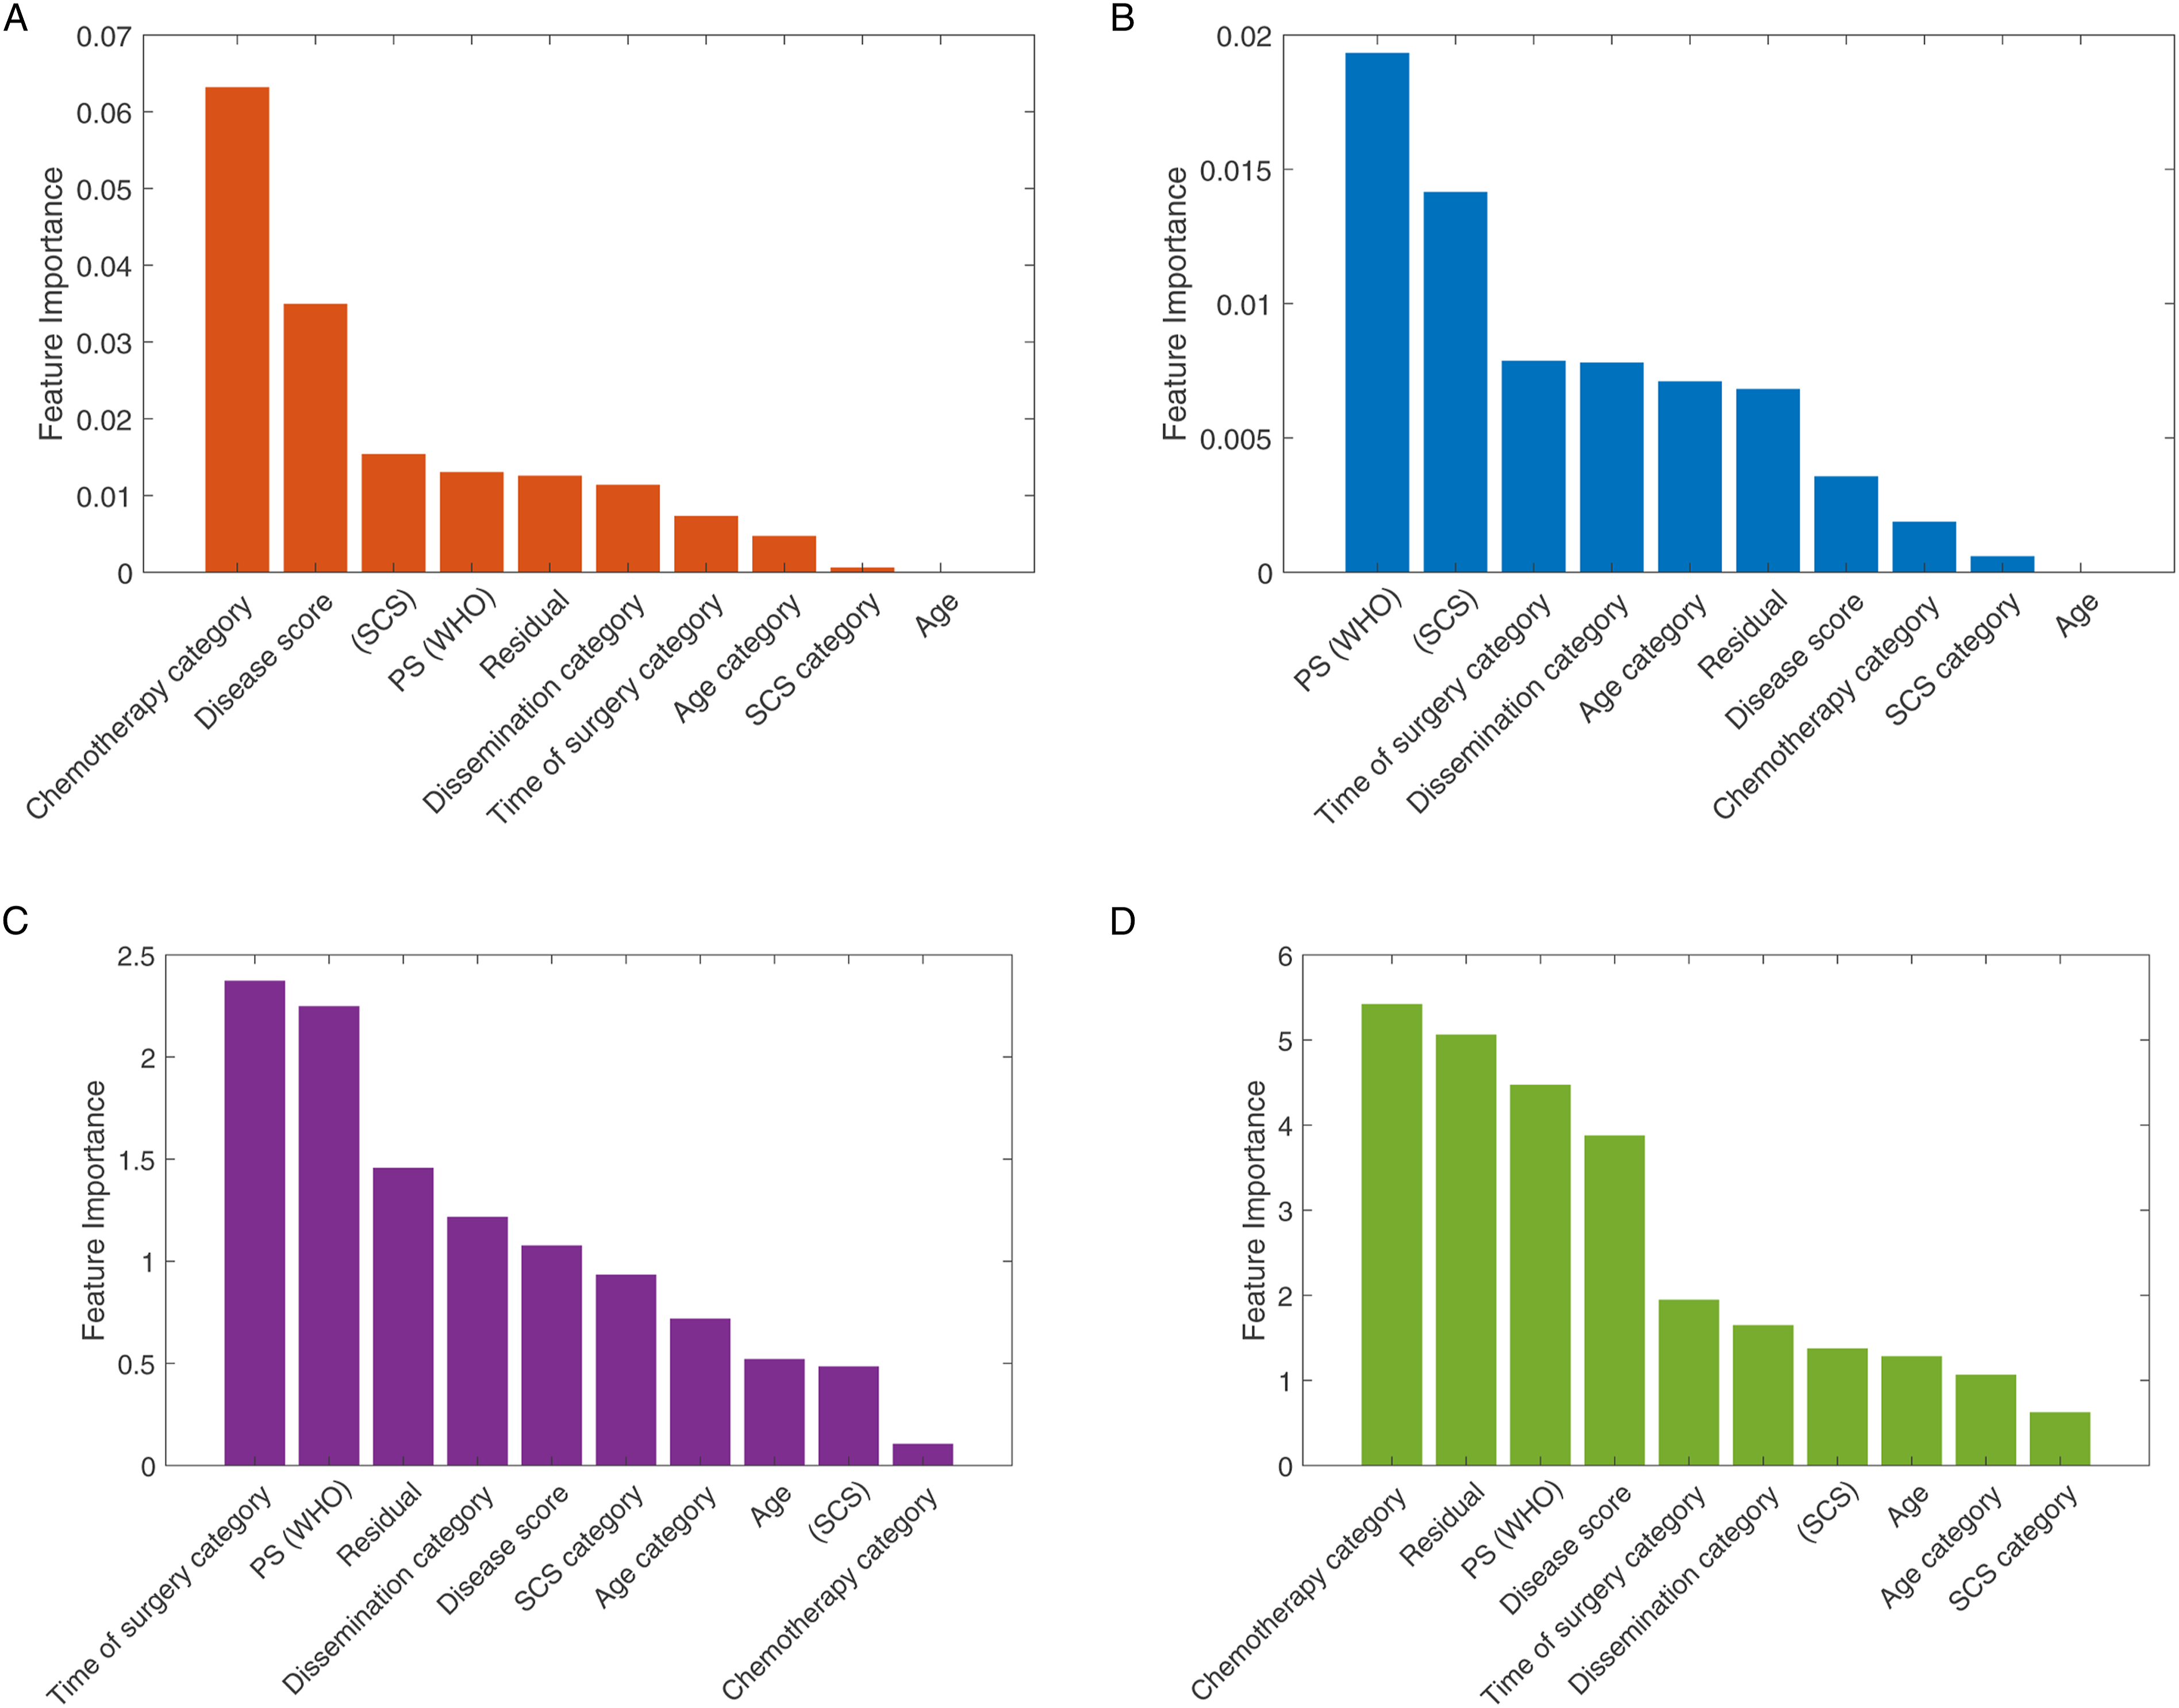

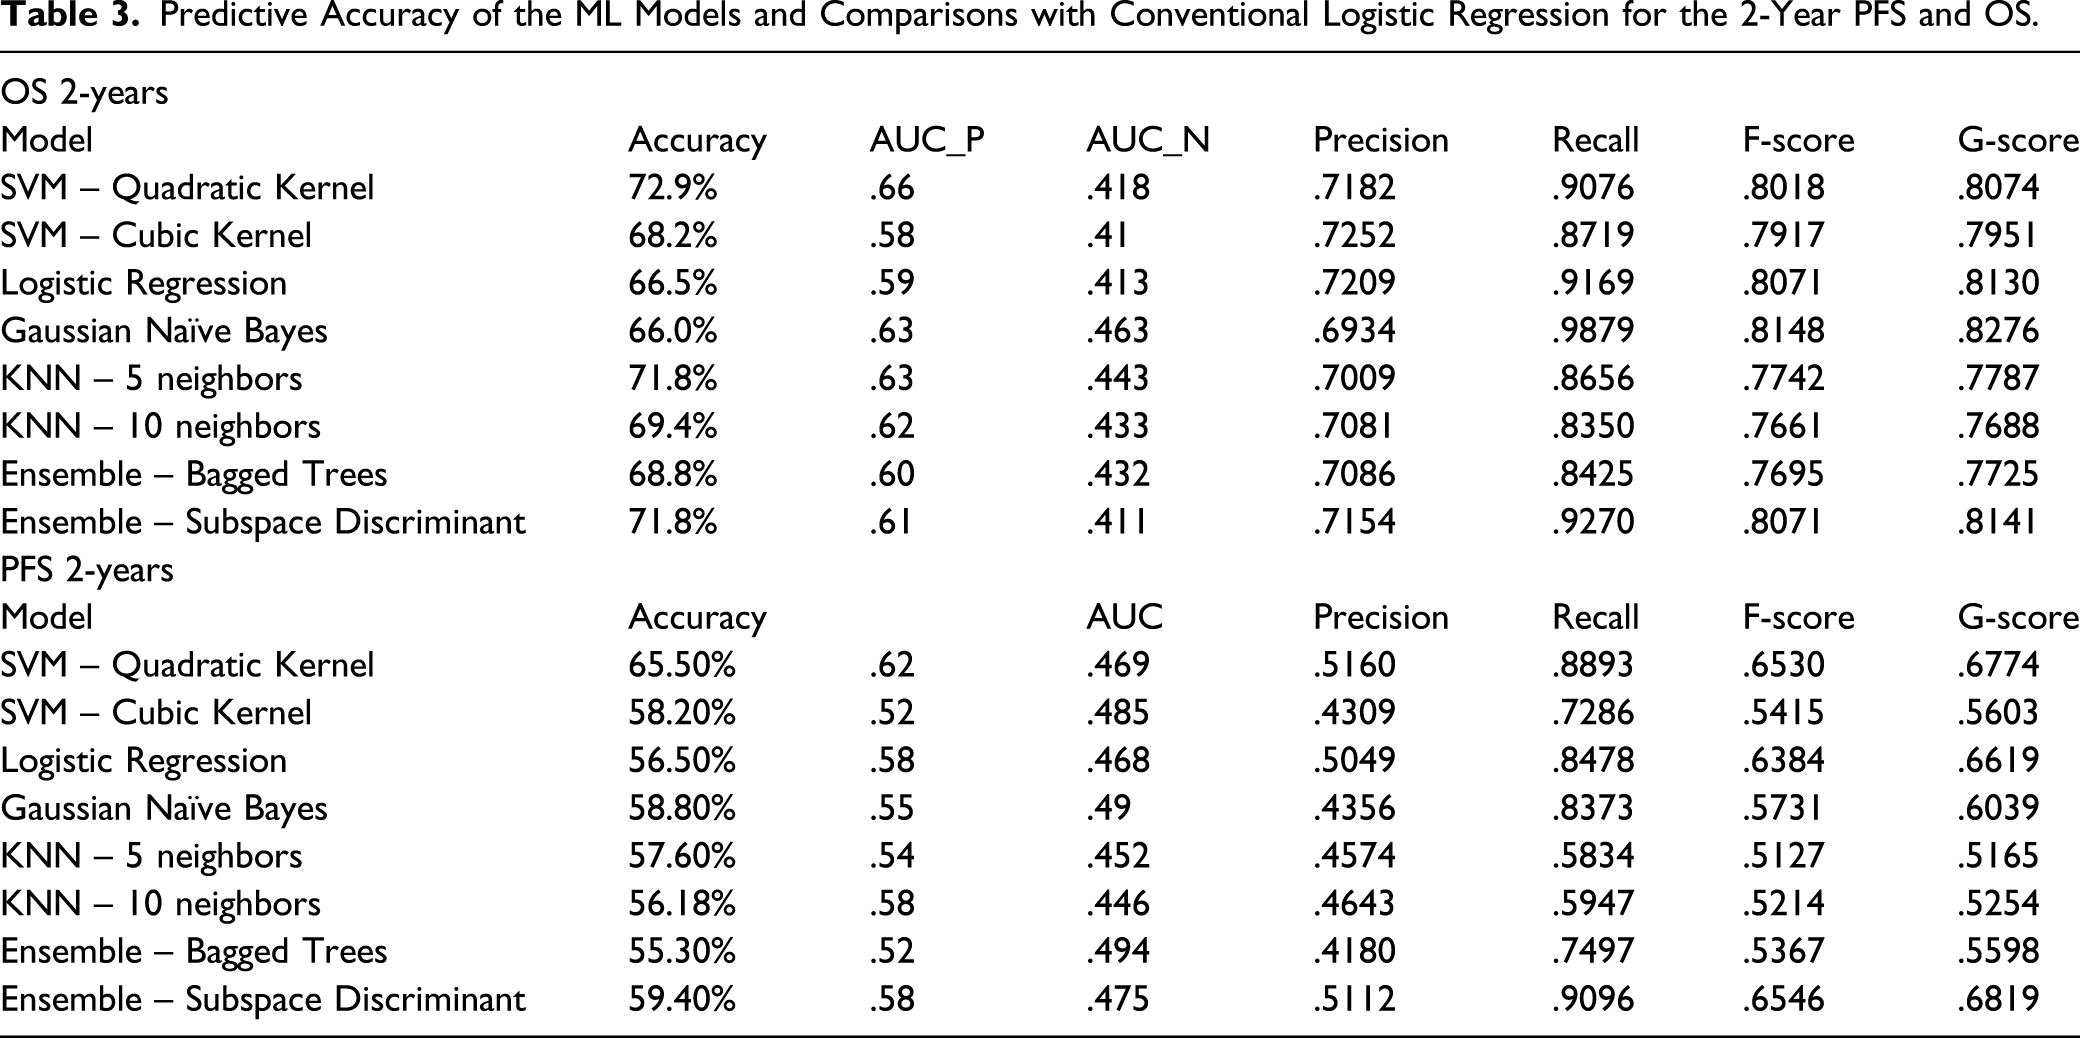
Predictive Accuracy of the ML Models and Comparisons with Conventional Logistic Regression for the 2-Year PFS and OS.
Discussion
Women with HGSOC have a heterogeneous response to treatment and prognosis. Establishing the prognosis of HGSOC women remains a critical part of their evaluation. Machine Learning appears a promising approach for accurate prognosis estimation. 31 We demonstrated the feasibility and validity of using feature selection algorithms to ensure the highest performance of the 2-year prognosis ML prediction model. We employed the chi-square test of independence 24 and the MRMR method 13 for categorical data in a stepwise fashion, and verified the validity of the feature selection by comparing it to the exhaustive search method. After applying feature ranking with the described methods, we followed a feed-forward selection approach, 32 considering the ranking of the features for each different ML model. Forward selection is an iterative method in which, at each iteration, we continue to add the feature which best improves our model, until an addition of a new variable does not improve the performance of the model. The feed-forward selection helped define the set of lower number of features that provided the highest accuracy of prediction.
Classification problems typically involve a high time complexity and low performance when many features are used but will have a low time complexity and high performance for a minimum size and the most effective features. 33 HGSOC prognosis is a complex matter and failure to address this, can lead to a less meaningful interpretation of outcome data. Nevertheless, our effort allowed us to minimise redundancy and identify those discriminant features with the maximal relevance to the 2-year prediction estimation.
We adopted a binary classification approach to exploit the use of predictive ML models. Several different ML models were explored and tested. The SVM and k-NN algorithms outperformed the Logistic Regression model with respect to prediction accuracy indices. The maximum accuracy reached 73%. The predictive accuracy of the 2-year PFS was lower than the 2-year OS for all models due to cardinality of the classes. Firstly, the data classes were imbalanced, as indicated for the 2-year prognostic periods. Unbalanced classes lead to insufficient training for the less populated class, thus biasing the prediction towards the more populated class. This was reflected in the difference between the AUC values for the 2 classes, but also in the wide variation amongst other classification performance metrics, against the accuracy, as reported in Table 3. This justified the use of AUC as a performance indicator. The accuracy may not be often adequate for assessing model performance, as it tends to give advantage to models that always output the class with the highest frequency. Secondly, AUC is independent of cut-off point choices, and hence keeps the choice of clinical applications open beyond the analysis. Another explanation for the results comes from the inherent nature of the predictive parameters. Progression-free-survival is by nature heavily quantised, as time to relapse is potentially associated with the pre-scheduled screening. On the other hand, by definition, OS has a higher temporal resolution. For those cases where the data classes were unbalanced, the tested methods performed similarly to Logistic Regression.
The mean prediction accuracy figures indicate the potential in building eventually a combinational classifier that could potentially outperform conventional Logistic Regression, which is commonly used in the clinical setting. A maximum accuracy at 73% is satisfactory, but closer to 80% would have been preferable. The size of the dataset and the inherent characteristics of the categorical data are the main reasons for these results. Another reason may be the high correlation amongst the variables that may render the model partly unstable due to collinearity (which further exists when the variables are increased. To address this, we examined the correlation amongst the variables and produced a correlation heatmap of the features included in the models. A rather weak correlation amongst features was demonstrated (Figure 5). Only in the 2 cases where we chose to include both categorical and the continuous variable, for example, age and age category, did we observe high correlation values. The low correlation indicates that we do not need to apply feature selection to alleviate features for their collinearity, but rather to identify the combination of features that can provide a reliable prognosis prediction. Correlation heatmap of the features included in the ML models demonstrating the correlation amongst the features using a variation of Pearson’s R correlation coefficient. The colours in the heatmap represent the correlation coefficients. A weak correlation amongst features was demonstrated.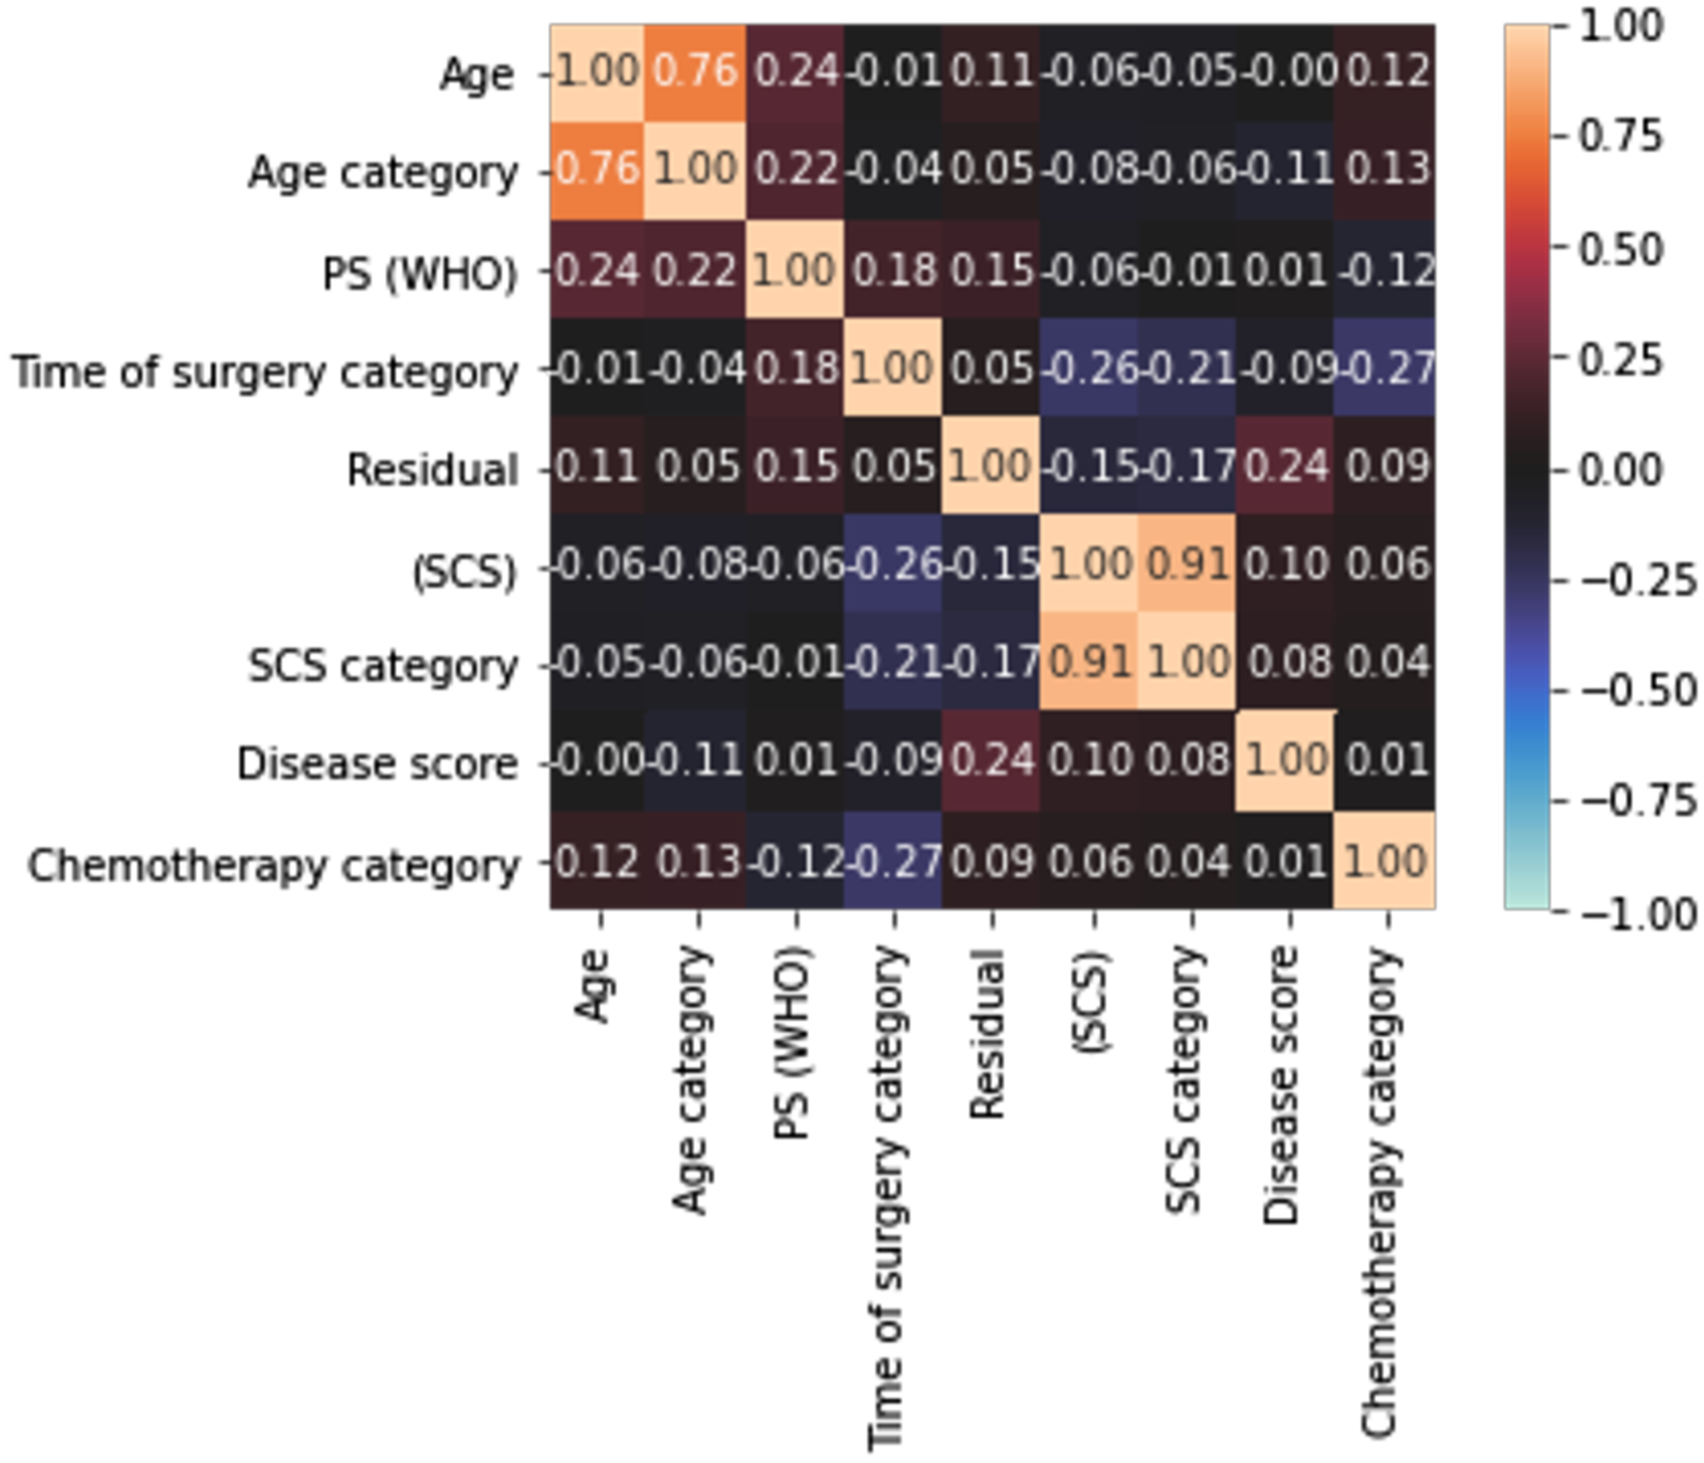
We acknowledge the complexity of the predicting variables; some were not ready-made and converted into categorical classifiers. Starting with simple classifiers and then gradually proceeding with more complex classifiers, remains one of the ML principles, which could potentially affect the prediction accuracy of the model. 33 Nonetheless, the ML approach is proving versatile. Both recall and precision, often inversely related, were greater than 80%. In this way, many potential clinical applications could be captured by this model, should this be used in a cancer diagnostic system, where sensitivity and positive predictive value are greatly appreciated.
Enshaei et al. compared a variety of algorithms and classifiers with conventional Logistic Regression statistical approaches to demonstrate the role of ML in providing prognostic and predictive data for ovarian cancer patients. 34 In a cohort of 668 patients, he demonstrated that an artificial neural network algorithm could predict OS with high accuracy (93%) and an AUC of .74, which outperformed Cox regression. Novel ‘radiomic’ descriptors of ovarian tumour phenotype and prognosis have been recently validated in a reliable and reproducible fashion.35,36 The value of ML and conventional systems to provide critical diagnostic and prognostic prediction for patients with EOC before initial intervention based on blood biomarkers has been also demonstrated. 37 Cohort expansion to a larger sample size is expected to improve predictability.
In addition to performance comparison, we identified the features with the highest discriminant power (top-4) for the 2-year HGSOC prognosis prediction. Although the list for features was slightly different between chi-square test and the MRMR algorithm, some features were common for both methods. Equally, we compared our feature selection methods with regularization methods, such as Lasso,
38
and Elastic Net,
39
as shown in Figure 6. As expected, these methods resulted in a different ranking of the features, as they are usually applied on higher dimensional feature space. Nevertheless, the result confirmed a common subset of features including RD, ECOG PS and DS that appeared on the top-5 from all tested methods, thus confirming the validity of the employed feature selection methods (Figure 6). A) Feature ranking for PFS based on the Lasso method. (B) Feature ranking for OS based on the Lasso method. (C) Feature ranking for PFS based on the Elastic Nets method. (D) Feature ranking for OS based on the Elastic Nets method.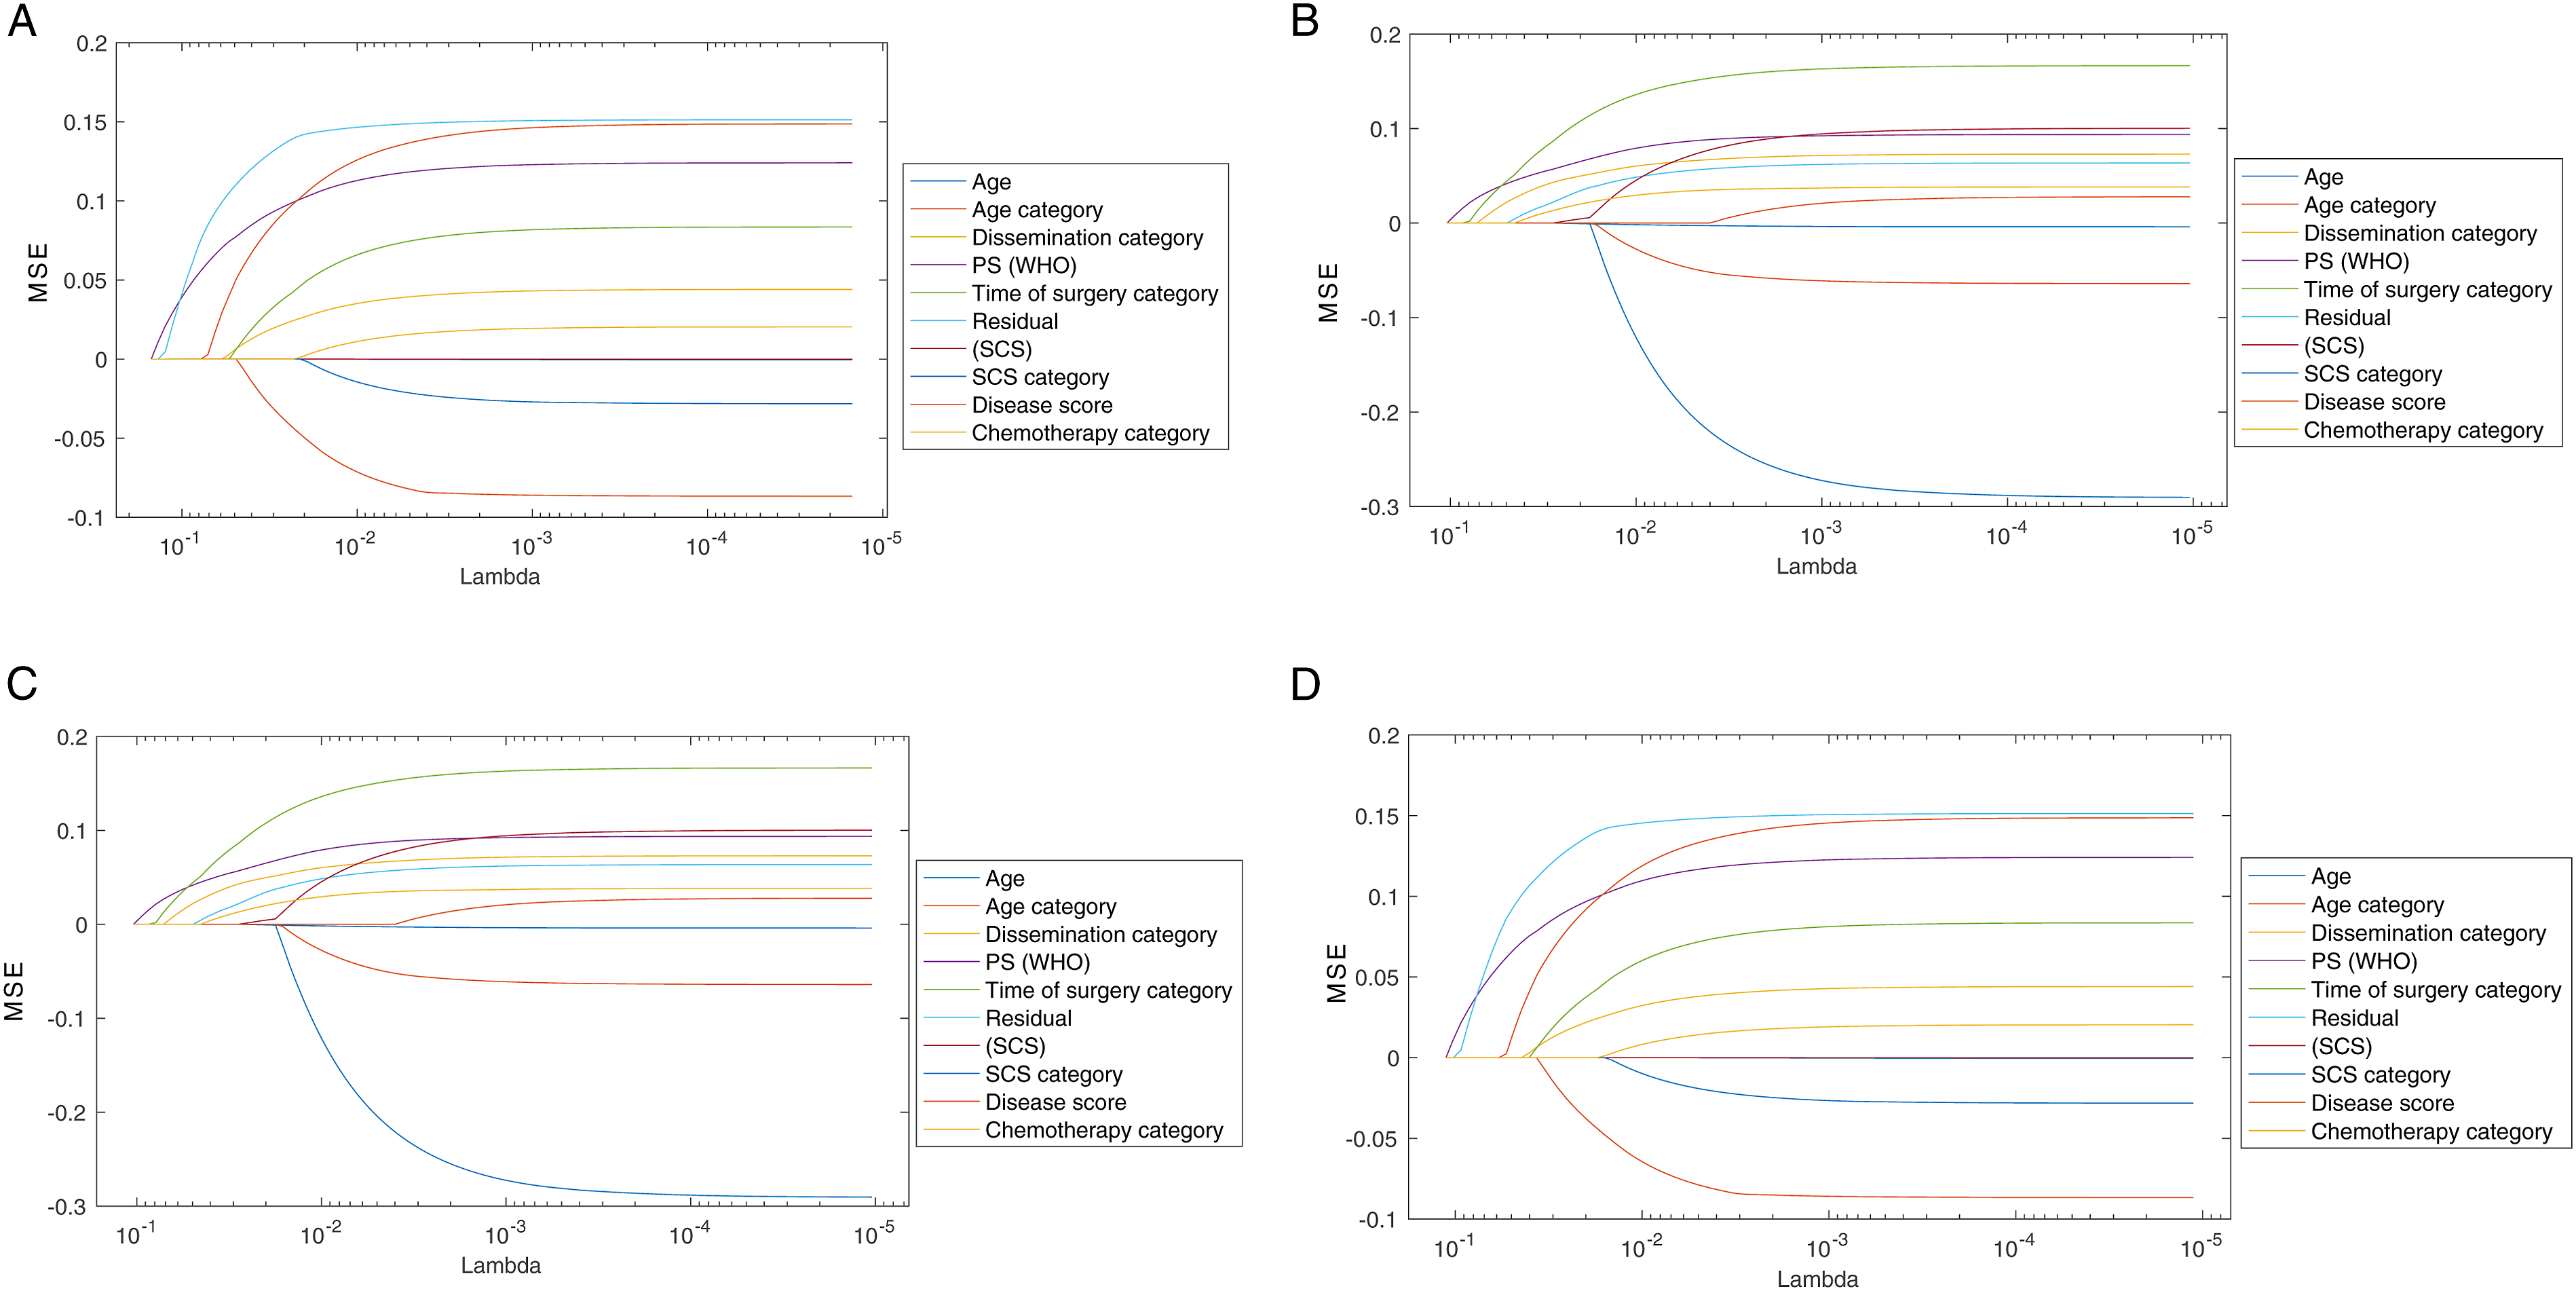
The probability of achieving a cancer-free state (PFS) was maximised through a combination of primary surgery, good ECOG status, IDP and maximal surgical effort. In the era of precision medicine, the use of either NACT or PDS with no definite mechanisms to predict outcomes can lead to significant variations in practice. Previously, patient stratification was proposed according to patterns of tumour spread (reflecting the biologic behaviour of HGSOC), response to chemotherapy and prognosis to make a more rational decision between PDS and NACT-IDS. 40 Our data may provide the potential for more tailored approaches. The value of RD following PDS remains less diluted than following IDS and does carry the anticipated survival effect. 41 Both NACT and PDS have the same efficacy when used at their maximal possibilities, but their toxicity profile is different. 42 Nevertheless, most patients with advanced-stage HGSOC should benefit from primary surgery.
For the 2-year OS period, only PS retained its survival benefit, in addition to standard chemotherapy, status of complete cytoreduction and the tumor burden. Good performance status remains pivotal and, efforts to optimise baseline functional status and minimizing surgical complications may improve discharge rates and post-operative functional status. 42 The extent of disease at surgery (DS), in line with current literature, was more prognostic of OS than PFS. Indeed, the finding of bulky and diffuse disease spread may reflect high biological aggressiveness or long disease existence, allowing for advanced growth. 43 At a second glance, this is all interesting, as the factors predicting recurrence and death would not be separable, under the proportional hazard’s assumption. We surmise that surgery and good medical health confer a transient survival benefit, but for overall prognosis, factors suggestive of the tumour biological behaviour including response to standard chemotherapy may be equally influential.
In our study, complete surgical cytoreduction remained an independent determinant of survival, potentially on the presumption of increased surgical effort. 44 Where surgery results in residual disease, the survival advantage from surgery is lost (Figure 6). Whilst we acknowledge that such results may be influenced by patient selection and chemotherapy exposure, they are comparable to international peers. In our cohort, the prolonged median overall survival of up to 38 months was comparable with that reported in the SCORPION trial 45 and substantially better than the 27 months from the individual patient meta-analysis of the EORTC and CHORUS trials. 46 Complete surgical resection, to ‘reset the clock’, may partly overcome the negative effect of tumour load, in line with a recent study. 47 Standard chemotherapy does not reduce the eventual likelihood of death from ovarian cancer per se. Despite the generally accepted use of chemotherapy, delayed initiation of chemotherapy is associated with adverse clinical outcomes. It is advocated to start adjuvant chemotherapy within five to six weeks following debulking surgery. 48
Strength of this study was the feature selection, aka the selection of the prediction variables, prior to building the classifiers. Except for our exhaustive search for the best combination of features, the literature is rich in various methodologies, including forward selection and recursive feature elimination. 49 In that sense, we focused solely on clinical pre-operative and intra-operative features, which was perhaps more practical and easier to obtain than molecular, genomic or radiomic features, thus the developed models are expected to have more clinical applicability. We did not address the value of surveillance modalities to detect recurrence during follow-up as we religiously follow the international guidelines. Another strength was the inclusion of initial disease distribution imaging data that proved more simplistic but useful than potential integration of ‘radiomics’ data. In our prognostic model, we included IDPs, which were pathologically verified, to demonstrate the anatomical extent of disease. Such preoperative imaging information is essential for prognostication and can be used to predict surgical resectability. Baseline IDP can be a prognostic factor, potentially addressing the aggressiveness of the disease and the difficulty to achieve complete cytoreduction (Figure 2C and D). Classification of such patterns can help counsel patients initially on their prognosis and identify those who might benefit from intraperitoneal chemotherapy to complement their treatment. 50
This analysis comprised a homogenous fully curated cohort, which enabled a close collaboration with computer engineers toward prognosis improvements using multifactor analysis. 51 The stimulating debate whether ML-based algorithms are ‘smarter’ than human brains is largely irrelevant. The algorithms are reproducible because ML retains the strength of the structural model used for the prognosis prediction, even when applied in other populations and reveal different prediction features. Our effort represented a single institution experience, albeit we acknowledge the different practices worldwide, deriving from varying interpretations of evidence. Standardisation of surgical practice and identification of centres of excellence will potentially benefit patients from a maximal effort approach at all possible levels. 52
Conclusions
We investigated the prediction of survival in advanced-stage HGSOC using clinical variables. We focused our analysis on the comparison of several classification models, including conventional regression analysis, under the same resampling conditions. Appropriate feature selection is required when building an HGSOC model for 2-year prognosis prediction by ML. For HGSOC prognosis, one should consider not only the patient’s disease burden but also their overall medical status and ability to undergo extensive surgery, resulting in survival benefits alongside with standard chemotherapy.
Footnotes
Declaration of Conflicting Interests
The author(s) declared no potential conflicts of interest with respect to the research, authorship, and/or publication of this article.
Funding
The author(s) received no financial support for the research, authorship, and/or publication of this article.
Ethical Approval Statement
This study was approved by the Leeds Teaching Hospitals (LTHT) Institutional Review Board (MO20/133163/18.06.20) and informed written consent was obtained.
Abbreviations
The following abbreviations are used in this manuscript: AUC, Area under Curve; CT, Computer Tomography; DS, Disease Score; ECOG, Eastern Cooperative Oncology Group; EOC, Epithelial Ovarian Cancer; FIGO; Federation International of Obstetrics and Gynaecology; IDP, Intraperitoneal Dissemination Pattern; IDS, Interval Debulking Surgery; K-NN, K-Nearest Neighbor; ML, Machine Learning; MRMR, Minimum Redundancy Maximum Relevance; NACT, Neoadjuvant Chemotherapy; OS, Overall Survival; PFS, Progression Free Survival; PS, Performance Status; RD, Residual Disease; R0, No Residual-Complete Cytoreduction; SCS, Surgical Complexity Score; SD, Standard Deviation; SJUH, Saint James’s University Hospital; SVM, Support-Vector-Machine.