
Abstract
Suffering is a universal, subjective experience distinct from symptoms or diagnoses. Most existing measures reduce it to single items or symptom checklists, and even recent advances fail to capture its full breadth or the dimension of overcoming suffering. The Suffering Experiences Questionnaire (SEQ) provides a comprehensive, theory-agnostic instrument assessing both suffering and overcoming across contexts. The SEQ was developed in four steps. First, the initial pool of over 100 items was generated from clinical experience. Second, graduate-students reduced it to 91 items. Third, an expert panel of 14 scholars and clinicians refined it to 64 items divided between suffering and overcoming. Finally, three graduate students reviewed items for readability. Two validation studies assessed psychometric properties and utility. Study 1 reduced the SEQ to 20 items and established its structure and internal consistency, along with a 10-item short form (SEQ-10). Study 2 confirmed structure, reliability, and convergent and concurrent validity. Both versions converged with and predicted symptomatology and well-being outcomes and were meaningful from Western and Eastern perspectives. The SEQ and SEQ-10 are the first non-symptom-based measures integrating suffering and overcoming. Both demonstrate strong psychometric properties and clinical utility. Strengths, limitations, implications, and future directions are discussed.
Introduction
Suffering is a fundamental dimension of the human condition, yet it has received comparatively limited and fragmented attention within scientific research. Across disciplines, suffering is conceptualized in distinct and sometimes divergent ways, reflecting different theoretical assumptions and methodological priorities.
In medicine and clinical science, suffering is commonly defined as a multidimensional threat to the integrity of the person, encompassing physical, psychological, social, and existential disruption, and extending beyond pain or distress alone (Cassell, 1982). A dominant framework in medical and clinical sciences is the biopsychosocial model, in which suffering is understood as emerging from complex interactions among biological, psychological, and social factors (Engel, 1977; Gatchel et al., 2007). Within this framework, suffering is often attributed to genetic vulnerabilities, such as mutations or polymorphisms; medical conditions, including pain and chronic illness; psychological symptoms, such as stress, anxiety, or depression; and social stressors, including loneliness, relational conflict, or migration. Accordingly, interventions and coping strategies are typically designed to reduce or manage these stressors, with the aim of alleviating symptoms and restoring functioning.
Psychological models further emphasize the role of sustained negative affect combined with cognitive appraisals of helplessness, loss of control, or violations of meaning, distinguishing suffering from transient stress or momentary discomfort (Lazarus & Folkman, 1984; Park, 2010). From philosophical and existential perspectives, suffering is described as a rupture in coherence, identity, or purpose, rather than as mere dissatisfaction or hardship (Frankl, 1959). Social and anthropological approaches situate suffering within relational, moral, and structural contexts, highlighting how social conditions, power dynamics, and cultural meanings shape lived experience (Kleinman et al., 1997).
Contemplative traditions, particularly Buddhism, offer a markedly different conceptualization of suffering. Rather than locating suffering primarily in adverse events or external conditions, these traditions describe suffering as a pervasive unsatisfactoriness rooted in mental reactivity, attachment, and disconnection (Bodhi, 2000; Rahula, 1974). In this view, suffering arises from three fundamental causes, namely craving or greed, aversion or hatred, and delusion, understood as misperception of reality (Gethin, 1998). Suffering is thus framed not only as an inevitable feature of human life but also as deeply intertwined with habitual cognitive, emotional, and behavioral patterns that perpetuate dissatisfaction and disconnection (Harvey, 2013; Wallace & Shapiro, 2006).
Within this contemplative framework, the alleviation or transcendence of suffering is cultivated through the Noble Eightfold Path, which integrates ethical conduct, meditative training, and wisdom (Bodhi, 2000; Rahula, 1974). Practices such as mindfulness meditation, loving kindness meditation, and compassion training are considered central methods for weakening attachment and reducing aversion (Dahl et al., 2015; Nicolardi et al., 2024). These practices also aim to foster self-transcendence and interconnectedness, with the explicit goal of alleviating suffering and transforming the conditions that sustain it (Teasdale & Chaskalson, 2011).
Taken together, these perspectives underscore that suffering is a multifaceted phenomenon that cannot be fully understood through any single disciplinary lens. Beyond these definitions and conceptualizations, suffering also resides in the subjective experience of the individual, encompassing how it is perceived, interpreted, and lived within a given personal, relational, and cultural context (Rodgers & Cowles, 1997; VanderWeele, 2019).
Measuring Suffering
Most existing measures of suffering rely on either a small number of items or narrowly focus on symptoms associated with suffering. One of the most basic approaches consists of single item assessments asking respondents to directly rate the extent of their suffering, for example, “To what extent are you suffering?” (Ganzini et al., 1999; Schulz et al., 2010). Responses are typically provided on a numerical continuum ranging from the absence of suffering to extreme suffering and may refer to a specific time frame, such as the past 1 or 2 weeks, or to suffering more globally. Although such measures are pragmatic and offer a rapid snapshot of perceived suffering, they do not capture its multidimensional, contextual, and experiential nature.
In contrast, most multidimensional measures conceptualize suffering primarily through symptom profiles. Early instruments focused on emotional and physical symptoms, such as the 20-item measure developed by MacAdam and Smith (1987), which assessed emotions including fear, sadness, and hope, as well as physical symptoms such as appetite and sleep quality. Similarly, Aminoff and Adunsky (2005) assessed suffering among individuals with dementia using indicators such as pain, pressure ulcers, and malnutrition. Other tools extended symptom-based approaches to include broader psychological and existential concerns. For example, the Structured Interview for Symptoms and Concerns (SISC; Wilson et al., 2004) assesses a range of physical, psychological, and existential experiences, including pain, dyspnea, loss of dignity, anxiety, hopelessness, and desire for death. Likewise, the State of Suffering Five (SOS-V; Ruijs et al., 2009) evaluates a wide array of potential objects of suffering across domains including symptoms, loss of functioning, personal and social aspects, and illness related factors.
The Suffering Scales (SS; Schulz et al., 2010) represent one of the most comprehensive symptom-oriented instruments, covering physical, emotional, and existential dimensions through 42 items. However, the SS yields multiple subscale scores rather than a single global index of suffering, which limits its utility for assessing suffering as a unified construct. Moreover, the SS has primarily been validated and used in older clinical populations and their caregivers, including individuals with Alzheimer’s disease, essential tremor, and hospice caregivers (Allen et al., 2021; Fowler et al., 2021; Monin et al., 2017; Morgan et al., 2017). To date, it has not been validated or used in nonclinical populations.
In a comprehensive review, VanderWeele (2019) identified three major limitations of existing suffering measures. First, many instruments are illness focused and therefore poorly suited for nonclinical contexts or forms of suffering unrelated to disease. Second, most measures emphasize symptoms or causes of suffering rather than the subjective experience of suffering itself. Third, severe suffering may occur in the absence of multiple symptoms or identifiable causes, such as in cases of profound loneliness or loss of meaning, leading symptom-based measures to underestimate the individual’s lived experience.
To address these limitations, VanderWeele (2019) introduced the Personal Suffering Assessment (PSA), a brief seven-item measure designed to capture core dimensions of suffering, including its intensity, duration, uncontrollability, pervasiveness across life domains, disruption of life purposes, and threats to personhood. Empirical studies have demonstrated that this measure is reliable and predictive across both clinical and nonclinical populations. Higher levels of suffering assessed with this instrument have been associated with subsequent increases in anxiety and depression, as well as lower psychological and overall well-being, across longitudinal and cross sectional studies and across cultural contexts (Cowden et al., 2021; Cowden, Seidman, Duffee, et al., 2022; Cowden, Seidman, Węziak-Białowolska, et al., 2022; Ho et al., 2022).
When measuring suffering, it is equally important to consider how individuals relate to it, cope with it, and potentially move beyond it. A comprehensive assessment should therefore capture not only the depth and pervasiveness of suffering but also the processes through which individuals respond to and engage with it, allowing suffering to be understood as a dynamic and lived experience. To date, processes related to overcoming or adapting to suffering have largely been examined separately from suffering itself. This work has primarily relied on measures of resilience or coping, such as the Brief Resilience Scale (BRS; Smith et al., 2008), the COPE scales (Carver et al., 1989), or the Connor–Davidson Resilience Scale (CD-RISC; Connor & Davidson, 2003). These instruments assess individuals’ capacity to recover from stress or manage challenging situations and provide valuable information about adaptive functioning. However, they primarily focus on responses to stressors or discrete adverse events, rather than on the lived experience of suffering itself. As a result, they do not capture the experiential depth of suffering, nor do they assess how individuals endure, make sense of, or are potentially transformed by prolonged or existential forms of suffering. This limitation underscores the need for measurement approaches that integrate both the subjective experience of suffering and the processes through which individuals engage with, respond to, and potentially transcend it.
The Suffering Experiences Questionnaire
The Suffering Experiences Questionnaire (SEQ) was developed to assess suffering as it is subjectively lived, while also capturing how individuals cope with, relate to, and move beyond suffering over time. Rather than grounding suffering in a single theoretical model, causal explanation, or symptom-based taxonomy, the SEQ draws on clinical, existential, and contemplative perspectives to reflect the diversity and complexity of suffering experiences alongside the processes through which individuals engage with them. In this sense, the SEQ is theory informed but not theory bound. Accordingly, the items of the SEQ were deliberately written in phenomenological and everyday language that reflects widely shared experiential features of suffering across clinical, existential, psychological, and cultural traditions.
Within this framework, suffering is conceptualized as a lived experiential state that integrates both phenomenological distress and meaning based appraisals. Suffering is therefore not defined solely by immediate feelings such as being overwhelmed, defeated, or trapped, but also by how these experiences are interpreted in terms of meaning, purpose, agency, and connection. Appraisals such as hopelessness, meaninglessness, or perceived inescapability are treated as constitutive components of suffering itself, rather than as secondary consequences. Accordingly, the SEQ captures suffering as a multidimensional experiential configuration in which felt distress and interpretive construals jointly shape how suffering is subjectively lived.
The SEQ also conceptualizes overcoming as a dynamic and state dependent process that can coexist with suffering, rather than as its absence or a final endpoint. Overcoming reflects the capacity to sustain meaning, hope, agency, and moments of psychological or existential relief while suffering persists. From this perspective, suffering and overcoming are treated as partially independent processes that may fluctuate asynchronously over time.
By integrating both the experience of suffering and the processes of overcoming within a single measure, the SEQ addresses a critical gap in existing instruments, which tend to focus narrowly on stress, adversity, or illness in isolation. This integrative approach allows suffering to be assessed as a dynamic experiential phenomenon and supports the use of the SEQ across both clinical and nonclinical populations.
In the following sections, we describe the methodology used to design and develop the items of the SEQ in accordance with its two central dimensions, namely the suffering dimension and the overcoming dimension. We then present two empirical studies conducted to validate the instrument. Study 1 focused on the development, testing, and refinement of the initial version of the SEQ, with particular attention to its factor structure and internal consistency, as well as the development of a shortened version, the SEQ-10. Study 2 reevaluated reliability and examined construct, convergent, and discriminant validity for both the full SEQ and the short form SEQ-10.
Study 1: Development, Factor Structure, and Internal Consistency of the SEQ and SEQ-10
Method
The content validation of the items and dimensions of the SEQ was conducted in four sequential steps. In the first step, drawing on both the suffering and overcoming suffering dimensions, as well as on the clinical experience of the first author (a licensed clinical psychologist with more than 12 years of active practice), an initial pool of over 100 items was developed. Both positively and negatively worded items were generated to capture a wide range of experiences of suffering and overcoming suffering. Items included multiple facets of suffering, such as perceiving it as pervasive, recurrent, persistent, profound, insurmountable, suffocating, overwhelming, continuous, inescapable, isolating, and disconnecting from self and world. They also captured experiences of being uncontrollable, trapped, powerless, caught in a never-ending cycle, or viewing life as pointless and meaningless. In contrast, the overcoming dimension included items reflecting experiences of connection, agency, the ability to find relief or escape, moments of ease, joy, purpose, fulfillment, and the capacity to find or sustain meaning despite the presence of suffering. All items were deliberately constructed to be simple and specific, with each item addressing a single aspect of suffering or overcoming suffering whenever feasible. In addition, the items were written to be applicable to individuals with or without medical conditions or psychological disorders, and to remain independent of symptom status.
In the second step, the preliminary pool of items was reviewed by five English-fluent graduate students (two Master’s and three PhD trainees in counseling psychology at the first author’s institution). The students were asked via email to provide written feedback on the clarity and precision of each item. This process led to the removal of several items due to poor wording and the rephrasing of many others to improve clarity. Following this step, 91 items remained.
The third step involved expert review. The revised list of items was sent to 23 experts identified through their leading publications and/or clinical work in areas related to suffering (e.g., distress, self-harm, suicide) and overcoming suffering (e.g., coping, flourishing, compassion), as well as in psychological scale development. Of the 22 experts, 14 agreed to review the material and provided written feedback on the dimensions and items. While some feedback was more detailed than others, all reviewers offered suggestions for improvements or changes to the questionnaire.
The panel of 14 participating experts included four clinical psychologists and one psychiatrist. It also comprised six university professors with prominent empirical and theoretical publications on suffering, flourishing, and compassion, as well as three university professors specializing in areas such as self-harm, suicide, and distress. Notably, three members of the panel had previously developed and published scales related to suffering. Most experts held senior academic or clinical positions at highly recognized institutions, and several brought expertise across multiple roles, for example both clinical and scholarly. All the comments and suggestions from the expert panel were carefully analyzed by the first author and were used to refine the items and strengthen the conceptual clarity of the two dimensions. A common recommendation was to substantially reduce the number of items. Many experts in the field suggested a final version with ideally 20 items or fewer, given the burden of administering such a questionnaire to participants. This consideration was particularly important when the measure is used with individuals who have medical conditions or psychological disorders, as well as with older adults, individuals in palliative care, and other vulnerable populations. This process resulted in a 64-item version of the scale, with 32 items portraying suffering and 32 items portraying overcoming suffering.
In the final step, a subset of graduate students (one Master’s and two PhD trainees) reviewed the revised pool of items for linguistic simplicity and clarity, again providing written feedback. At this stage, no items were removed, but several were edited for improved readability, yielding 64 items to be included in Study 1. Items were presented in random order (generated using ChatGPT 4.0) and rated on a Likert-type scale ranging from 1 (not at all applicable) to 5 (extremely applicable). Participants were instructed to indicate how often they experienced each statement, with an emphasis on reflecting their actual lived experience rather than what they believed their experience ought to be. Neither the graduate student reviewers nor the expert reviewers received monetary compensation for their participation.
Participants
In line with the objective of validating the SEQ in community-based samples, we recruited a community-based sample of adults in Canada through paid advertisements on social media platforms, for example Facebook, LinkedIn, and Instagram. This approach broadened reach beyond clinical settings and supported the inclusion of participants with diverse backgrounds. Participants were offered $50 gift certificates based on a draw with a rate of winning of 1/20. We aimed to obtain a sample of over 320 participants as this would be above the suggested 1:5 item-to-participant ratio (MacCallum et al., 1999; Reio & Shuck, 2015). Only participants who completed the entire survey, passed all attention check questions, and met the data quality criteria verified by Qualtrics were included in the final sample. This procedure ensured a high-quality sample.
Accordingly, the final sample comprised 1,103 participants, 76.5% women, 13.1% men, and 10.4% who reported another gender, for example trans or variant or non-conforming, or preferred not to answer. Most participants were White (79.1%) or mixed (7.5%). Most identified as heterosexual (67.9%), whereas 31.9% identified as LGBTQ+ or other. Most were either married (36.1%) or in a relationship (23.9%), whereas 35.4% reported being single, and a lower percentage living alone (21.7%), with the majority living with other people. The mean age was 43.4 ±15.4 years (range from 18 to 89), the mean years of education was 17.9 ± 3.40 years (range from 2 to 28), and the total meditation practice hours were 98.8 ±166 hours (range from 0 to 942). Additional descriptions of this sample are available in Table 1.
Demographic Characterization of Study 1’s Sample.
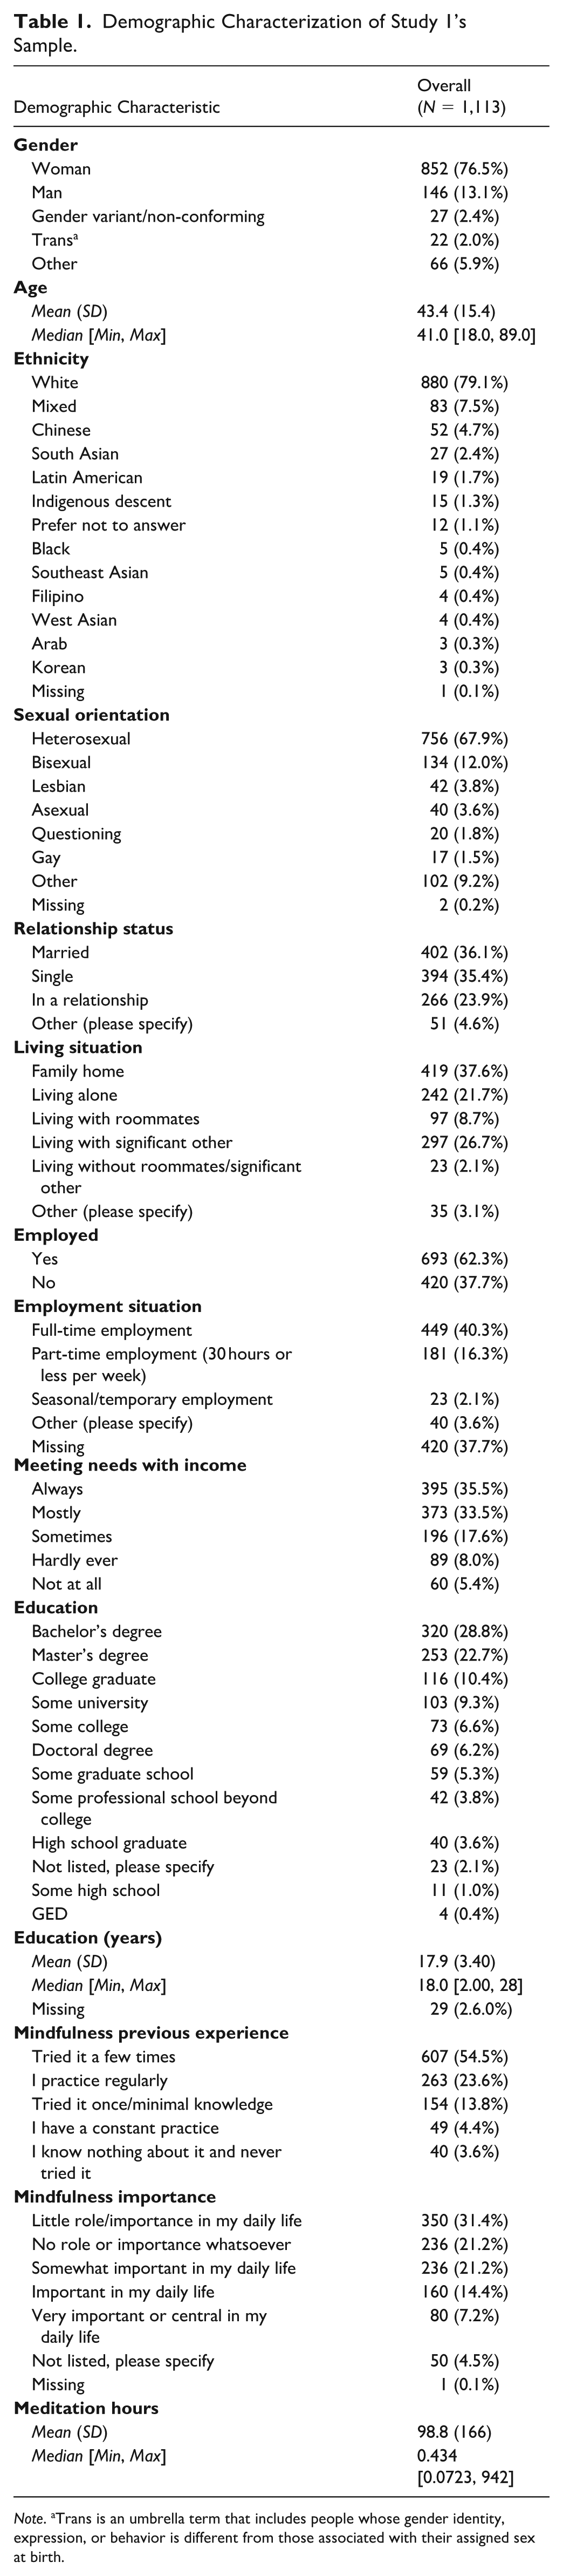
Note. aTrans is an umbrella term that includes people whose gender identity, expression, or behavior is different from those associated with their assigned sex at birth.
Procedure
Study 1 was approved by the Research Ethics Board at the first author’s host university, and all the participants provided informed consent. The study was conducted entirely online using Qualtrics and included sociodemographic questions, and information about meditation practice or mindfulness training and experience, along with the scale under validation (i.e., the SEQ).
Data Analyses
The 64-item SEQ structure was initially evaluated using Exploratory Factor Analysis (EFA). Since we wanted to develop an abbreviated version, and that we were considering two studies, we started applying an EFA to the 64 items for the whole sample. We initially performed Parallel Analysis and Optimal Coordinates methods to determine the number of factors to extract (Hayton et al., 2004; Raîche et al., 2013). Once this number was determined, we evaluated multivariate normality of the items using the Henze–Zirklers’s test. In the case where multivariate normality was not met, we proceeded using Principal Axis Factorization Extraction instead of Maximum Likelihood (Costello & Osborne, 2005; de Winter & Dodou, 2012). Then we pruned iteratively by removing crossloaders (items loading in more than one factor), and subloaders (items loadings < 0.3 in all factors). Before each removal, another EFA analysis would be performed until no subloaders or crossloaders are obtained.
The next step was to reduce the number of SEQ items to around 20 items as recommended by the panel of experts (see the above section for details). This reduction was guided by a procedure that prioritized equivalency and content first, and then evaluated whether loadings and internal consistency were comparable, with the understanding that some reduction in internal consistency (e.g., Cronbach’s alpha) is expected when the number of items is reduced (Rammstedt & Beierlein, 2014; Ziegler et al., 2014). We did not use internal consistency or factor loading criteria to privilege equivalency to avoid the loss of equivalency and other desirable properties of an instrument (Loevinger, 1954; Ziegler et al., 2014). Consistent with this procedure, we sought to preserve content coverage, maintain balance between the two SEQ dimensions, and minimize total number of items. We then estimated the equivalency for each allowed combination of items given the above-mentioned constraints based on explained variance, R squared, and slope of the regressions of the short versions of the subscales with the full scale.
This approach provides indices of shared variance and concordance across groups or forms, consistent with recommendations from equivalence testing and measurement invariance research (Lakens et al., 2018; Putnick & Bornstein, 2016). Specifically, we conducted multiple regressions between the initial pruned SEQ and a 20-item SEQ for all possible item combinations under the given constraints. We then inspected the solutions that had the highest squared R values and slopes closest to 1 (to strengthen equivalency). This inspection included a content analysis to ensure that all relevant aspects of each subscale’s construct were represented. Our goal was to achieve squared R values > 0.9 and slopes within the 0.9 to 1.1 range.
Following this, we proceed with an Exploratory-Confirmatory Factor Analysis (EFA-CFA) approach using a split half cross validation. We first evaluated EFA in the first half of the sample (train set) and then evaluated CFA in the second half of the sample (test set). We also report EFA on the test set to inspect stability of factor loadings. Internal consistency was assessed using Cronbach’s alpha and McDonald’s omega for both halves. The rationale was to evaluate the proposed structure through EFA on the training set, make adjustments, and then test the structure using CFA on the test set. This sequential strategy is consistent with recommended practices when external validation samples are not available and allows both structure development and internal cross validation while minimizing capitalization on chance. We reported the global fits Root Mean Square Error of Approximation (RMSEA), Standardized Root Mean Square Residual (SRMR), Comparative Fit Index (CFI), and Tucker–Lewis Index (TLI) as diagnostics parameters. Finally, we tested the presence of a global latent variable (score) for the 20-item SEQ using a bifactor model. Evaluating the presence of a global latent variable in a model with two correlated subscales is specially complicated as is can be easily empirically underidentified (Podsakoff et al., 2003). To deal with this problem, we forced the global latent variable to be independent of the two subscales. The rationale was to evaluate if the global latent variable was able to contribute with information not captured by each subscale alone.
Once the 20-item version was finalized, we applied the same procedure described above to reduce the number of items to a minimum to facilitate administration, especially among vulnerable populations. Similarly, we ended by testing the presence of a global latent variable (score) for the shortened SEQ. For all analyses and results reporting, multiple R packages were used; dplyr (Wickham, François, et al., 2023) and tidyr (Wickham, Vaughan, et al., 2023) were used for dataset manipulation. In addition, psych (Revelle, 2023) was used for exploratory factor analysis. lavaan (Rosseel, 2012) and semPlot (Epskamp, 2022) were used for CFA. Multivariate normality was evaluated using mvnTest (Pya et al., 2016). Coefficient alpha and omega, along with their confidence intervals, were estimated using coefficientalpha (Zhang & Yuan, 2020), and caTools (Tuszynski, 2021) was used to randomly split the data. Conditional classification and regression trees, as well as conditional random forests, were conducted using party (Hothorn, Bühlmann, et al., 2006; Hothorn, Hornik, et al., 2006; Strobl et al., 2007, 2008; Zeileis et al., 2008), with ggparty (Borkovec & Madin, 2019) used for tree plotting. Correlations were computed using Hmisc (Harrell, 2023). Correlation plots were generated using corrplot (Wei & Simko, 2021) and RColorBrewer (Neuwirth, 2022). Additional figures were created using ggplot2 (Wickham, 2016). Tables were produced using table1 (Rich, 2023).
Results
We started with 64-item SEQ, which was iteratively pruned using the method described above. Once the initial solution was obtained, each iteration was examined, including confidence intervals of item loadings and consistency. Using these results, each item was evaluated for potential interpretation bias. Based on these evaluations, 13 items were dropped, yielding a 51-item solution, 30 items in the Suffering dimension and 21 items in the Overcome dimension. The SEQ showed all item loading confidence intervals outside the −0.30 to +0.30 range. Internal consistencies were between 0.95 and 0.98. The EFA solution presented a TLI of 0.87, an RMSEA of 0.06, an Root Mean Square Residual (RMSR) of 0.04, and Kaiser Meyer Olkin Measure of Sampling Adequac (KMO) of 0.98, which is considered optimal (see details in Supplemental Table S1).
Following this, with the objective of reducing the number of SEQ items to enhance usability across populations, we applied the iterative procedures described above and selected a final 20-item solution, 10 items for the Suffering dimension and 10 for the Overcome dimension. We then assessed the equivalence of the 20- and 10-item SEQ relative to the original 51-item instrument.
Regression analyses indicated that scores on the two SEQ subscales, suffering and overcoming, closely mirrored those of the original version of SEQ. These results support the conclusion that the 10-, 20-, and 51-item versions yield equivalent, and therefore comparable, scores. Nonetheless, SEQ-10 presented lower squared Rs and slopes (Figure 1A–D) compared with SEQ-20 (Figure 1E–H). Equivalency was also stable in the train and test data, presenting similar slopes and squared Rs in train data (Figure 1A, C, E, G) compared with test data (Figure 1B, D, F, and H). Specifically, as shown in Figure 1, all squared R values were above 0.96 for the 20-item SEQ and 0.88 or higher for the SEQ-10. Slopes were close to one (ranging from 0.96 to 1.00) for the 20-item SEQ and between 0.89 and 0.91 for the SEQ-10, with intercepts near zero (ranging from 0.05 to 0.11) for the 20-item SEQ and between 0.24 and 0.35 for the SEQ-10. Results showed only minor changes when assessing test data. Slope standard errors were low when assessed in the test data (TFC: 0.011; CAS: 0.007; AIC: 0.006), indicating that the expected error derived from using the short versions of SEQ is smaller than the first decimal of the scale score. This supports the assumption that 20-item SEQ scores are similar enough to be interpreted as equivalent to those obtained by the original 51-item SEQ, and that using SEQ-10 implies a small compromise in equivalence.
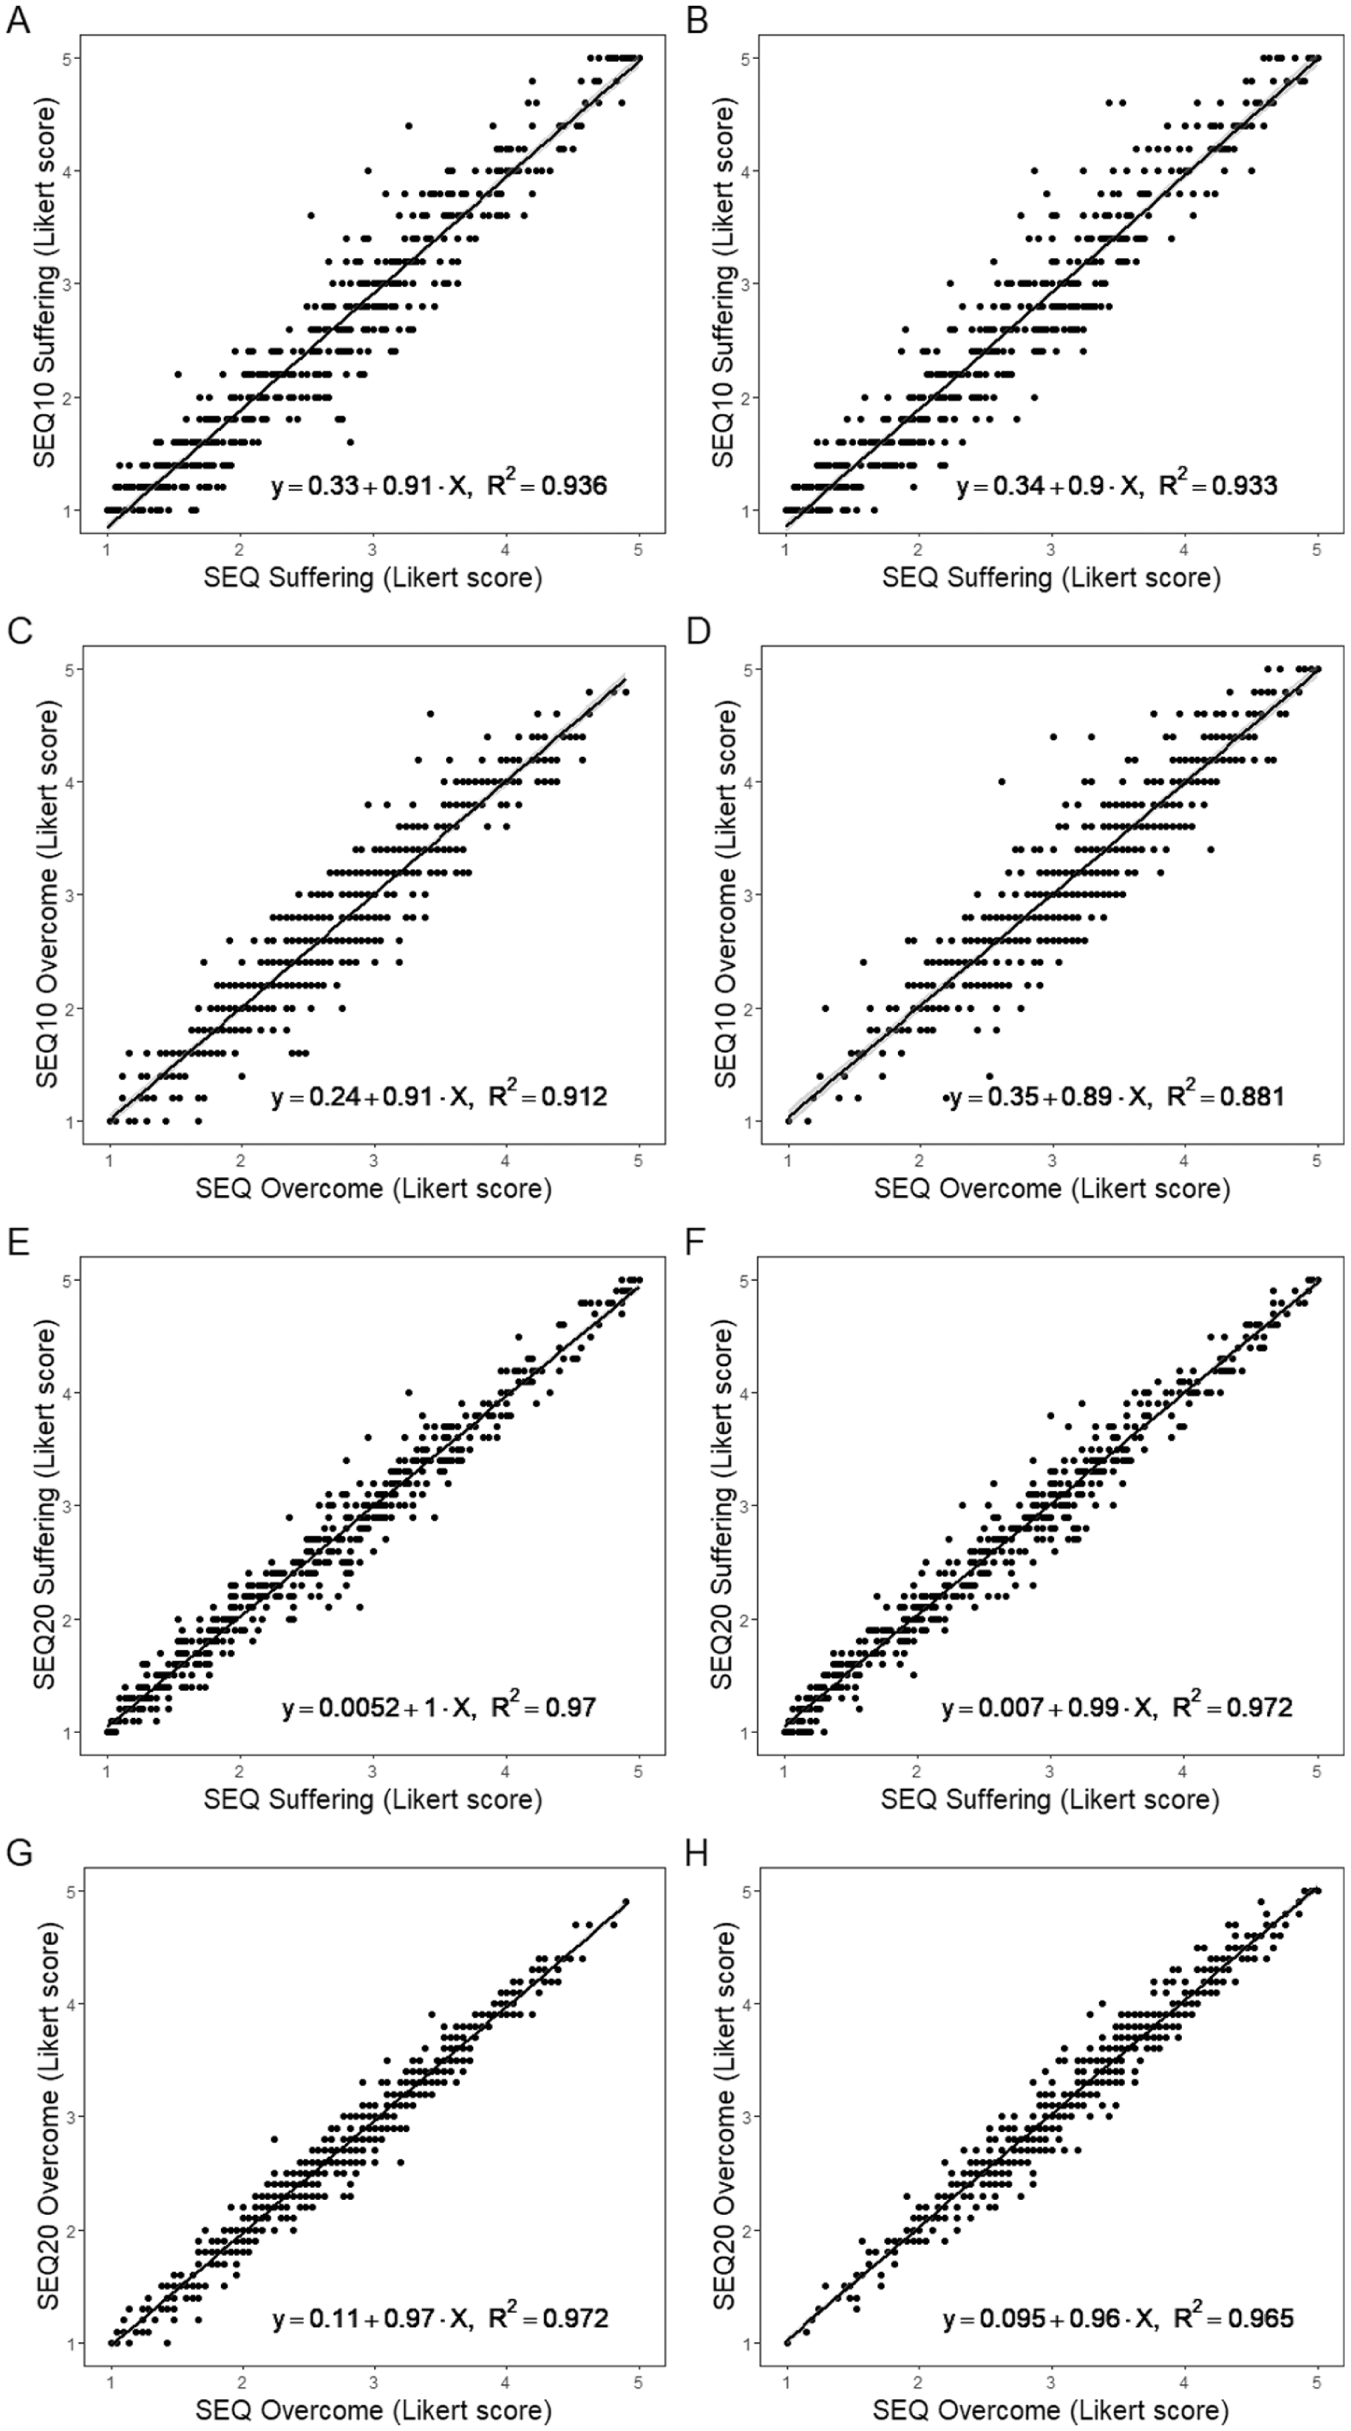
Equivalency Results Perform by Regression Analyses for SEQ and SEQ-10. The Panel Presents the Scatter Plots of SEQ-10 vs. Original 51-Item SEQ for Suffering for Train (A) and Test (B) Data, and Overcome for Train (C) and Test (D) Data. In addition, the Panel Presents the Scatter Plots of 20-Item SEQ vs. Original 51-Item SEQ for Suffering for Train (E) and Test (F) Data, and Overcome for Train (G) and Test (H) Data. Each Scatter Plot Presents the Linear Regression Equation and its Squared Rs.
The solution with 20 items presented a TLI of 0.93, RMSEA of 0.06, RMSR of 0.04, and KMO of 0.96. We then evaluated this same structure in the second half using CFA, and the solution presented a CFI of 0.93, TLI of 0.93, RMSEA of 0.06, and SRMR of 0.04. The bifactor model presented a CFI of 0.96, TLI of 0.93, RMSEA of 0.05, and SMSR of 0.03, being significantly better than the oblique solution (Δχ2 = 219, Δdf = 20, p < 2.2e-16).
SEQ-10 presented a TLI of 0.98, RMSEA of 0.04, RMSR of 0.02, and KMO of 0.92. We then evaluated this same structure in the second half using CFA, and the solution presented a CFI of 0.93, TLI of 0.93, RMSEA of 0.06, and SRMR of 0.03. For the bifactor model we found a CFI of 0.83, TLI of 0.86, RMSEA of 0.10, and SRMR of 0.07, being presenting a significantly worse fit compared to the oblique solution (Δχ2 = 1,024, Δdf = 125, p < 2.2e-16).
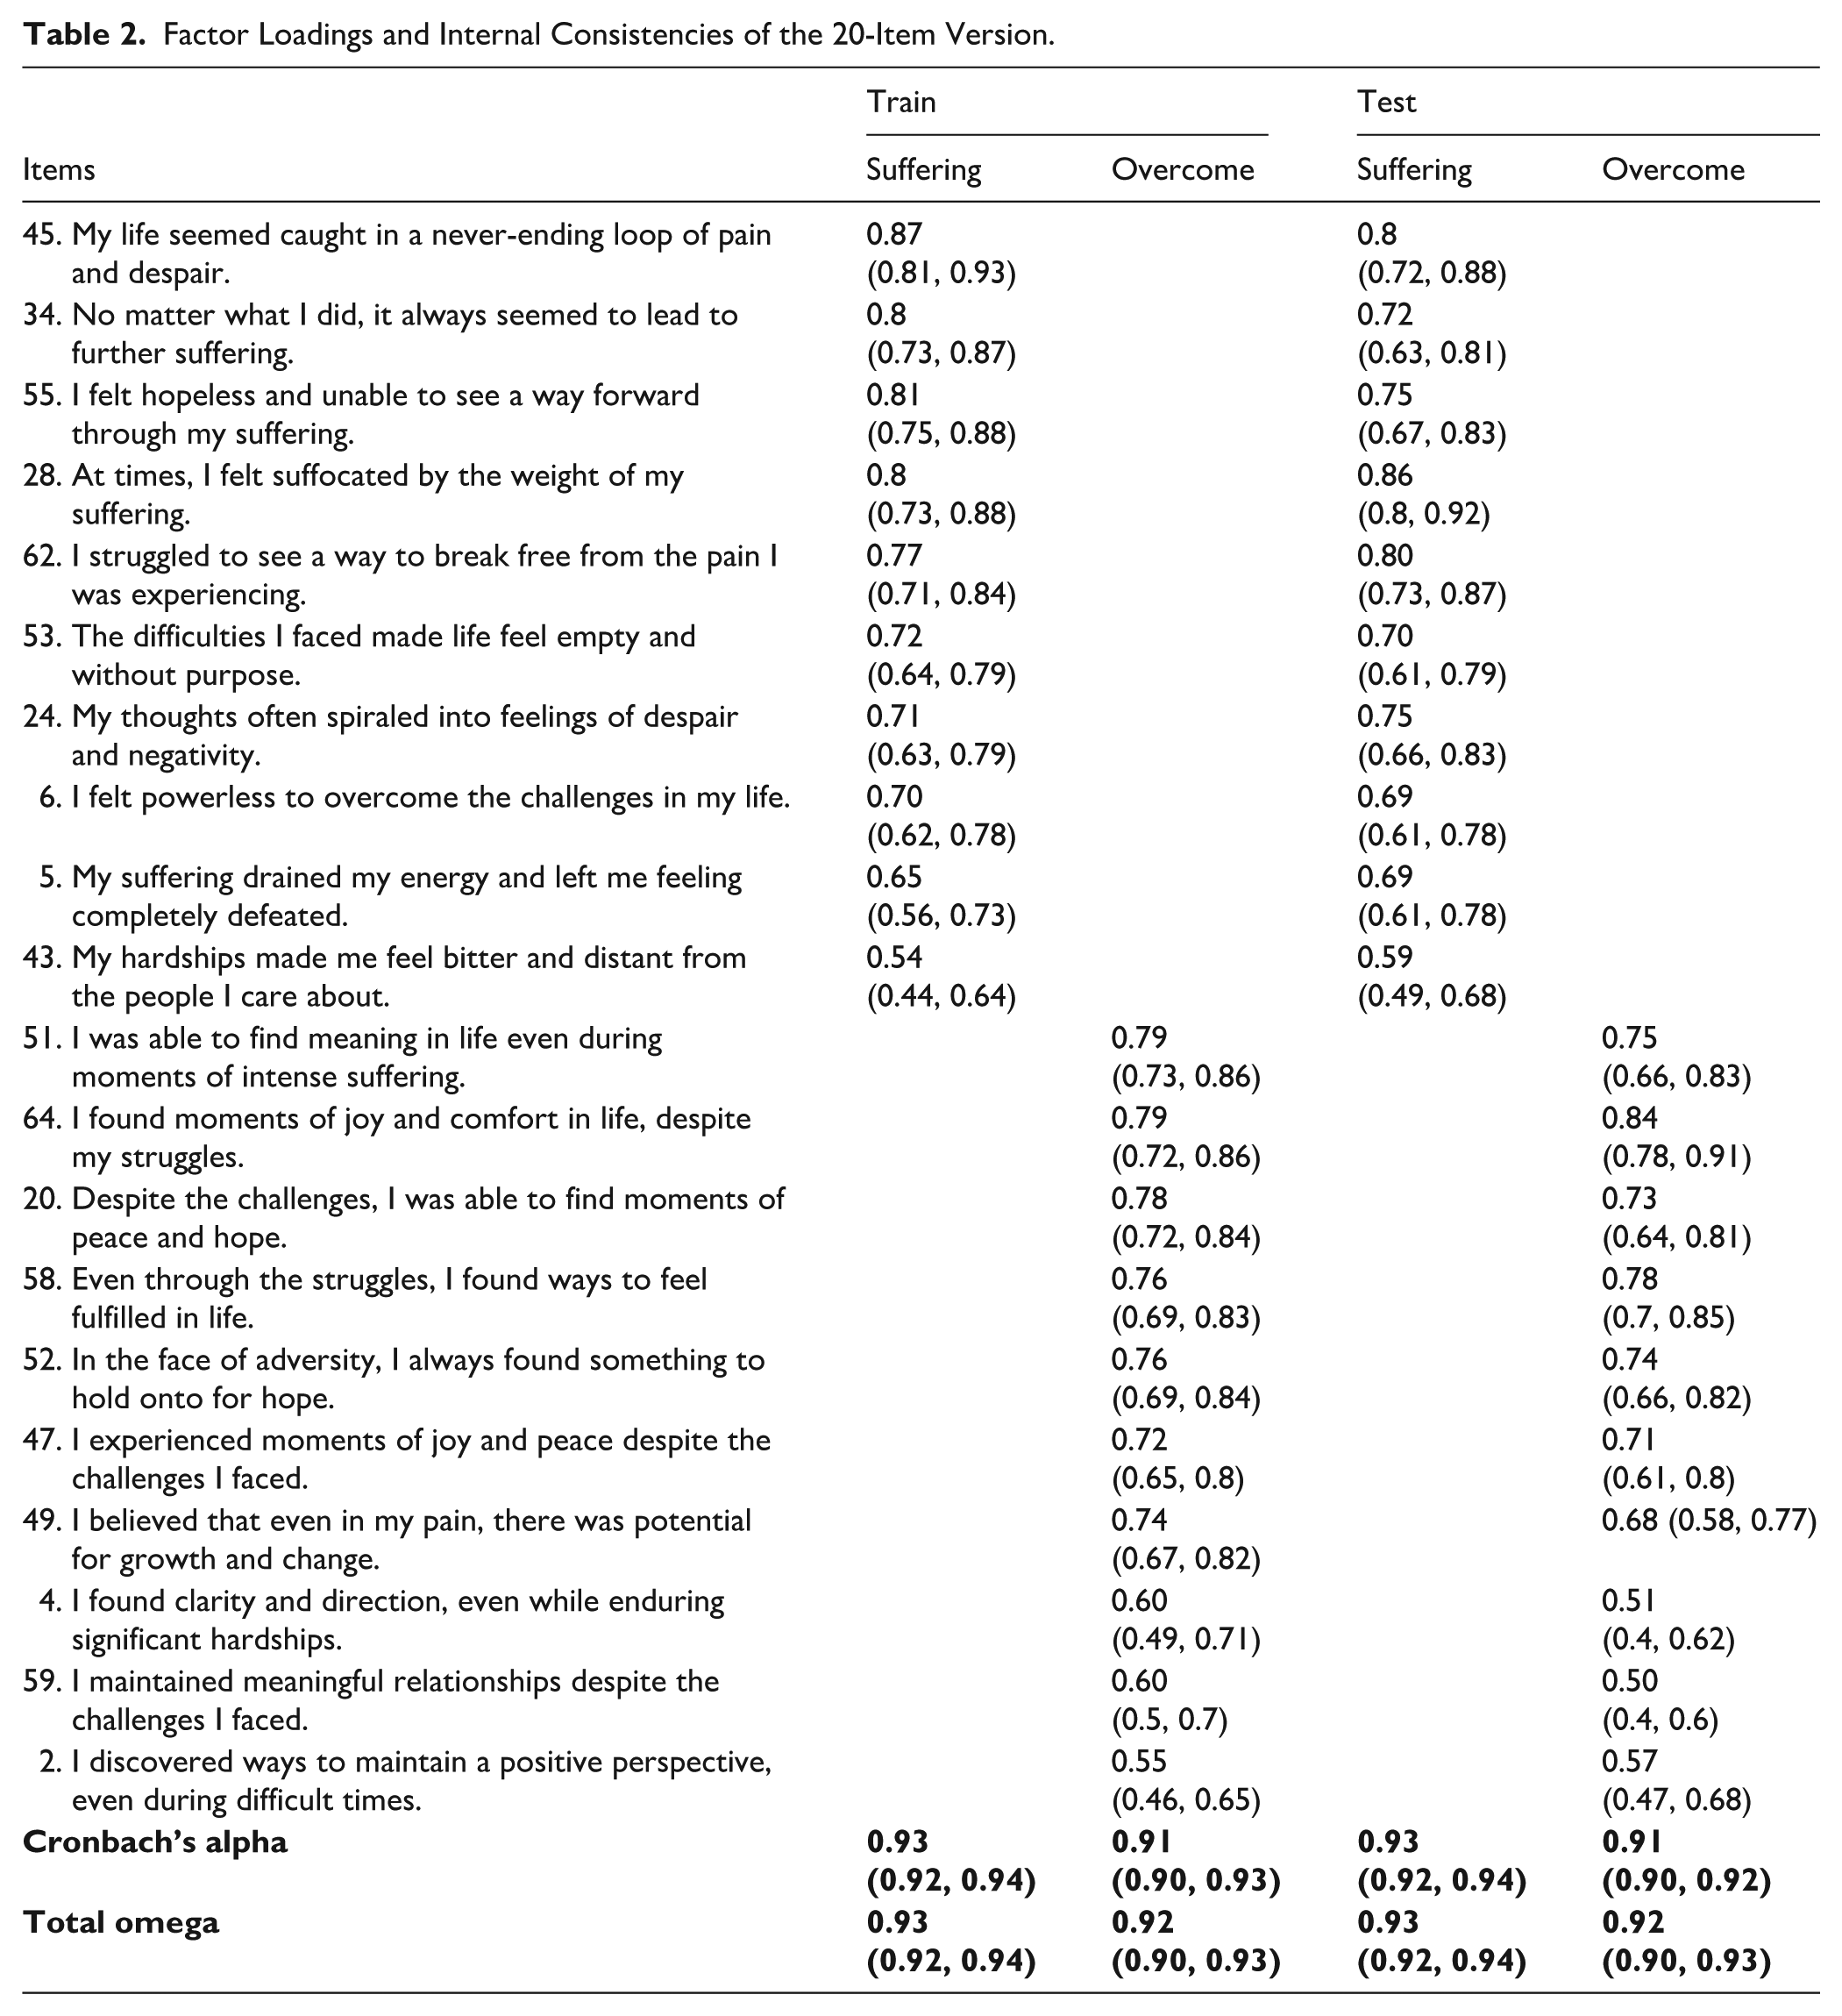
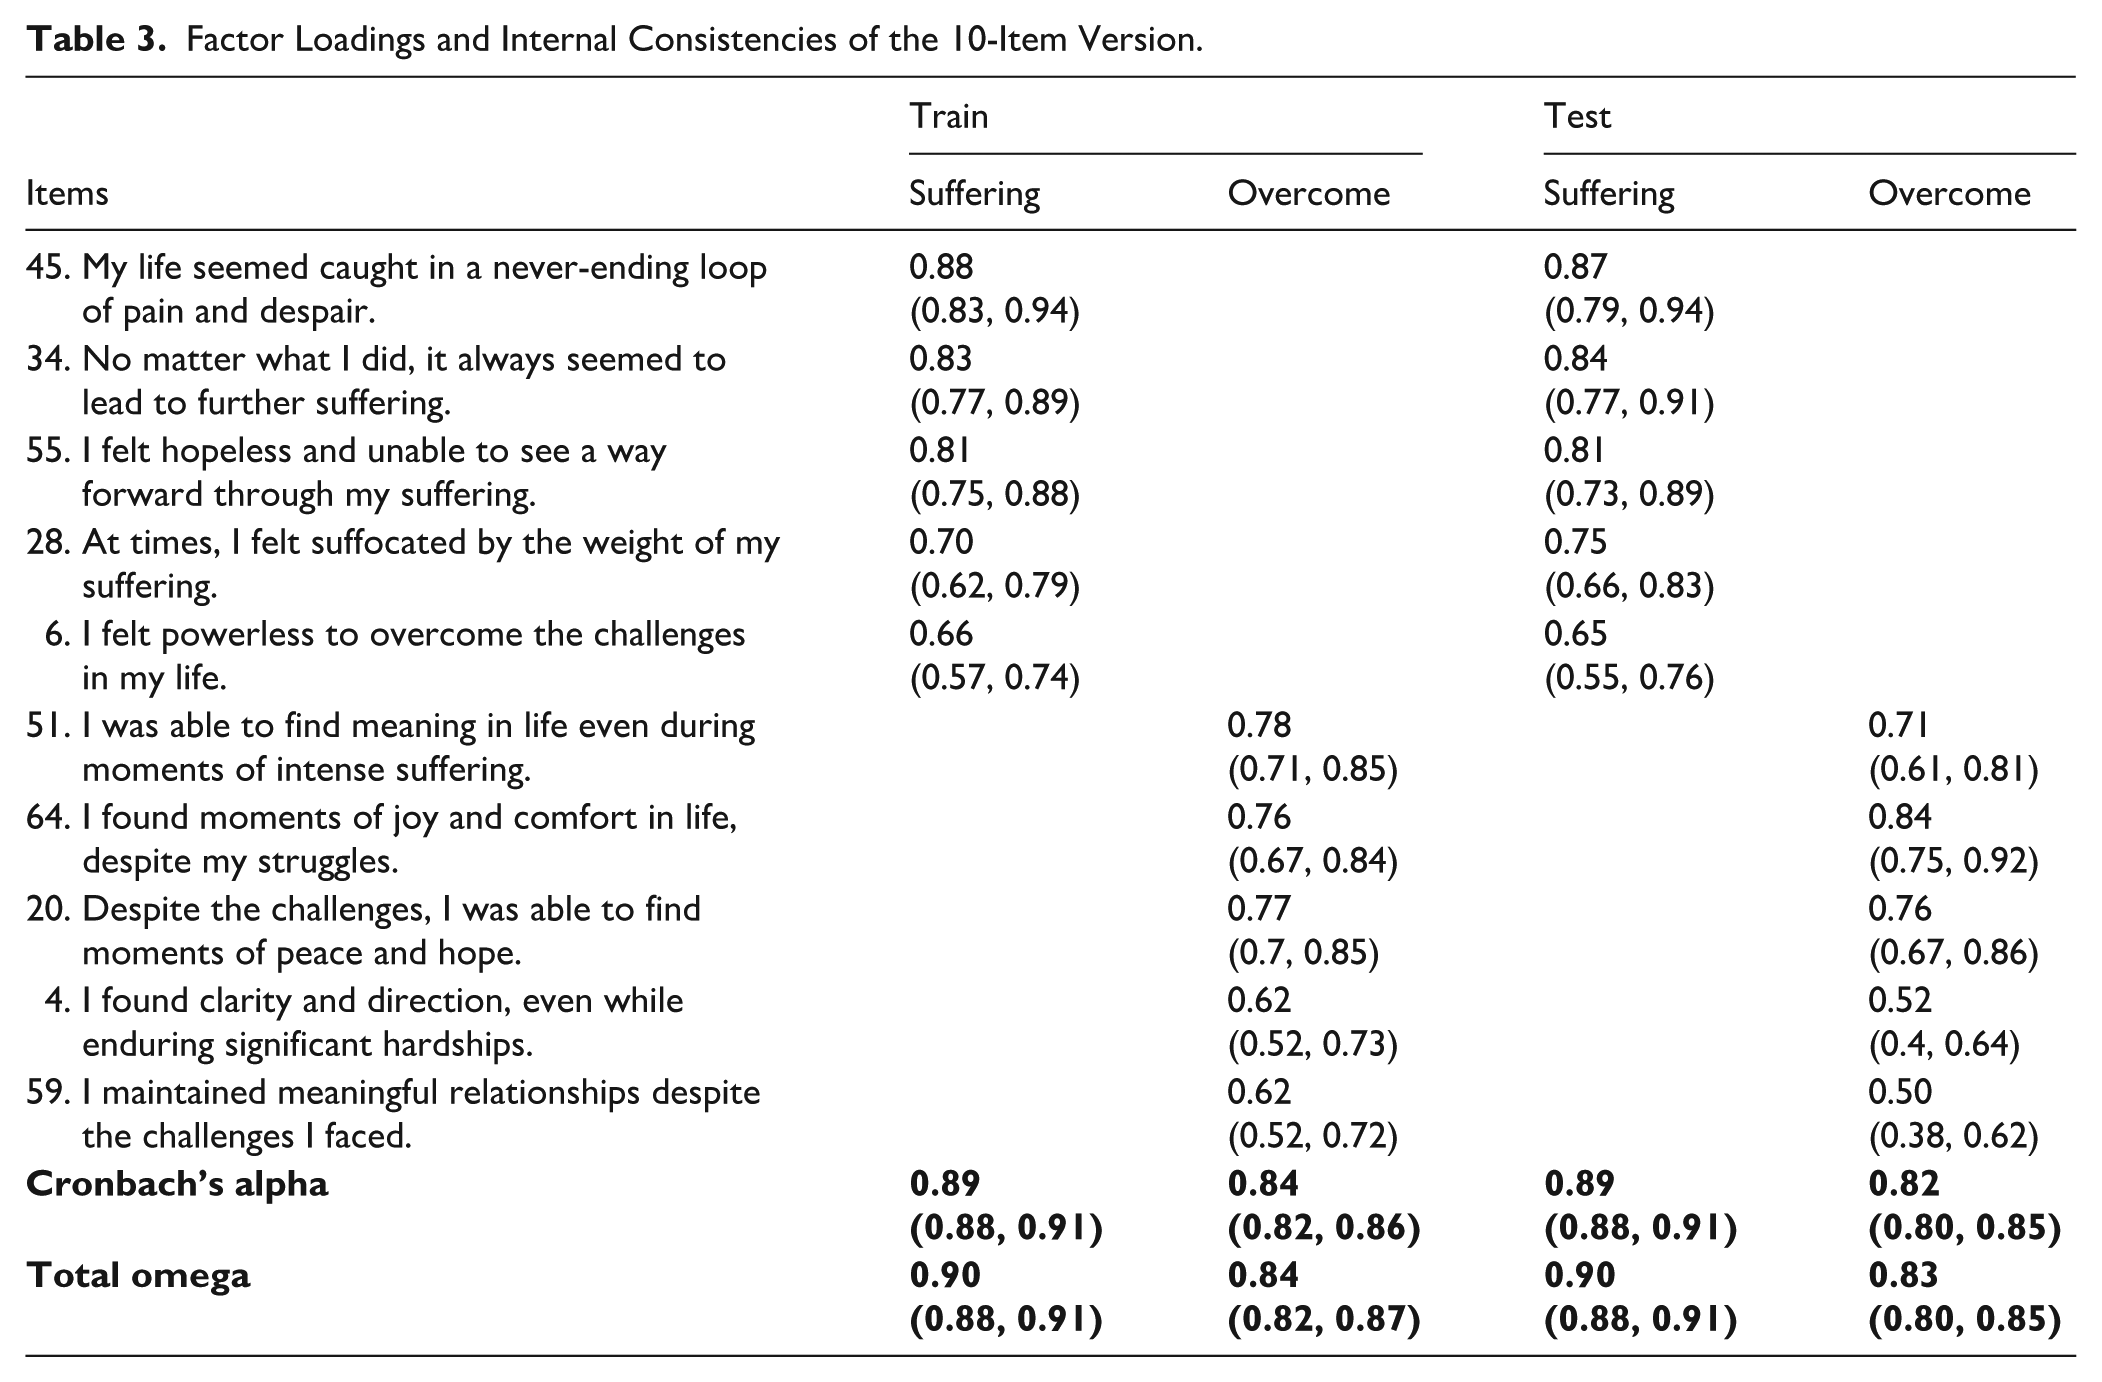
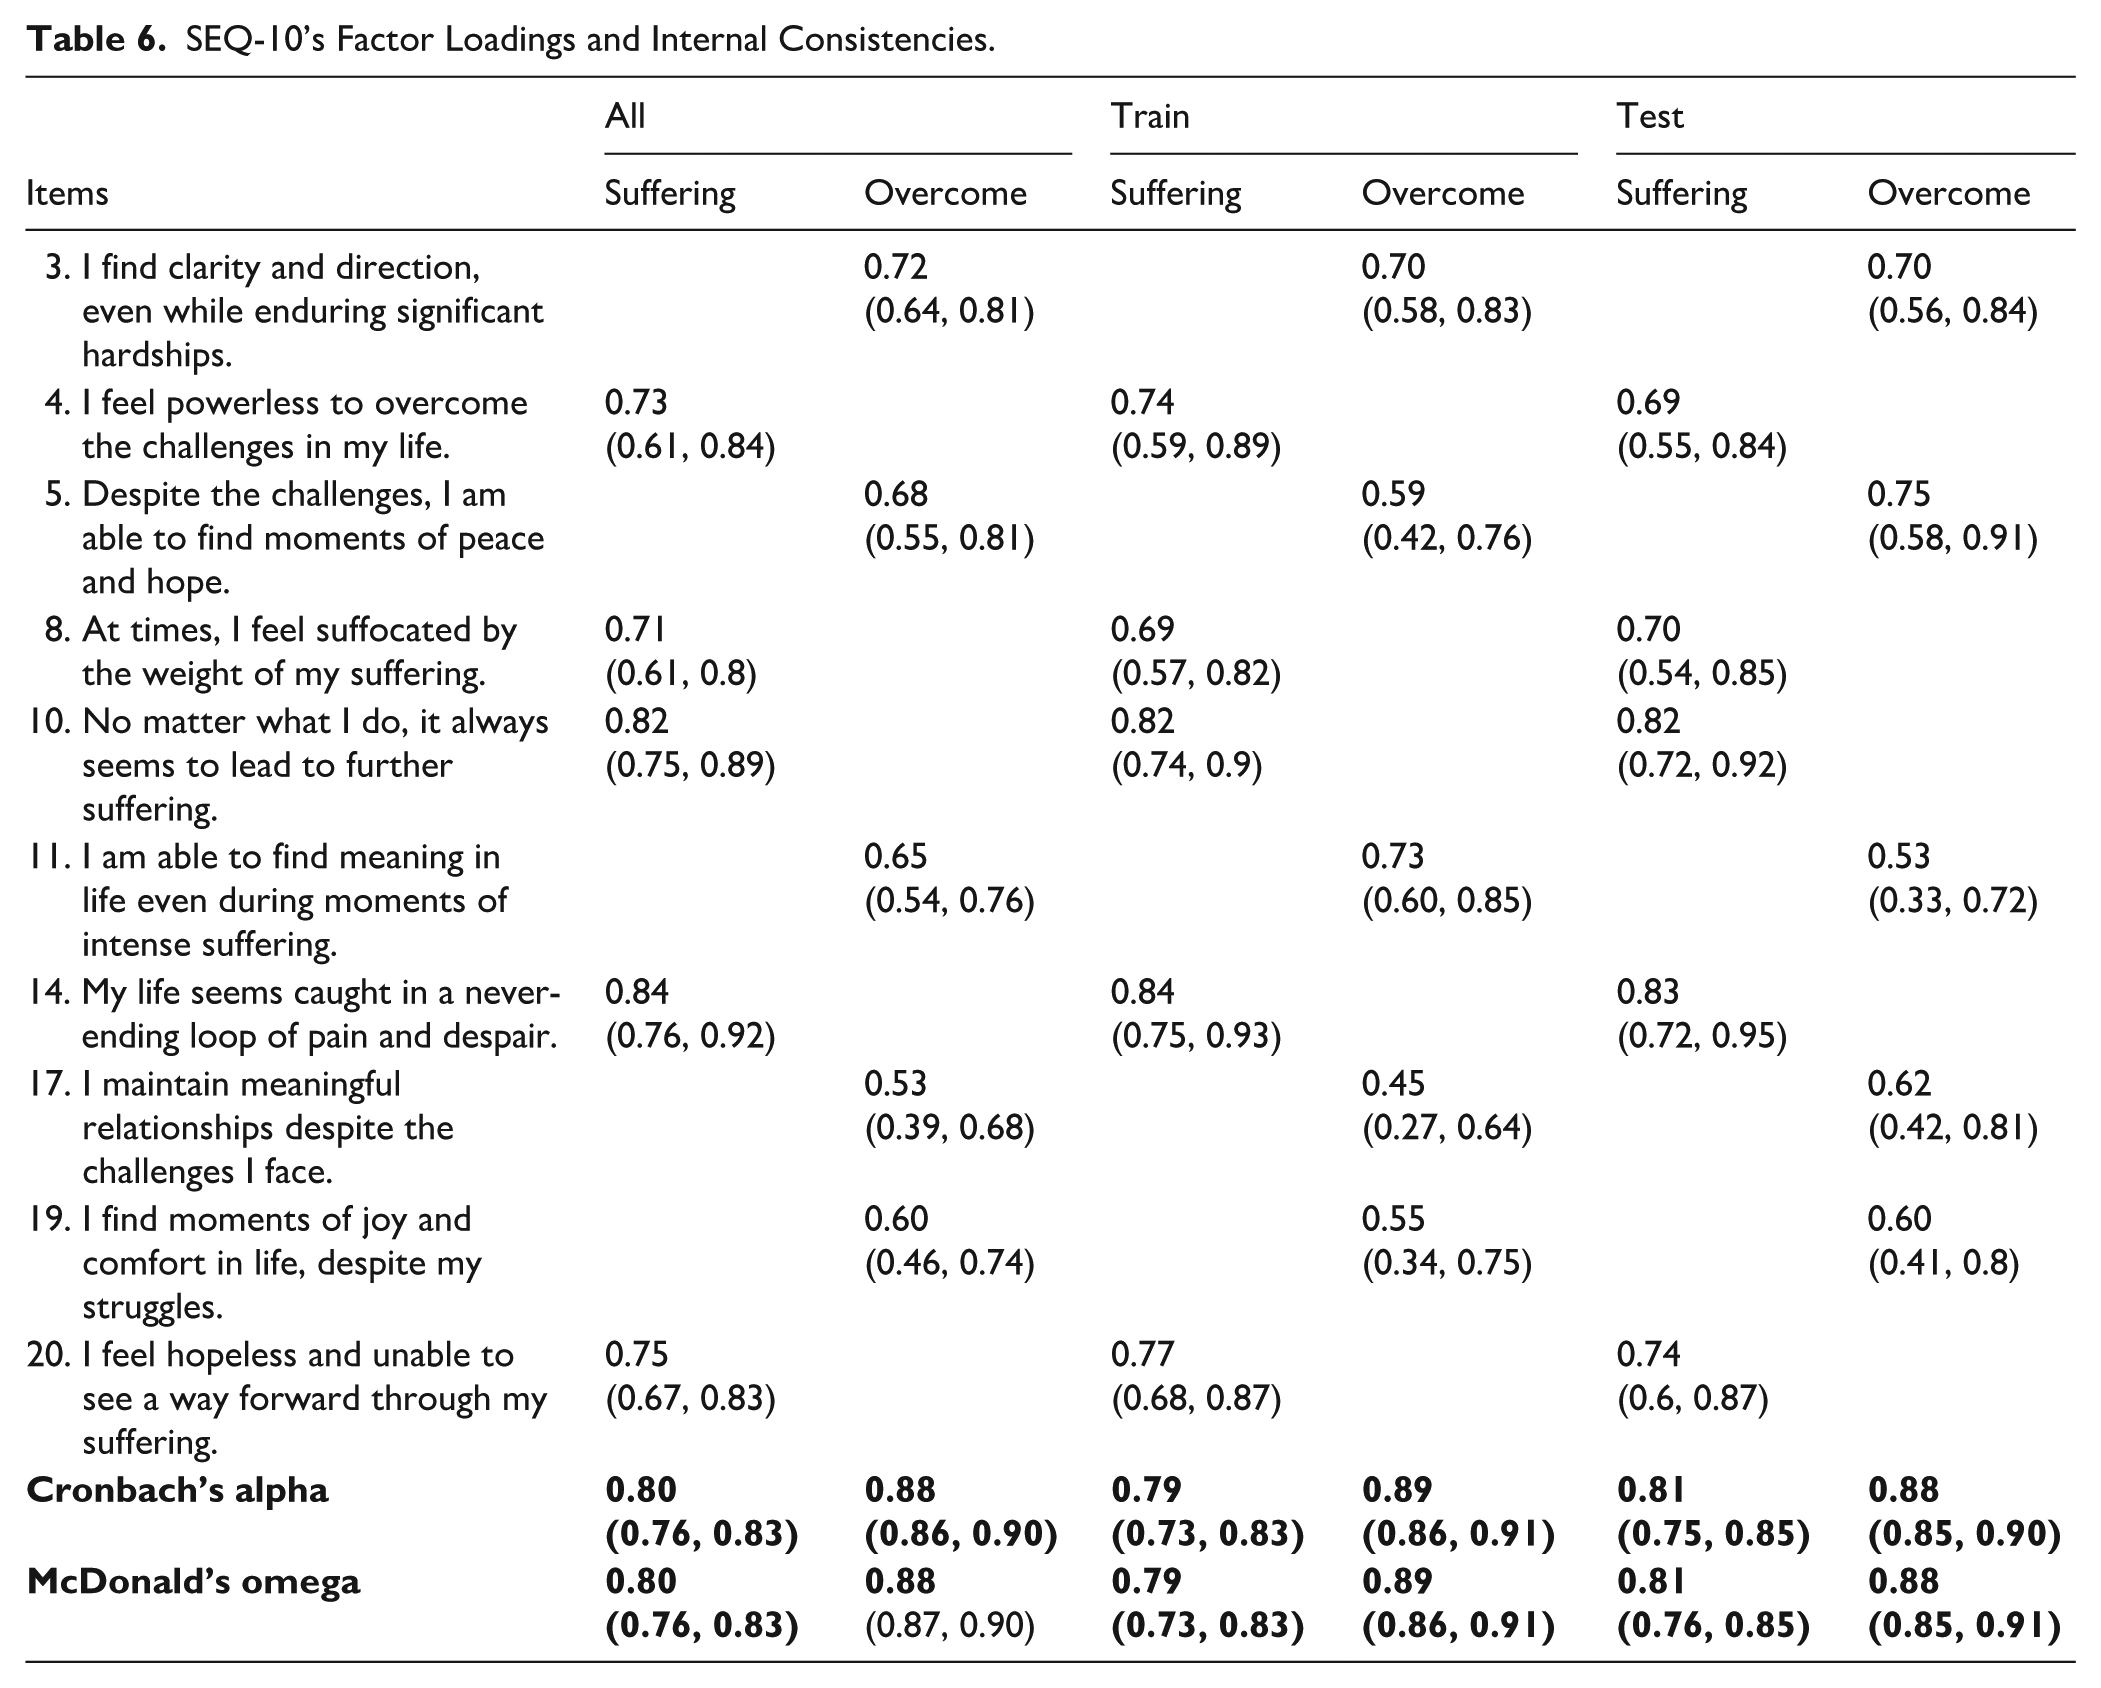
Diagnostics were stable in both halves using EFA and CFA, presenting optimal fit. As such, SEQ presented evidence in favor of its structure. Internal consistencies presented a range from 0.91 to 0.94. The Suffering and Overcoming subscales showed comparable internal consistency. Factor loadings and internal consistencies for the 20-item and 10-item versions are presented respectively in Tables 2 and 3. Preliminary evidence from this study supports the presence of a global score for the 20-item version but not the 10-item version.
Factor Loadings and Internal Consistencies of the 20-Item Version.
Factor Loadings and Internal Consistencies of the 10-Item Version.
Discussion
The objectives of the present study were to develop, test, and synthesize the initial structure of the SEQ, and to produce shortened forms. Exploratory and confirmatory factor analyses supported the proposed two-dimensional solution, suffering and overcoming. Guided by expert recommendations on practical utility, we reduced the item pool while preserving content coverage and balance across dimensions, yielding a final 20-item version with 10 items per subscale.
To further facilitate administration and clinical applicability, we developed a 10-item short form, SEQ-10, with five items per subscale. Despite the substantial reduction, both the 20- and 10-item versions showed strong alignment with the original instrument. This was indicated by high explained variance and slope alignment in regression based equivalence checks, comparable factor loadings, and satisfactory internal consistency. Moreover, both SEQ and SEQ-10 showed evidence of a global latent factor underlying the two dimensions, thereby preserving the conceptual strengths of the original instrument. However, using SEQ-10 does present compromises in equivalency, and global score seems not to be reliable in SEQ-10. As such, a loss in equivalency and factor structure integrity was detected for the shortest version.
In summary, this study resulted in the development and initial validation of two versions of the Suffering Experiences Questionnaire, the SEQ with 20 items and SEQ-10 with 10 items. Both versions balance item count across the two dimensions and show high internal consistency with promising utility. In Study 2, both versions underwent the same evaluation, and additional instruments were included to assess convergent and discriminant validity. For interpretability and balance, items were ordered to alternate between the two dimensions, that is, an item representing the suffering subscale is followed by an item representing the overcoming subscale.
Study 2: SEQ and SEQ-10 Structure, Internal Consistency, and Convergent/Concurrent Assessment
Method
Participants
With the aim of increasing external validity for the current study, and to achieve the most conservative sample size, we aimed for a sample size of > 200 (MacCallum et al., 1999). It is fairly accepted that there are not good recommendations for sample size for factor analysis; however, it is accepted that using item-observation ratios above 1:5 is a conservative and safe approach (Costello & Osborne, 2005; MacCallum et al., 1999; Reio & Shuck, 2015). Using the same recruitment methods as in Study 1 and targeting a more diverse sample, we recruited 458 Canadian adults. Only respondents who passed the platform’s data quality screening by Qualtrics and all attention check questions were retained for the final sample, ensuring high quality of responses.
The final sample comprised 63.1% women, 25.1% men, and 11.8% reported another gender, for example trans or variant or non-conforming, or preferred not to answer. Most participants were White (60.9%), or mixed (7.2%), with approximately 31.9% from a minority group, indicating greater diversity than in Study 1. Most identified as heterosexual (62.9%), whereas 37.1% identified as LGBTQ+ or other. Participants were nearly evenly divided between being single (47.6%) and being married or in a relationship (49.4%). In terms of household composition, 25.1% lived alone, and the majority lived with others. The mean age was 37.8 ±15.8 years (range from 18 to 86), the mean years of education was 17.0 ±3.48 years (range from 2 to 31), and the total meditation practice hours were 130.0 ±555 hours (range from 0 to 5470). Most participants (62.7%) reported meeting their financial needs, whereas more than one third, (37.3%), reported falling short at least some of the time. More details are presented in Table 4.
Demographic Characterization of Study 2’s Sample.
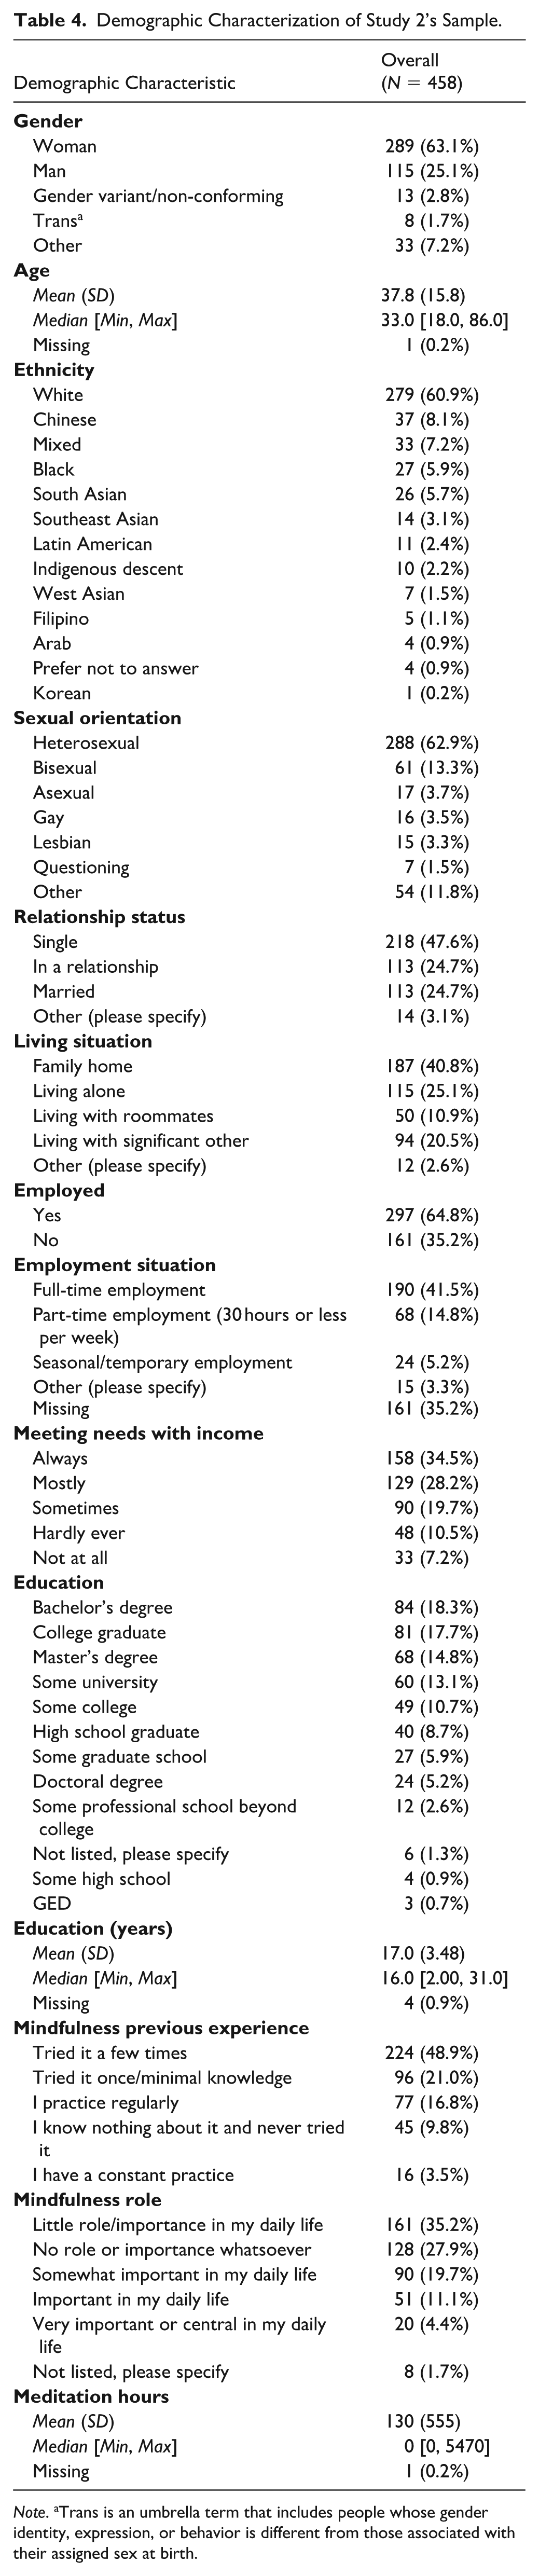
Note. aTrans is an umbrella term that includes people whose gender identity, expression, or behavior is different from those associated with their assigned sex at birth.
Procedure
Study 2 followed a procedure similar to Study 1. It included sociodemographic data, information regarding meditation practice or mindfulness training and experience, along with the measures under validation and additional instruments to assess external validity. The order of questionnaires was randomized, with the 20-item SEQ administered first, followed by measures of suffering, resilience, symptoms, contemplative practices, and well-being. A complete list of instruments is provided in the next section. Due to the large number of questionnaires, we did not administer the SEQ-10 independently in this study. However, we analyzed the items corresponding to the SEQ-10 as part of the 20-item SEQ.
Measures
Along with the sociodemographic questionnaire and the 20-item SEQ, 25 other instruments were administered. Scale selection was guided by theoretical relevance, strong psychometrics, and prior use in validating suffering or psychological/physiological symptom measures.
First, for evidence of convergent validity, we used other measures of suffering and resilience including the Personal Suffering Assessment (PSA, 7 items; VanderWeele, 2019), the symptom-based Suffering Scales (SS, 42 items; Schulz et al., 2010), and the Brief Resilience Scale (BRS, 6 items; Smith et al., 2008). Second, consistent with the biopsychosocial model in Western psychology, we administered multiple symptom-based measures, including the Perceived Stress Scale (PSS, 10 items; Cohen et al., 1983), Depression Anxiety Stress Scales (DASS, 21 items; Lovibond & Lovibond, 1995), Positive and Negative Affect Scale (PANAS-GEN, 20 items; Watson et al., 1988), Distress Questionnaire-5 (DQ-5, 5 items; Batterham et al., 2016), Distress Tolerance Scale (DTS, 15 items; Simons & Gaher, 2005), Cardiff Self-Injury Inventory (CSII, 8 items; Snowden et al., 2023), Suicidal Behaviors Questionnaire-Revised (SBQ-R, 4 items; Osman et al., 2001), UCLA Loneliness Scale (LS, 20 items; Russell, 1996), and Difficulties in Emotion Regulation Scale (DERS, 36 items; Gratz & Roemer, 2004).
In line with the Buddhist conceptualization of suffering and its transcendence, and consistent with the Embodied and Embedded Mindfulness and Compassion Framework (EEMCF), we administered measures of mindfulness, compassion, and related Buddhist constructs, including the Embodied Mindfulness Questionnaire (EMQ, 24 items; Khoury et al., 2023), Interpersonal Mindfulness Questionnaire (IMQ, 19 items; Khoury et al., 2022), Self-Compassion Scale (SCS, 26 items; Neff, 2003), Compassion Questionnaire for Self-Revised (CQS-R, 39 items; Khoury & Vergara, 2025a), Compassion Questionnaire for Others-Revised (CQO-R, 33 items; Khoury & Vergara, 2025a), Compassion Questionnaire for Animals (CQA, 28 items; Khoury & Vergara, 2024a), Five Facet Mindfulness Questionnaire-15 (FFMQ-15, 15 items; Gu et al., 2016), Non-Attachment Scale-Short Form (NAS-SF, 8 items; Chio et al., 2018), and Questionnaire on Self-Transcendence (QUEST, 21 items; Fishbein et al., 2022). Some constructs, such as mindfulness and self-compassion, were assessed with more than one instrument because of differences in conceptualization and operationalization across measures. For example, whereas the Five Facet Mindfulness Questionnaire (FFMQ) assesses dispositional mindfulness, the EMQ assesses skills and abilities involved in cultivating mindfulness. Comparable distinctions apply to compassion measures.
Participants also completed a self-directed Breath Counting Task (BCT; Levinson et al., 2014). The BCT is a behavioral measure of mindfulness that assesses sustained attention to the present moment and awareness of mind wandering. In this task, participants are instructed to count their breaths in cycles of nine (from one to nine repeatedly). Unlike self-report scales, the BCT provides an objective, performance-based measure of mindfulness that is minimally influenced by self-perception biases. Research has shown that performance on the task correlates with established self-report mindfulness questionnaires, converges with related constructs such as working memory, and discriminates between experienced meditators and non-meditators (Levinson et al., 2014).
Other constructs relevant to overcoming suffering, which conceptualize suffering as arising from disconnection from others and the environment, include connectedness with others and with the natural environment. Accordingly, we administered the Social Connectedness Scale (SCoS, 8 items; Lee & Robbins, 1995) and the Nature Relatedness Scale–Short Form (NRS-6, 6 items; Nisbet & Zelenski, 2013), Finally, in opposition to suffering, we administered questionnaires that portray well-being, including the Satisfaction With Life Scale (SWLS, 5 items; Diener et al., 1985) and Oxford Happiness Questionnaire (OHQ, 29 items; Hills & Argyle, 2002). Basic descriptive statistics were calculated, and internal consistencies were estimated using Cronbach’s alpha and McDonald’s omega for all scales and subscales included for convergent, discriminant, and exploratory evidence. We also computed psychometric properties for shortened versions of the scales and subscales, when available, including the CQA-18 (Khoury & Vergara, 2025b) and the CQS-20/CQO-20 (Khoury & Vergara, submitted). Overall, alpha and omega coefficients were good to excellent across all questionnaires, including those administered at the end of the survey, i.e., SWLS and OPHQ. See Supplementary Table S2 for details. In addition, as shown in Supplemental Table S2, the number of missing data points was very small, mainly due to the strict criteria we adopted for including participant data (see above). Therefore, no missing data analyses were required.
Data Analyses
Construct evaluation followed the same procedure as in Study 1, that is, split half cross validation, for both the SEQ and SEQ-10, following an EFA and CFA approach including internal consistency analyses.
Following these analyses, we aimed to assess the convergent and concurrent validity of the SEQ and SEQ-10 according to the proposed construct. Convergent validity was assessed using Pearson correlations of both SEQ and SEQ-10 subscales with the instruments mentioned above. All the correlations were corrected for multiple comparisons using Bonferroni’s correction.
To evaluate the concurrent validity of the SEQ and SEQ-10, we used a machine learning framework to estimate their incremental predictive value relative to other instruments in the study, for example measures of suffering, resilience, and contemplative practice, and to relevant sociodemographic characteristics, for example age, gender, visible minority status, sexual orientation, financial needs, education, and living situation, that may be associated with suffering. Specifically, we used Random Forests (Strobl et al., 2007), an ensemble extension of CART, which fit many decision trees randomly selecting a subset of predictors to build the trees. This procedure yields out-of-bag estimates of prediction error and variable importance indices that quantify the contribution of each predictor, for example the increase in prediction error or decrease in node purity when that predictor is permuted or omitted. To increase external validity of the variable importance estimation, we performed 1,000 naïve bootstrap iterations using different randomness seeds, to then present the 1,000 variable importance per predictor using boxplots. This analysis allowed us to evaluate the relative concurrent value of SEQ compared to other instruments and sociodemographic variables. For interpretability, predictors are reported in order of their median variable importance for each outcome, for example stress. We employed the recommended defaults of the party framework for trees and forests (Hothorn, Bühlmann, et al., 2006; Strobl et al., 2007, 2008; Zeileis et al., 2008). As predictors, we included all the instruments and subscales except symptom-based suffering scales to avoid criterion contamination, since those scales mirror and assess the very symptom constructs we aimed to predict. Primary outcomes were widely used clinical symptom measures, namely stress, anxiety, and depression, as well as well-being indicators, such as happiness and life satisfaction. Secondary outcomes were non-suicidal self-injury and suicidal behaviors.
To further explore the convergent and discriminant value of SEQ, we used conditional regression trees with the same dependent variables and only SEQ as independent variables. This allowed us to investigate potential interactions between SEQ subscales to produce specific scores in symptoms and well-being related instruments. Conditional regression trees were applied with default parametrization (Hothorn, Bühlmann, et al., 2006; Strobl et al., 2007, 2008; Zeileis et al., 2008). Finally, we computed readability indices for the SEQ, the SEQ-10, and the PSA, for comparison, using the Flesch Reading Ease score, which indicates how easy a text is to read, with higher scores reflecting greater ease of reading. We also used the Flesch–Kincaid Grade Level, which estimates the U.S. school grade level required to understand a text.
Results
Construct and Reliability Evaluation
We started with SEQ EFA in the first half of Study 2 sample, no item was removed, and the solution presented a TLI of 0.88, RMSEA of 0.08, RMSR of 0.05, and KMO of 0.94. We then evaluated this same structure in the second half using CFA, and the solution presented a CFI of 0.93, TLI of 0.92, RMSEA of 0.07, and SRMR of 0.04 for the oblique solution. For bifactor solution we found CFI of 0.96, TLI of 0.95, RMSEA of 0.05, and SRMR of 0.03, and presented a significantly better fit when compared with the oblique solution (Δχ2 = 164, df = 20, p < 2.2e-16). Diagnostics were stable in both halves using EFA and CFA, presenting optimal fit. As such, SEQ presented evidence in favor of its structure, supporting the presence of a global score (see Figure 2).
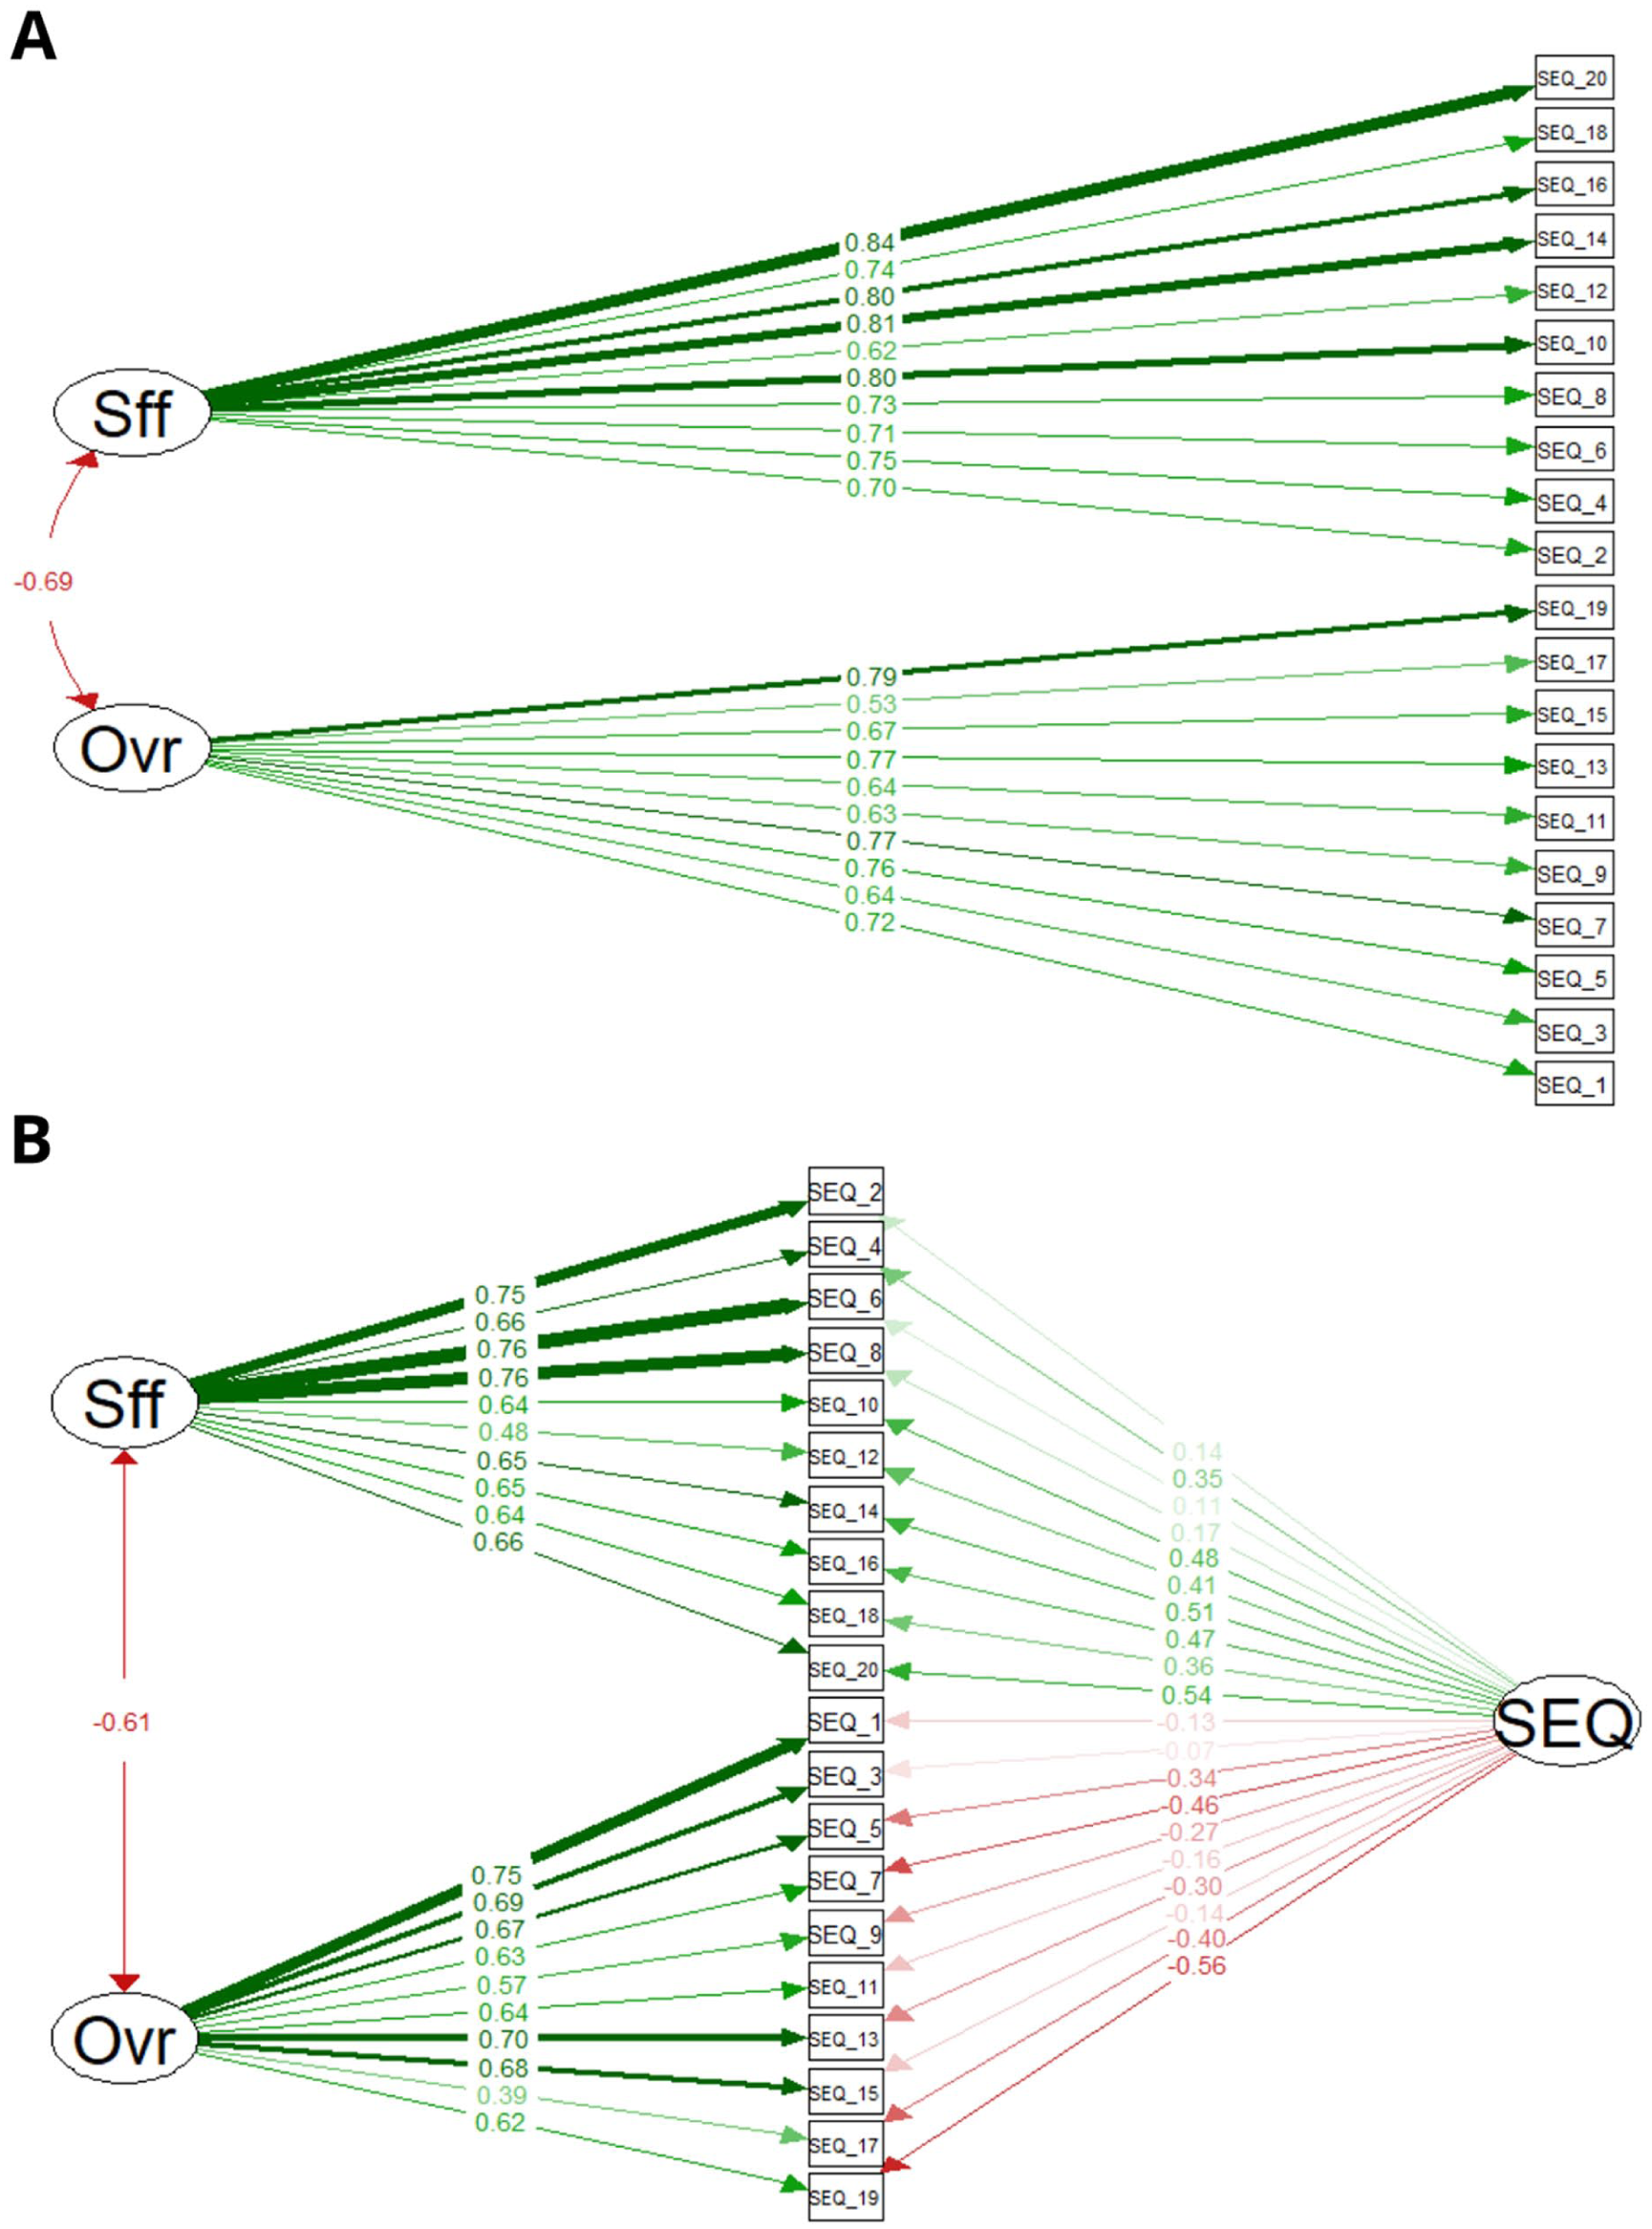
Confirmatory Factor Analysis Results for Study 2 Test Dataset (A) Oblique and (B) Bifactor Solutions. Thickness and Darkness of Arrows Depict the Value Standardized to All Coefficients.
We used the same procedure with SEQ-10. Similarly, in the first half, the EFA procedure did not require any item removal. The solution presented a TLI of 0.92, RMSEA of 0.09, RMSR of 0.04, and KMO of 0.88. For the second half using CFA, we found a CFI of 0.99, TLI of 0.99, RMSEA of 0.03, and SRMR of 0.03. The bifactor model presented a CFI of 1.00, TLI of 1.00, RMSEA of 0.02, and SRMR of 0.00, being significantly better than the oblique solution (Δχ2 = 21, Δdf = 10, p = .02). Nonetheless, it is relevant to note that the bifactor model presented an almost perfect fit, indicating potential artifactual results that may be driven by the problematic structure of having a global latent variable within an instrument composed of two associated subscales (see Study 1 Methods for details). It is also noteworthy that the two subscales, Suffering and Overcoming, are highly correlated in both the SEQ and SEQ-10 (r = .69 and r = .66, respectively; see Figure 3A), which, together with the lower number of items in the SEQ-10, may be driving the potentially artifactual results observed in the SEQ-10.
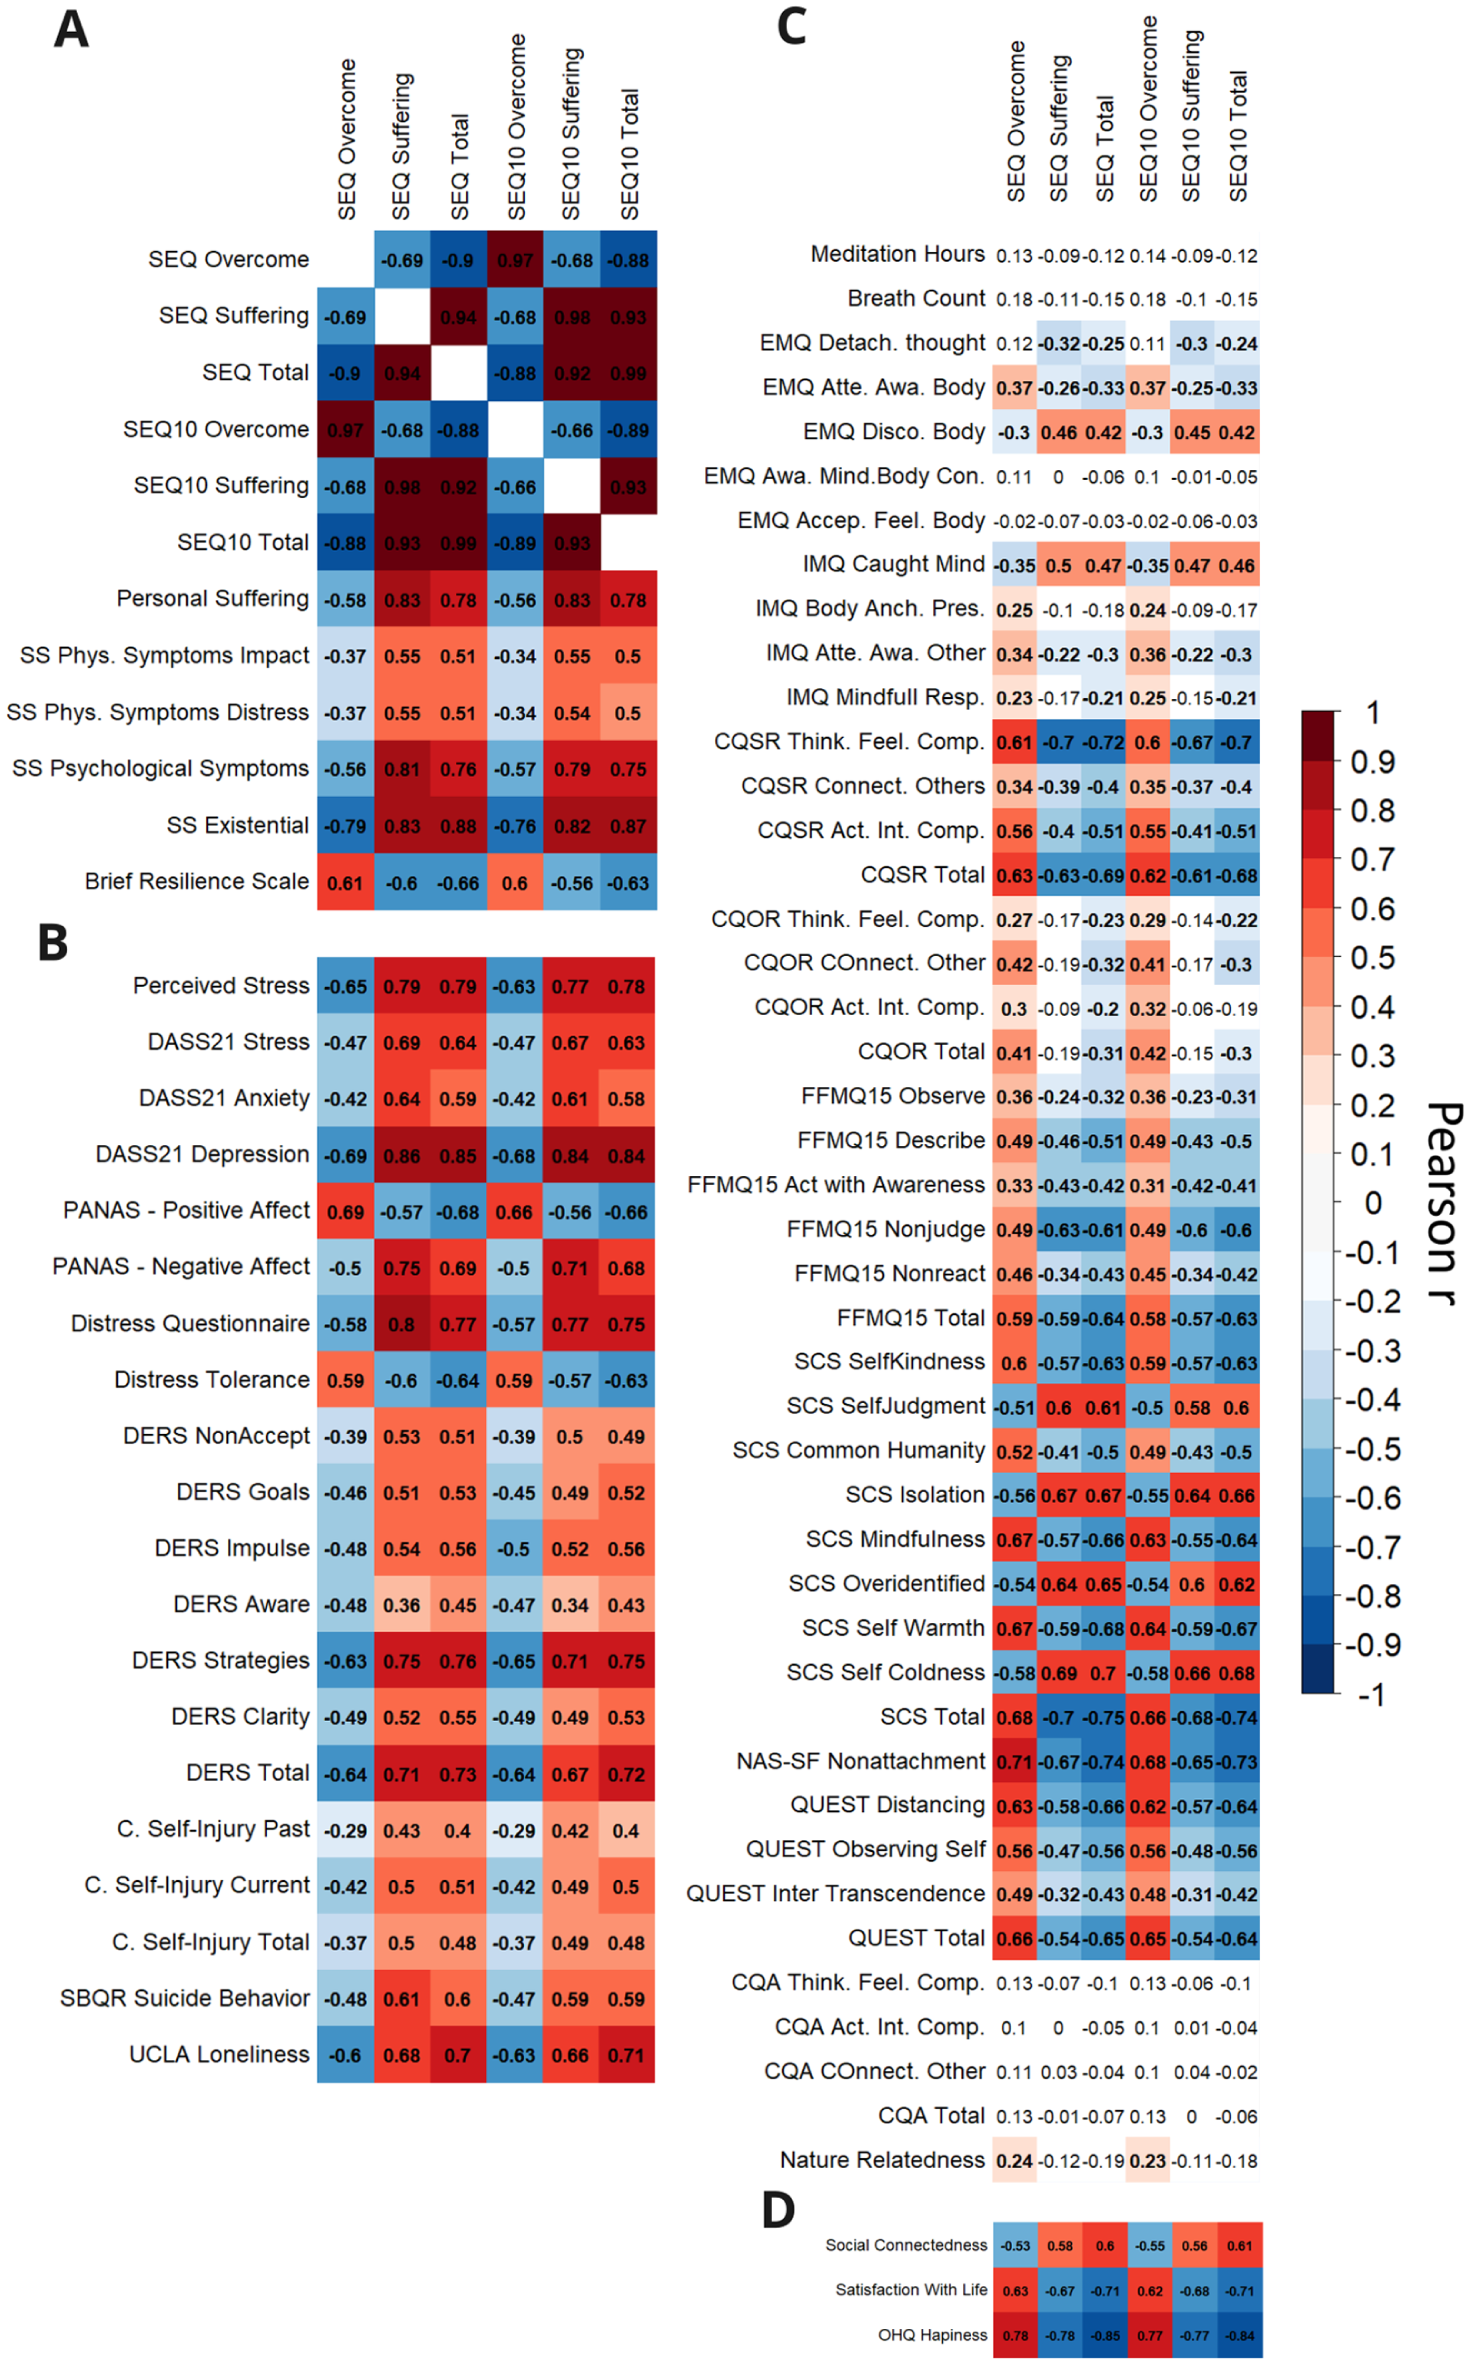
Pearson Correlation Matrix Between the SEQ and SEQ-10 Subscales, and Measures of (A) Suffering and Resilience, (B) Symptoms (Stress, Anxiety, Depression), Emotional Dysregulation, Self-Harm, Suicide, and Loneliness, (C) Mindfulness, Compassion, and Other Buddhist and EEMCF Constructs, and (D) Social Connectedness and Well-Being. All Correlations p-Values Were Corrected by Multiple Comparisons Using Bonferroni’s Correction.
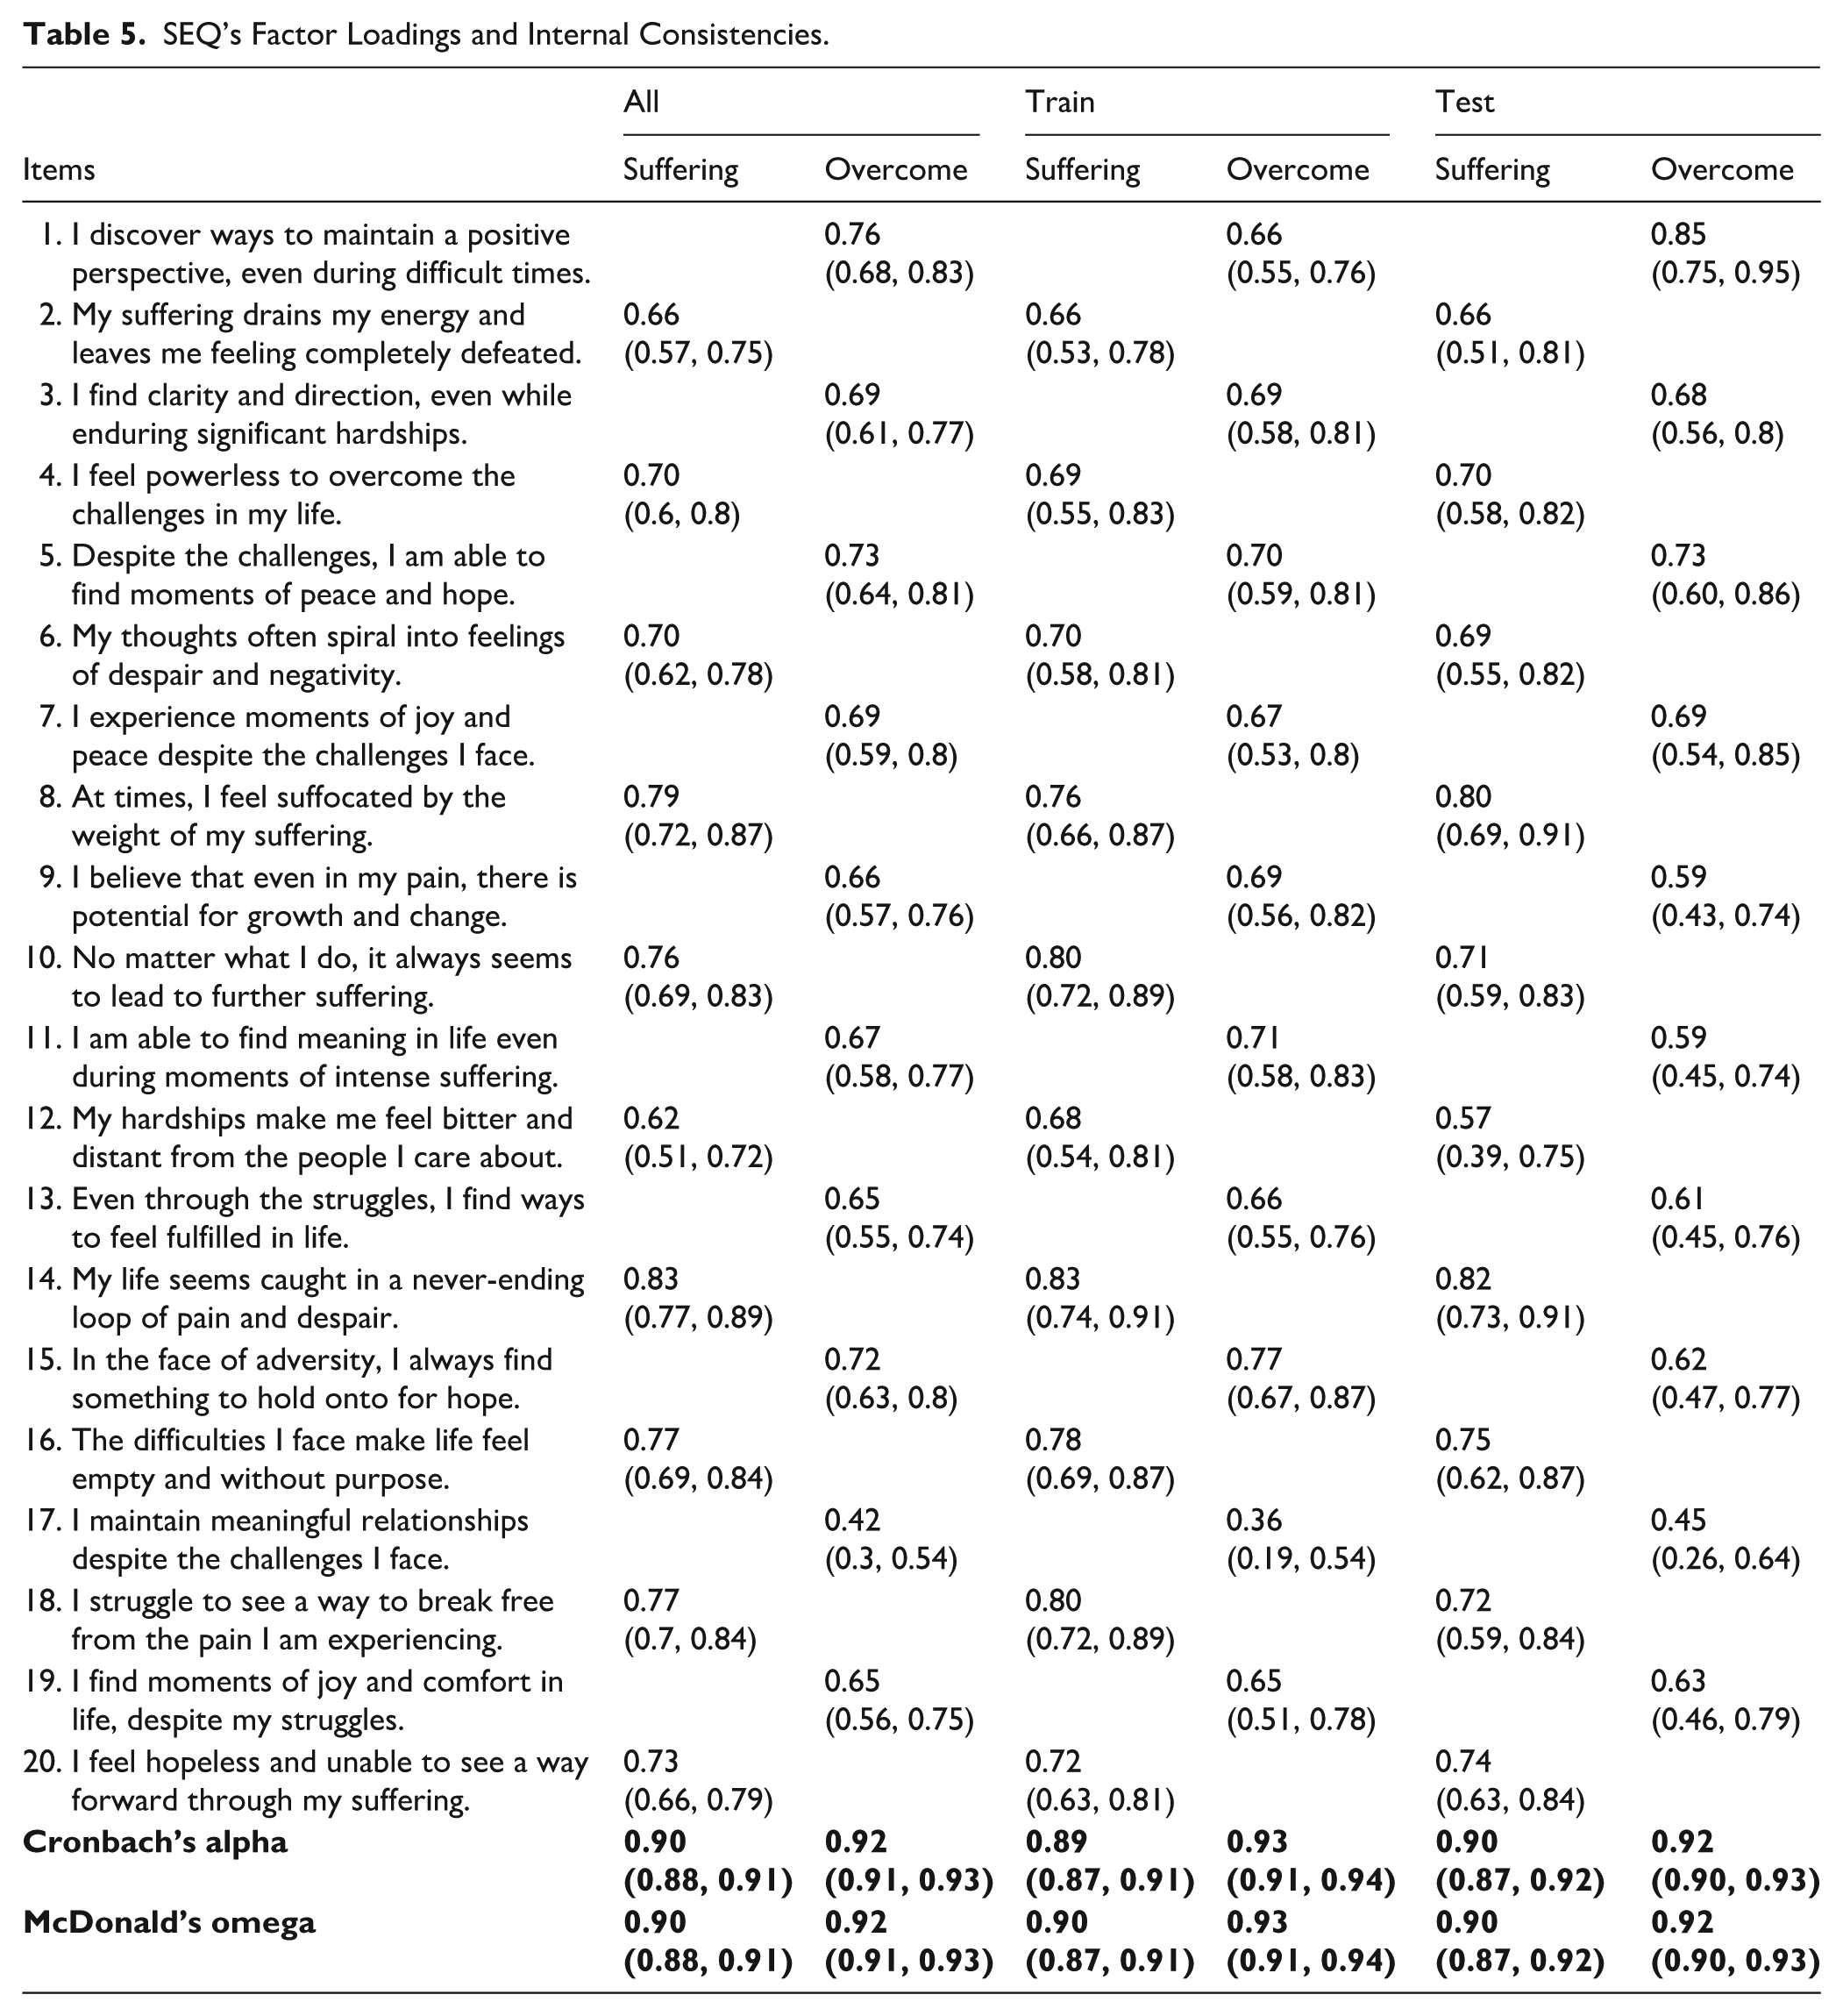
Again, diagnostics were stable in both halves using EFA and CFA, presenting an optimal fit. For both instruments a CFA fit diagnostics remains without relevant changes from Study 1 to Study 2. For both instruments, the 95% confidence intervals of the EFA loadings were above the 0.3 threshold. Internal consistencies presented a range from 0.89 to 0.93 for SEQ and 0.79 to 0.89 for SEQ-10. In the SEQ, the Suffering and Overcoming subscales showed comparable internal consistency, with the Suffering subscale exhibiting slightly lower reliability (Cronbach’s alpha: 0.89 and 0.90; Total omega: 0.90 and 0.90, first and second half respectively). For SEQ-10 again Suffering presented a lower internal consistency (Cronbach’s alpha: 0.79 and 0.81; Total omega: 0.79 and 0.81, first and second half respectively). Factor loadings and internal consistencies for SEQ and SEQ-10 are presented respectively in Tables 5 and 6. Altogether results present strong positive evidence in favor of SEQ and SEQ-10 construct validity. A version of the two instruments along with their factors and scoring is provided in Appendix A and Appendix B.
SEQ’s Factor Loadings and Internal Consistencies.
SEQ-10’s Factor Loadings and Internal Consistencies.
SEQ and SEQ-10 Convergent and Concurrent Evidence
To explore convergent evidence, we first estimated SEQ and SEQ-10 subscale scores by taking the average of the items. We divided convergence evidence into three sets of correlations: (1) to evaluate the associations with other suffering and resilience measures (PSA, SS, BRS), (2) to evaluate associations with symptoms, distress, and loneliness measures (PSS, DASS, PANAS, DTQ-5, DTS, DERS, CSII, SQBR, and UCLA LS), (3) to evaluate the associations with contemplative and EEMCF measures (meditation hours, BCT, EMQ, IMQ, CQSR, CQOR, FFMQ-15, SCS, NAS-SF, QUEST, CQA, and NRS-6), and (4) to evaluate associations with social connectedness and well-being measures (SCoS, SWLS, and OHQ).
First, we examined associations with other suffering and resilience scales. Correlations with the Suffering subscale were uniformly high, all r > .50, whereas several correlations involving the Overcoming subscale were moderate, for example with SS impact of physical symptoms, r = −.37. Both SEQ and SEQ-10 subscales correlated strongly with resilience, r range = .56 to .66; see Figure 3A.
Second, we examined correlations with symptom measures. Consistent with findings for other suffering and resilience scales, correlations between the Suffering subscale and symptom measures, as well as emotional dysregulation, were generally high, with most exceeding r = .50 with some as high as .77, including for suicidal behaviors, where correlations tended to be very high. For the Overcoming subscale, correlations were typically moderate, although some were high, with r ranging from .25 to .68.
Third, we examined correlations of the SEQ and SEQ-10 with contemplative constructs, namely mindfulness, compassion, meditation practice, nonattachment, and self-transcendence. Correlations with self-compassion measures, CQSR and SCS, were high, most exceeding r = .50 and some reaching r ≈ .75. Compassion for others was small to moderate, r = .17 to .42. Mindfulness indices were mixed, with moderate associations for some subscales, for example EMQ Disconnection from the Body, IMQ Caught in the Mind, and the FFMQ-15, and nonsignificant associations for others, for example meditation hours, breath count, EMQ Awareness of Mind and Body Connection, and EMQ Acceptance of Feelings and Body Sensations. Associations with nonattachment and self-transcendence were mostly moderate to high, r = .31 to .73, and tended to be stronger for the Suffering subscale than for the Overcoming subscale. No significant correlations were observed with compassion for animals or with nature relatedness, except for small associations between the Overcoming subscale and nature relatedness, r = .24 and .23 (for SEQ Overcome and SEQ-10 Overcome respectively). For details, see Figure 3C.
Fourth, we examined associations with social connectedness and well-being measures, namely life satisfaction and happiness. All the correlations were very high, exceeding r = .50 (r = .53 to .84); see Figure 3D.
When assessing concurrent validity through variable importance using conditional random forests, the strongest predictors for symptomatology, namely stress, anxiety, and depression, included SEQ Suffering, SEQ Total, SEQ-10 Suffering, and SEQ-10 Total among the top five (Figure 4A, B, and C). In addition, several other scales and subscales emerged as top predictors for some symptom measures, such as the PSA (for most symptoms), the EMQ Disconnection from the Body (for anxiety), and unmet basic financial needs (for anxiety).
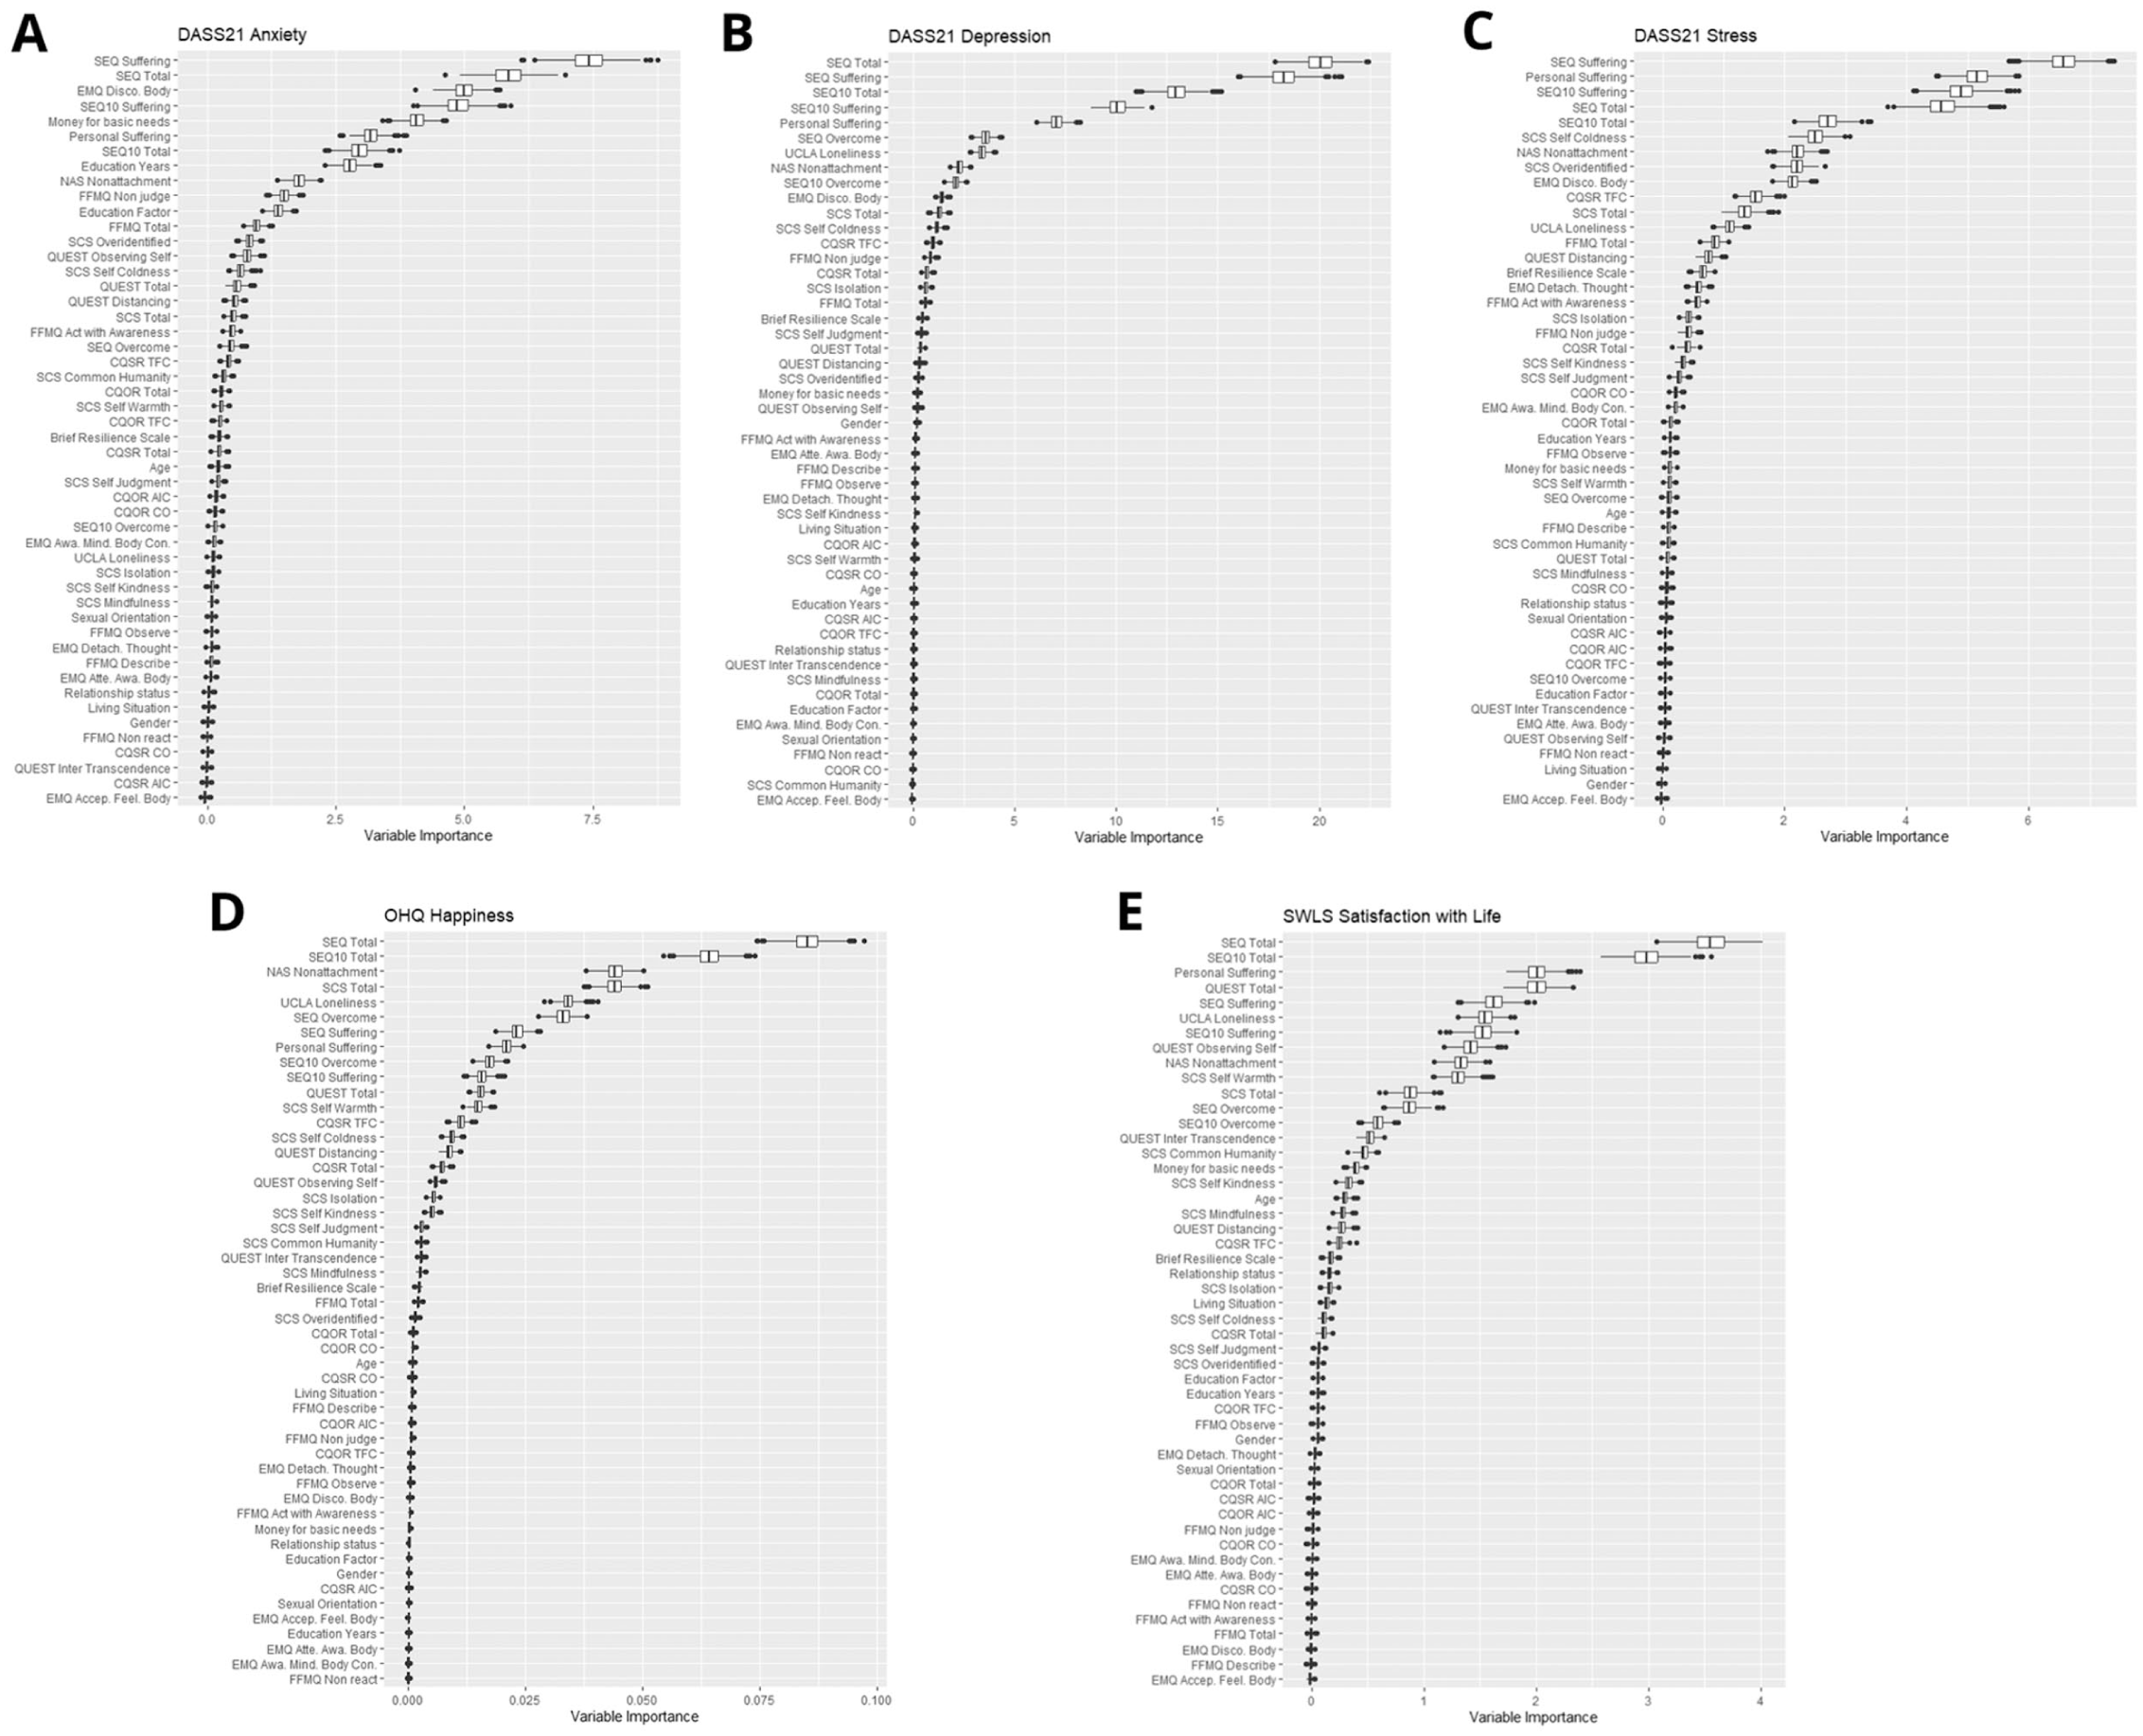
Variable Importance When Predicting Symptoms of (A) Anxiety, (B) Depression, (C) Stress, (D) Happiness, and (E) Life Satisfaction. Variable Importance Was Ordered Using the Median Value of Variable Importance Across All Measures of Each Plot.
For non-suicidal self-injury, measured by CSII, and suicidal behaviors measured by SQB-R, as with other symptomatology, SEQ Suffering emerged as a principal predictor. However, other predictors were also among the top five, including Sexual Orientation and the EMQ Disconnection from the Body subscale (Supplemental Figure S1). For suicidal behavior, SEQ Total was the top predictor, indicating that both the Suffering and Overcome subscales have predictive value for suicidal behaviors (Supplemental Figure S1D).
For well-being outcomes (namely SWLS and OHQ), SEQ Total and SEQ-10 Total were the top two predictors, indicating that both the Suffering and Overcome subscales have predictive value for well-being outcomes. A mix of other scales and subscales also ranked among the top five predictors, including SEQ Suffering, PSA, NAS Nonattachment, QUEST, and SCS Total (Figure 4D and E).
When evaluating the interactions associated with symptoms (stress, anxiety, and depression), we found a central role of SEQ Suffering, being the root in all the trees evaluated and appearing repeatedly in many splits (Figures 4C, 5D, and 5E). In some cases, such as DASS Anxiety, SEQ Suffering alone predicts those scores (Figure 5D). While in cases such as DASS Depression and DASS Stress, scores are predicted by complex interactions between SEQ Suffering and SEQ Overcome subscales, with SEQ Suffering having a leading role (Figure 5C and E). A similar pattern was observed for non-suicidal self-harm (NSSI) and suicidal behaviors, with SEQ Suffering as the central predictor and SEQ Overcome as a complementary predictor (see Supplemental Figure S2). The same pattern emerged for well-being measures, with the interaction between SEQ Suffering and SEQ Overcome predicting the outcomes, although the multilevel interaction between Suffering and Overcome was complex (see Figure 5A and B).
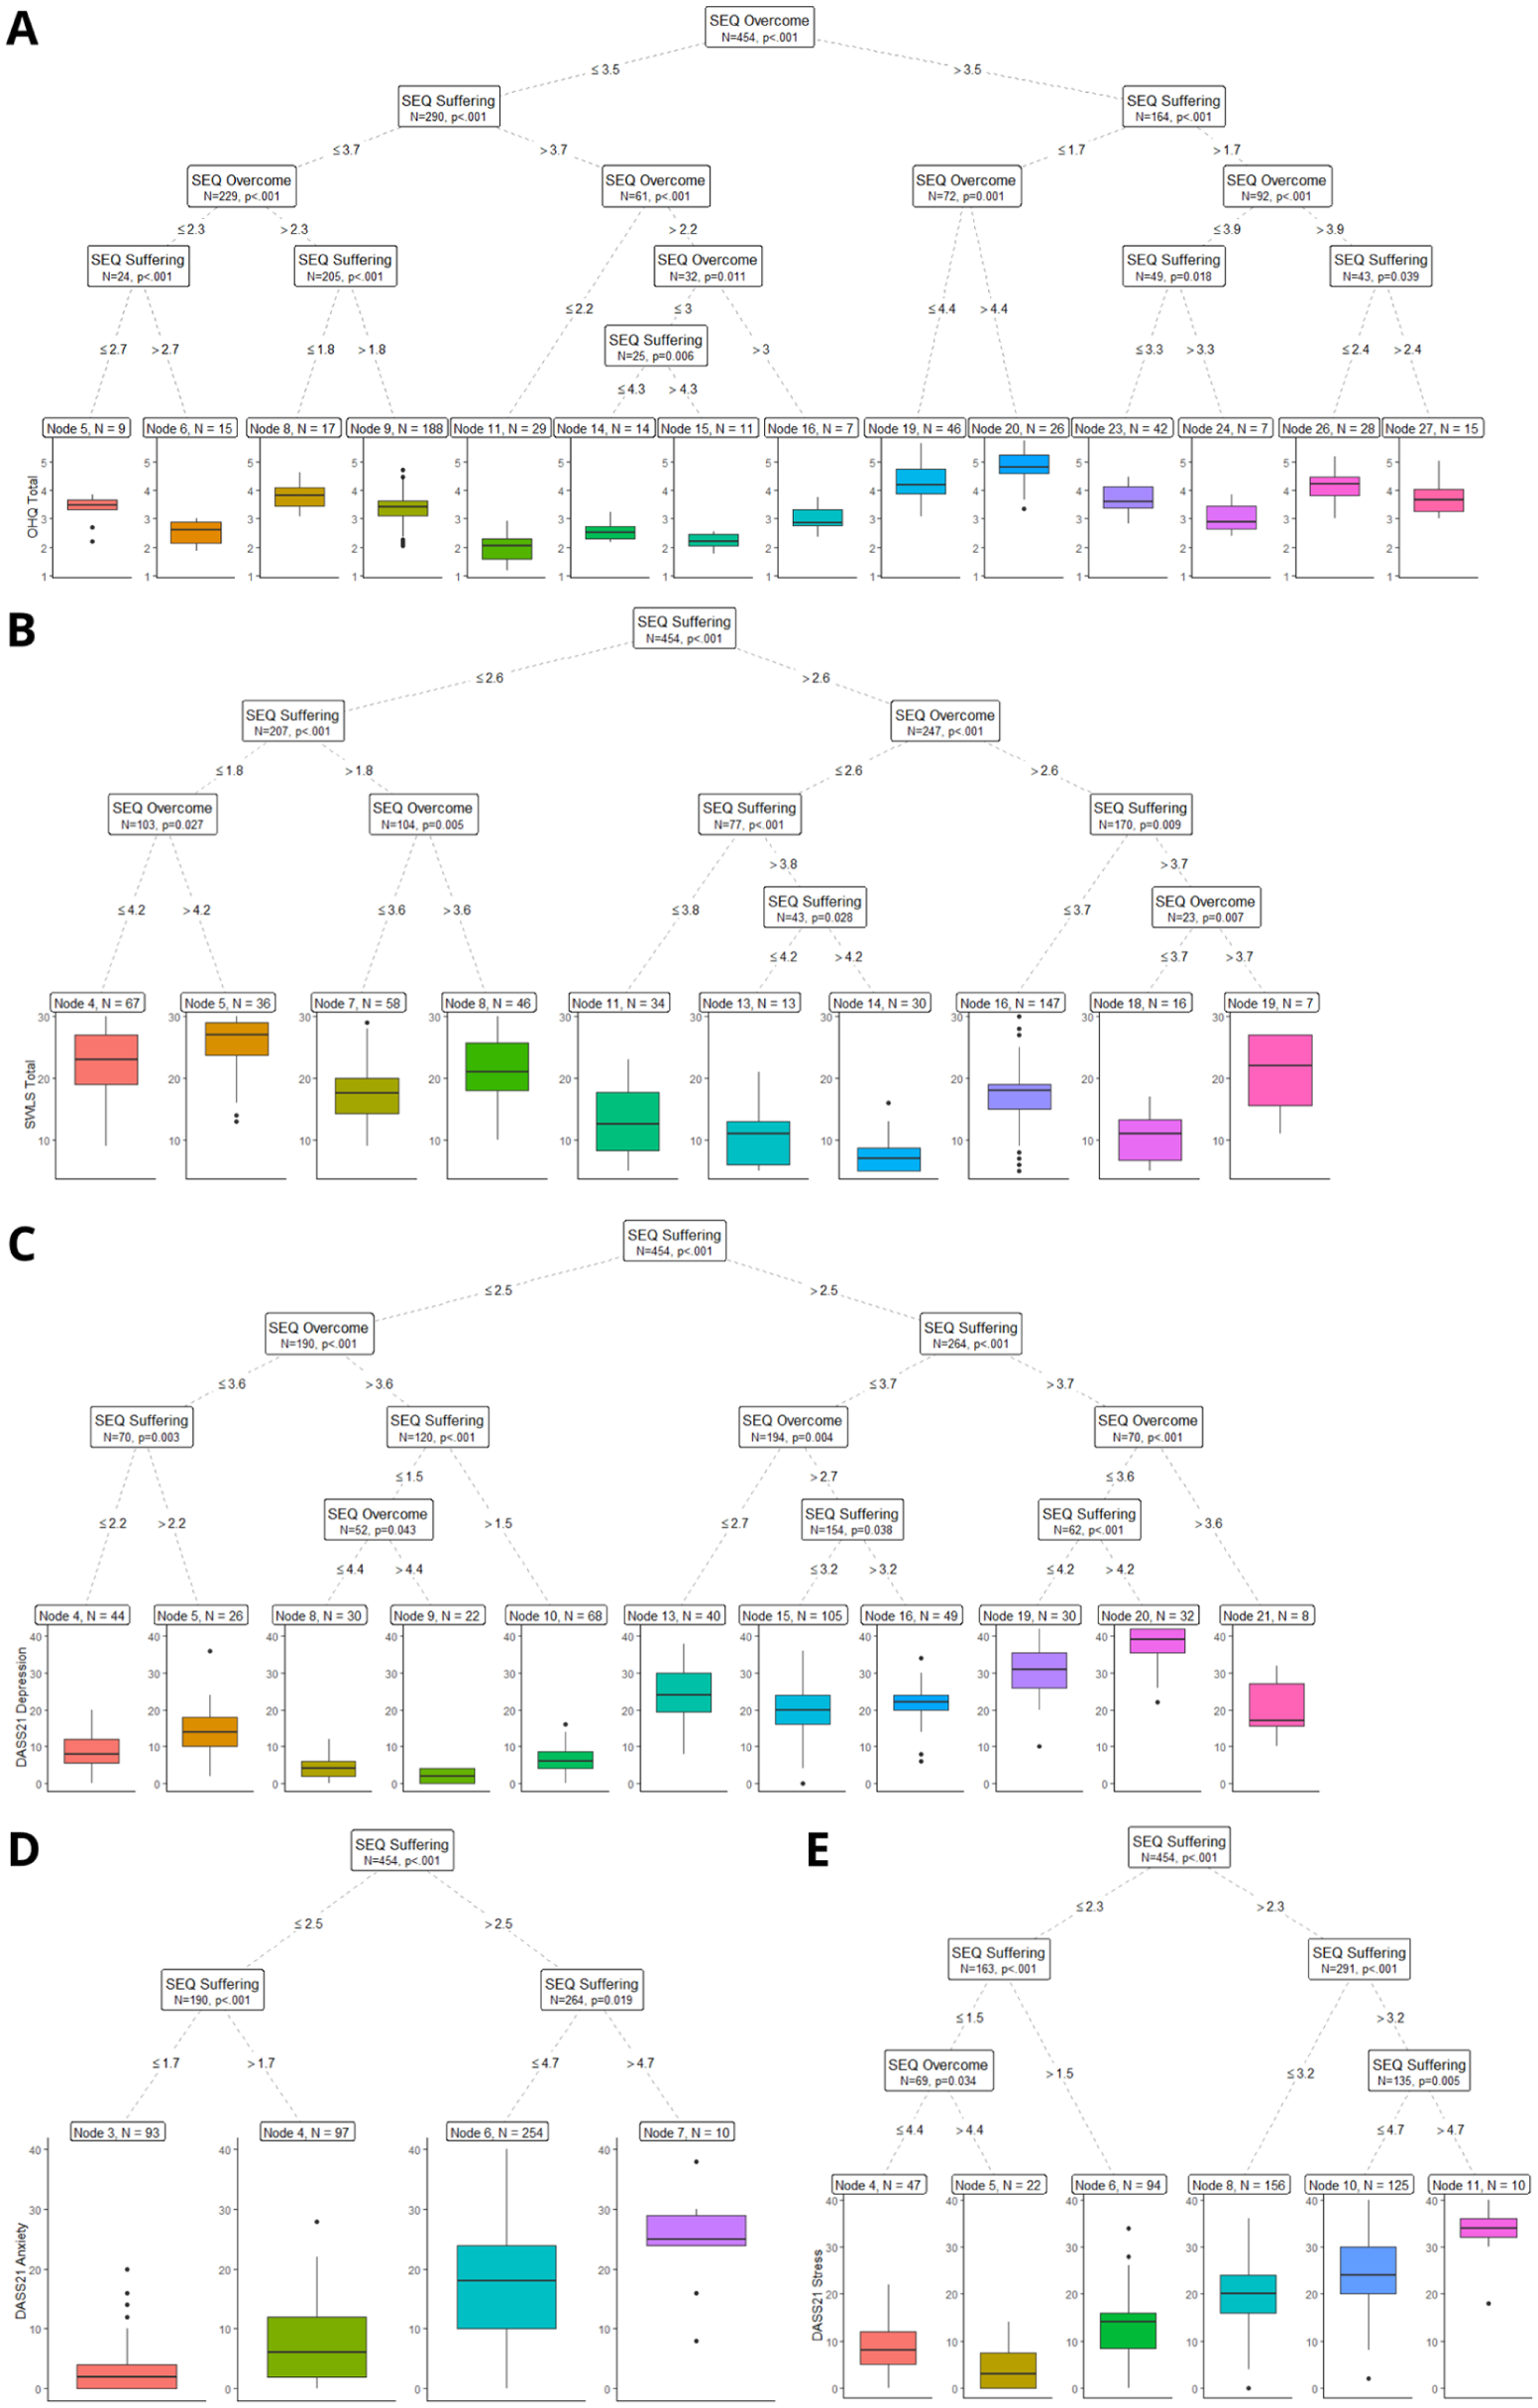
Conditional Regression of Tree Results. Sample Size for Each Final Node Is Presented (N) Along With the p-Value for Each Split. Only Significant Splits Are Reported. Trees Are Arranged According to the Variable They Predict: (A) OHQ, (B) SWLS, (C) DASS Depression, (D) DASS Anxiety, and (E) DASS Stress.
Readability
Readability estimates indicated a Flesch Reading Ease of 57.5 and a Flesch–Kincaid Grade Level of 8.4 for SEQ, and approximately 60 and 8.0 for SEQ-10. These values are similar or even better than the ones obtained for PSA (53.5/8.3), suggesting comprehensibility for readers around Grade 8, which supports use from mid-adolescence to late life.
Discussion
The aims of the current study were to reevaluate the structure and reliability of the SEQ and SEQ-10, and to assess their convergent and concurrent validity. Results from the split-half cross-validation procedure with bootstrapping supported a robust structure, with good to excellent internal consistencies for both subscales. The SEQ presented better fit and higher concurrent validity than the SEQ-10, indicating that the use of the SEQ-10 involves a compromise in precision that should be considered in the length–precision trade-off when choosing between versions.
Analyses also supported the existence of a single latent variable for the SEQ, although there remain uncertainties about the extent to which this applies to the SEQ-10. Despite the mixed results obtained from bifactor modeling, convergent evidence supports that a global score could be useful for both SEQ and SEQ-10. Concurrent evidence from random forest analyses also consistently identified the total scores of the SEQ and SEQ-10 as having higher relevance for some outcomes, suggesting that the global score may be useful despite potential structural limitations in the SEQ-10. This is noteworthy, as the SEQ and SEQ-10 are the first measures of suffering to integrate an overcoming dimension. This indicates that both suffering and overcoming experiences are relevant to the assessment of suffering. Despite the utility of the global score for both instruments, we recommend reporting the two subscale scores, Suffering and Overcoming, in addition to the total score, as they capture distinct aspects of experience.
Specifically, Suffering items focus on the impact of suffering and the struggle to cope. They include feelings such as despair, hopelessness, powerlessness, bitterness, and emptiness. They also capture patterns of thinking, such as rumination or spiraling, as well as actions or inaction, such as isolation or withdrawal, in the face of suffering. In contrast, the Overcome dimension focuses on ways of feeling, such as hope, joy, and peace. It also includes ways of thinking, such as a positive perspective, optimism, and clarity. In addition, it captures ways of behaving or interacting with others, such as cultivating meaningful relationships or relying on supportive connections, that buffer the effects of suffering and pain and can foster change and growth, for example, “I believe that even in my pain, there is potential for growth and change.”
Convergent analyses indicated strong associations between the SEQ and SEQ-10 subscales and other measures of suffering, as well as with symptom measures, namely stress, anxiety, and depression, measures of self-harm and suicide, and indices of emotion dysregulation and loneliness. Associations were moderate to large with constructs central to Buddhist psychology and the EEMCF, namely compassion, nonattachment, and self-transcendence. By contrast, associations with mindfulness measures were low to moderate, and some were absent, for example meditation hours, breath counting, and certain EMQ and IMQ subscales. This pattern may reflect the limited meditation or mindfulness experience in the sample. For example, the EMQ and IMQ assess sequential sets of skills, some of which require greater experience and practice (Khoury et al., 2022, 2023), which may explain the variability in associations between the SEQ or SEQ-10 and specific EMQ or IMQ subscales, whereas associations were more consistent for other mindfulness measures, such as the FFMQ-15. Finally, very strong associations were observed between the SEQ and SEQ-10 and well-being measures, namely life satisfaction and happiness along with social connectedness.
In addition, analyses using conditional random forests indicated that the SEQ, and specifically the SEQ Suffering subscale, is a primary predictor of symptomatology, including stress, anxiety, depression, self-harm, and suicidal behavior. The SEQ also predicted well-being measures, namely satisfaction with life and happiness, with the Overcome subscale serving as a complementary predictor. This is noteworthy because neither the SEQ nor the SEQ-10 includes symptom items in their wording, yet they were among the most significant, and at times the sole, predictors of multiple highly established and widely used symptoms and well-being measures. In addition, compared with the PSA, the SEQ consistently emerged as a stronger, more stable, and more consistent predictor, suggesting that the SEQ is a significant and distinctive measure of suffering in a field that has seen limited scale development for a long time.
The emergence of the EMQ Disconnection from the Body subscale as a significant predictor of symptoms is noteworthy. It suggests a central role for bodily disconnection in psychopathology and underscores the value of cultivating body connection skills to counter symptomatology. These findings are consistent with the theoretical framework of embodied mindfulness, which places the body, and the bidirectional mind–body connection, at the center of mindfulness (Khoury et al., 2017, 2019) and with prior empirical findings (Khoury & Vergara, 2024b).
General Discussion
Two studies were conducted to evaluate the structure, internal consistency, reliability, and convergent and concurrent validity of a new Suffering Experiences Questionnaire, SEQ, and its shortened 10-item form, SEQ-10. Across both studies, SEQ and SEQ-10 demonstrated strong psychometric properties. Below, we discuss their potential utility.
First, SEQ and SEQ-10 are, to our knowledge, the first suffering measures that focus on lived experiences of suffering rather than enumerating physical, psychological, emotional, or existential symptoms. Although the Personal Suffering Assessment, PSA, also sought to assess suffering beyond symptoms, its content breadth is limited. In fact, in Study 2, SEQ and SEQ-10 subscales and total scores were stronger predictors, within our models, of symptom measures, stress, anxiety, depression, self-harm, and suicidal behavior, and well-being measures, life satisfaction and happiness, than the PSA. This pattern suggests that the experiential framing of SEQ and SEQ-10 may better capture aspects of suffering that are proximally related to psychopathology and well-being in two large samples of participants.
Second, SEQ and SEQ-10 are the first suffering measures to balance items that represent suffering with items that represent overcoming suffering. This content is absent in some measures, for example the PSA, or only minimally present in others, for example the SS includes seven positively valenced items among a total of 42. In both studies, the Overcome dimension complemented the Suffering dimension in defining a global latent factor. In Study 2, the Overcome subscale also showed a complementary role in predicting multiple psychological symptoms and well-being outcomes, for example stress, depression, and self-harm indicators. These findings suggest that overcoming processes contribute unique variance beyond suffering per se.
Third, many existing measures of suffering, aside from the seven-item PSA, are lengthy and symptom-based, for example SS with 42 items and SOS-V with 69 items, which limits feasibility in vulnerable populations, such as individuals with severe mental disorders (e.g., schizophrenia, dementia, and other psychotic or cognitive/neurocognitive disorders), advanced medical illness (e.g., cancer patients, or those with severe chronic illnesses or pain), or those at end of life (e.g., in palliative care). Consistent with experts’ panel recommendations to remain at or below 20 items, SEQ includes 20 items, and SEQ-10 includes 10 items. Items were deliberately simple and each targeted a single aspect of suffering or overcoming suffering, for example SEQ Item 4, “I feel powerless to overcome the challenges in my life.” The wide age range in our samples, 18 to 89 years old, further indicates usability across adulthood. Use below age 18 and especially below 14 years old requires additional validation.
From a practical perspective, most extant instruments are symptom focused and primarily suited to clinical assessment contexts. In contrast, the SEQ instruments are nonclinical by design, applicable across populations, and brief, yet in our data they predicted a broad set of clinical symptom measures and well-being indicators. This profile supports their use in community, educational, and public health contexts in addition to clinical settings. Moreover, items on overcoming suffering, for example SEQ and SEQ-10 Item 1, “I discover ways to maintain a positive perspective, even during difficult times,” can inform the design of programs and interventions aimed at individuals experiencing suffering, and can be integrated with cognitive behavioral approaches and contemplative approaches, for example mindfulness and compassion-based interventions.
In summary, the development and validation of the SEQ and SEQ-10 provide practical, easy to use tools for assessing experiences of suffering without reliance on symptom lists embedded in specific theoretical or clinical taxonomies. These measures may help demystify suffering in Western contexts and support a more integrative understanding of suffering and ways to overcome or transcend it. This integrative view may facilitate conceptual dialogue between Western biopsychosocial models of suffering and Buddhist inspired perspectives, while future research should explicitly examine cross-cultural generalizability, developmental variability, and applicability across diverse clinical populations, as well as sensitivity to change in intervention trials.
Limitations
The present study has several limitations. First, the participant samples in both studies were skewed toward women, which is a common bias in compassion research, particularly when recruitment is conducted primarily through social media platforms such as Facebook. It is noteworthy that in Study 2 the percentage of women participants was lower than in Study 1 due to efforts to increase diversity. Despite this reduction in gender imbalance, future research should reassess the reported gender differences and conduct multigroup invariance analyses to evaluate measurement and structural equivalence across genders. In addition, most participants were English speaking Canadians, reflecting the study’s locale, which may limit the generalizability of the SEQ and SEQ-10 to non-Canadian populations, although the samples did display some diversity in ethnicity, background, sexual orientation, and other sociodemographic characteristics.
Second, test–retest reliability was not assessed. Establishing temporal stability over appropriate intervals, for example 2 to 4 weeks, is needed to determine reproducibility of scores. Third, clinical sensitivity was not evaluated. Future work should examine sensitivity to change by assessing pre to post intervention differences in SEQ and SEQ-10 scores, for example in cognitive behavioral, mindfulness, or compassion-based programs, and by estimating responsiveness indices, for example standardized response mean and minimal detectable change. Fourth, even though the studies included a large number of measures, some were omitted, such as additional measures of resilience or flourishing (VanderWeele, 2017). Fifth, the SEQ-10 was not administered independently, which might have influenced the results pertaining to the SEQ-10. Future studies should administer the SEQ-10 independently to confirm its psychometric properties. Sixth, both studies were not preregistered, which may reduce transparency and introduce potential bias. However, all results were fully reported, and every decision made during the development and validation of the scales was clearly documented.
Last, the survey instruments were presented in a fixed order to streamline administration, which could introduce order effects or non-random missingness. Nonetheless, internal consistency estimates for all measures were very good irrespective of their placement in the sequence, which supports the overall quality of the data. Despite these limitations, the present work achieved its objectives by developing and validating a new suffering experiences questionnaire and its short form, and by providing robust evidence for their structural, convergent, and concurrent validity.
Supplemental Material
sj-docx-1-asm-10.1177_10731911261437561 – Supplemental material for Suffering Experiences Questionnaires: Scales Development and Validation
Supplemental material, sj-docx-1-asm-10.1177_10731911261437561 for Suffering Experiences Questionnaires: Scales Development and Validation by Bassam Khoury and Rodrigo C. Vergara in Assessment
Footnotes
Appendix A
Appendix B
Acknowledgements
We would like to acknowledge the contributions of the many experts in the field who reviewed, commented on, and provided feedback regarding the dimensions and items of the validated measure. We also extend our thanks to the graduate students who offered feedback and corrections on the items, and who participated in data collection and preparation for analyses, including Agata Kasprzyk, Viktoriya Manova, Brandon Benchimol Elkaim, Claudia Dias Martins, Leena Anand, Isabel Sadowski, and Kevin Prada.
Ethical Considerations
The study received ethics approval at the host university (i.e., McGill University, REB # 24-06-082-08).
Author Contributions
B.K. designed the study with the assistance of R.C.V., and wrote the introduction, discussion, and parts of the methods and analyses section. R.C.V. conducted the analyses, wrote parts of the methods and results section, and edited the other sections of the paper. All the authors have reviewed and approved the final version of the manuscript for submission.
Funding
The authors disclosed receipt of the following financial support for the research, authorship, and/or publication of this article: The authors would like to acknowledge the financial support received from the Social Sciences and Humanities Research Council of Canada (SSHRC) through the Insight Development Grant (IDG # 430-2021-00078) and McGill William Dawson Scholars Award.
Declaration of Conflicting Interests
The authors declared no potential conflicts of interest with respect to the research, authorship, and/or publication of this article.
Data Availability Statement
The data supporting the findings of the current research are not publicly available as per restrictions imposed by the ethics certificate from McGill University. However, the code for statistical analyses is available upon request.
Supplemental Material
Supplemental material for this article is available online.
Use of Artificial Intelligence
ChatGPT-5 was used to correct and enhance some of the sentences in this paper.