
Abstract
There is a dearth of publicly available standardized and normed reading anxiety tests (RATs) with known psychometric properties. In this study, we collected self-report data (n = 416), parent-report data (n = 455), or both (n = 184), for primary (n = 498) and secondary students (n = 473) for four RATs plus the Revised Child Anxiety and Depression Scale-25 (RCADS-25) and the Strengths and Difficulties Questionnaire (SDQ). Analyses revealed that 21 items for each RAT loaded on three factors (generalized, social, and physiological reading anxiety), which had good internal consistency (.85 to .98) and interrater reliability (.82 to .90). Further, RAT scores correlated more closely with RCADS-25 anxiety scores (r = .54; convergent validity) than RCADS-25 depression scores, SDQ prosocial behavior, conduct problems, and peer problems scores (rs = −.03 to –.41; discriminant validity). We therefore calculated norms for each RAT, which are freely available on motif.org.au.
Background
In many Western countries, the literacy levels of students appear to be in freefall, with one-third of primary students failing to meet minimum standards in the United States, the United Kingdom, and Australia (GOV.UK, 2024a; National Assessment of Educational Progress, 2024; Thomson et al., 2019). At the same time, these countries are reporting high levels of severe anxiety in large proportions (5%–10%) of children and adolescents (Australian Institute of Health and Welfare, 2024; Bitsko et al., 2022; GOV.UK, 2024b).
Traditionally, problems with reading and anxiety have been considered independent issues, which is why they are typically assessed and treated separately. However, there is growing evidence that problems with reading may be directly related to certain types of anxiety—particularly reading anxiety (i.e., elevated fears and worries about the act of reading or learning to read) and social anxiety (elevated fears and worries about negative evaluations from peers in social situations; American Psychiatric Association [APA], 2022).
There is also growing evidence that poor reading may be more closely related to reading anxiety than social anxiety, although this evidence is limited by the small number of studies that have tested reading anxiety in readers of any age or any level of ability. This may be partly explained by a lack of publicly available standardized assessments of reading anxiety with established reliability, validity, and normative data. The aims of this study were to measure the reliability and validity of four standardized self- and parent-report Reading Anxiety Tests (RATs; Francis et al., 2023a; Francis et al., 2023b; Francis et al., 2023c; Francis et al., 2023d) designed for students in primary and secondary school and provide norms for these tests on motif.org.au.
Existing Tests of Reading Anxiety
To our knowledge, only eight studies have measured the reliability or validity of an assessment for reading anxiety, and none have provided normative data. The earliest study was by Zbornik and Wallbrown (1991), who developed and validated a 45-item Reading Anxiety Scale (RAS) using the self-report data of 436 U.S. students in grades 4 to 6. This data included scores on the Children’s Anxiety Scale (Gillis, 1980), which was moderately correlated with RAS total scores (r = .46; p < .001) and RAS subscale scores (fear of curiosity: r = .39, p < .001; fear of aggression: r = .41, p < .001; fear of independence: r = .36, p < .001). As stated by the authors (p. 8), “the ideal situation for validating a measure of reading anxiety should be evident in the form of a moderate degree of overlap with general anxiety,” since this demonstrates enough common variance to indicate it is a measure of anxiety (evidence for convergent validity; American Educational Research Association [AERA] et al., 2014) and enough unique variance to indicate it measured a different type of anxiety. Inspection of the individual items in the RAS for the validity of test content (AERA et al., 2014) reveals that just one item (36c) assesses an emotion related to anxiety (“nervous”) and only two items (25a, 43i) assessed any other type of emotion (“upset”). Thus, the RAS includes three items relating to reading anxiety (construct under-representation; AERA et al., 2014) and 42 items relating to other reading-related mental health constructs (construct irrelevance; AERA et al., 2014). While this limits the strength of the construct validity of the RAS as a measure of reading anxiety per se, it seems that Zbornik and Wallbrown (1991) are the first researchers to consider reading anxiety as a construct, which represents a significant step forward in our knowledge base.
It was almost three decades before another RAS appears in the research literature. Katzir et al. (2018) modified the Abbreviated Math Anxiety Scale (Hopko et al., 2003) to produce a 9-item self-report reading anxiety questionnaire that was administered to 115 grade 2 students in Israel. They reported a Cronbach’s α of .83, which is evidence of good internal consistency, which is an index of reliability (AERA et al., 2014). However, the authors only included three of the nine items (i.e., “How concerned are you when you think about an upcoming literacy lesson”, “…think of literacy lessons,” “…begin to study a new topic in literacy classes”) and two of those items are near identical. Thus, it is not possible to assess the test content of this scale to help evaluate its construct validity.
A year later, Ramirez et al. (2019) tested 607 U.S. students in grades 1 and 2 on a 16-item self-report RAS (e.g., “How do you feel when your teacher asks you to read out loud during class?”) and a 3-item self-report scale for positive reading effect (e.g., “I like reading”). Their analyses indicated that the RAS had good internal consistency (Cronbach’s α = .86) and that scores were moderately correlated with an aspect of mental health that was not anxiety specific (reading affect: r = −.27, p < .001), which can be considered evidence for discriminant validity. An examination of individual scale items in the Appendix of the Ramirez et al. (2019) study (i.e., test content) indicates that eight items focused on “nervousness” about classroom scenarios (e.g., “How do you feel when your teacher asks you to read out loud during class?”) which certainly reflects anxiety. More unusually, eight items focused on nervousness about reading specific words (e.g., “How would you feel if you were asked to read these words? bug sheep bath”). This confounds reading anxiety with reading ability (e.g., children with reading anxiety who know they can read these words may not report reading anxiety for these items). This obscures the validity of half the items and hence the test’s overall construct validity.
In 2021, Barber et al. first published a study of 339 Spanish-English bilingual students and 178 English monolingual students in grades 3 to 5 in U.S. schools. They each completed a 6-item self-report reading anxiety questionnaire (e.g., “I get nervous when my teacher asks me to read something I never read before”) and their teachers completed an 8-item reading engagement scale (e.g., “often reads independently”). Reading anxiety items were reported to have good internal consistency (McDonald’s omega = .73). Reading anxiety scores were moderately correlated with a non-anxiety measure of reading engagement (r = .30, p < .001), which suggests appropriate discriminant validity. Inspection of the reading anxiety questionnaire items (test content) indicates that four used terms directly related to anxiety (“nervous” [2 items], “stressed,” “body stiffens”) but two used statements that could be rated highly by poor readers without reading anxiety (e.g., “Reading for school takes all of my energy”). Thus, four of the six items had good construct validity.
In the same year, Macdonald et al. (2021) reported on a study of 272 U.S. students with reading difficulties in grades 4 and 5 who completed a 6-item self-report Reading Anxiety Questionnaire (Grills, unpublished) and the 20-item Beck Youth Anxiety Inventory (e.g., “I worry about the future”; Beck et al., 2001). The reading anxiety items were reported to have good internal consistency (Cronbach’s α = .77), and the reading anxiety total scores were moderately correlated with general anxiety scores (r = .63, p < .01), indicating fair convergent reliability. Unfortunately, the items of the reading anxiety questionnaire were not published, and hence, we cannot assess test content to help ascertain construct validity.
Also in 2021, Pollack et al. published a study of 146 eight to thirteen-year-old U.S. students with a range of learning abilities who completed a 13-item self-report RAS for Young Children (e.g., “reading gives me a stomach-ache”) and the 20-item self-report Motivation to Read Profile-Revised (e.g., “reading is something I like to do”; Malloy et al., 2013). Their responses indicated that reading anxiety items had good internal consistency (Cronbach’s α = .84) and discriminant validity when compared to the non-anxiety measure of reading motivation (r = −.65, p < .001). Unfortunately, we could not assess the test content because Pollack et al. did not report the individual items. However, we were able to consult Ganley and McGraw’s (2016) 21-item math anxiety scale upon which the reading anxiety items were based. Eleven items used terms that directly targeted anxiety (“nervous,” “worried,” “scared,” “stomach-ache,” “heart beats fast”). If the RAS used similar items, then most of the 13 items would have targeted anxiety. However, we do not know if this was the case and hence the construct validity is unclear.
Very recently, Sasanguie et al. (2024) tested 754 grade 5 students in Belgium on a 16-item self-report RAS based on the items developed by Ramirez et al. (2019; e.g., “How do you feel when you take your reading book and see all the texts and words in it?”) and a test-anxiety subtest from the SchoolVragenLijst (Smits Joop & Vorst Harry, 2008; e.g., “right before a test, I am afraid that I will forget something because of feelings of tension”). Their data indicated that the RAS had excellent internal consistency (α = .92), composite reliability (r = .91), and appropriate convergent validity with test-anxiety scores (r = .42). However, because the 16 items were based on those developed by Ramirez et al. (2019), the same limitations of construct validity apply.
Finally, in the same year, Fishstrom et al. (2024) published a study of 536 English-speaking U.S. students in grades 3 to 5 who completed Grills’ 6-item self-report Reading Anxiety Questionnaire (unpublished), the 20-item self-report Beck Anxiety Inventory for Youth (Beck et al., 2001), and the 30-item self-report Children’s Test-Anxiety Scale (Wren & Benson, 2004). They found moderate correlations between reading anxiety scores and general anxiety (r = .51, p < .01) and test-anxiety scores (r = .51, p < .01), which provides support for convergent validity. However, as mentioned above, the items of Grills’ questionnaire have not been published—although Fishstrom et al. (2024) did cite one item (“taking reading tests scares me”), which does focus squarely on reading anxiety.
In sum, eight studies have provided statistics for the internal or external reliability of a RAT. These statistics provide evidence that most had good internal consistency (a measure of reliability) and adequate convergent and discriminant validity. However, half the studies did not publish individual items, which prevents us from assessing test content for construct validity (Fishstrom et al., 2024; Katzir et al., 2018; Macdonald et al., 2021; Pollack et al., 2021); and the other half included items that targeted reading anxiety but the number of items was small (3–8; Barber et al., 2022; Ramirez et al., 2019; Sasanguie et al., 2024; Zbornik & Wallbrown, 1991). In addition, no study to date has used or developed a scale with norms, which is important for determining if a child’s reading anxiety is at a level of concern for clinical, educational, or research purposes; and no study has focused on students beyond the primary school grades, which leaves a large gap in our knowledge about reading anxiety in adolescents at secondary school. Finally, the studies that focused on children all employed self-report RASs, even though some children—particularly those who are young or have language difficulties—find it difficult to conceptualize their anxiety or to understand the meaning of questions about their anxiety (Hudson et al., 2014). This highlights the importance of gaining insights from parents about their child’s anxiety. Experts recommend that anxiety should be measured via reports from multiple people who know the young person (Silverman & Ollendick, 2008), but consistency between reports is often low (De Los Reyes, 2011). It can be difficult to reconcile these inconsistencies; however, the anxiety symptoms reported by different people (e.g., children, adolescents, and parents) provide useful information about how the young person’s anxiety presents in different situations.
The Current Study
Given these gaps in our theoretical and clinical understanding, the fourth and sixth authors of this study worked with colleagues to create a new standardized RAT that comprised 48 items that focused specifically on thoughts, feelings, and physical symptoms of reading-related anxieties (i.e., strong test content). They modified these items slightly to create four separate RATs for children in primary school (RAT-C; Francis et al., 2023c) and their parents (RAT-CP; Francis et al., 2023d), and for adolescents in secondary school (RAT-Ad; Francis et al., 2023a), and their parents (RAT-AdP; Francis et al., 2023b; see motif.org.au). The aims of this study were to further develop these standardized RATs by (a) assessing and modifying the internal structures (i.e., factors and items); (b) assessing their reliability (i.e., internal consistency and interrater reliability); and (c) testing their validity (i.e., convergent and discriminant validity). If we found good evidence for reliability and validity for each RAT, we planned to address a fourth aim, which was to provide norms for each RAT.
Method
Ethical Approval
The methods used in this study were approved by the Macquarie University Human Research Ethics Committee (#52021618126362).
Participants
Participants were recruited via two independent schools (n = 310), social media (n = 237), an independent online panel provider (n = 467), and a specialist anxiety clinic (n = 41). We contacted school principals to invite their schools to participate, and two consented. Parents of children in grades 3 to 10 from these two schools were sent information about the study and an opt-out consent form. To boost the size and diversity of the sample, we also posted social media advertisements (Facebook and Twitter) and obtained a sample from a panel provider (Cint). Parents and youth chose to opt into the study with information and consent forms. Children seeking treatment for anxiety and their parents were also invited to participate in a clinical assessment at a specialist anxiety clinic. Consenting participants completed the survey during this assessment.
The analysis included data from 1,055 participants (see Data Analysis Plan for details about included and excluded data) via parent report (n = 455), self-report (n = 416), or both (n = 184). The overall sample had a mean age of 12.25 years (SD = 3.55; range = 4.07–18.66 years) whom we categorized as “children” if they were in primary school (kindergarten to grade 6; n = 498; Mage = 9.37; SD = 2.02; 4.07–13.74 years) or “adolescents” if they were in secondary school (grades 7–12; n = 473; Mage = 15.27, SD = 1.95; 11–18.66 years).
Students’ genders were reported to be female (42.9%), male (55.7%), nonbinary (0.6%), other (0.5%), or unreported (0.3%). Most participants (91.2%) reported English as the main language spoken at home, and 5.3% of participants identified as Aboriginal, Torres Strait Islander, or both. The majority (59.9%) reported Oceanian as their cultural group. In our sample, 15.2% of students had received extra support for their reading, which was expected since around 16% of children have reading skills below the average range (i.e., more than one standard deviation below the age or grade mean; Shaywitz et al., 1992). More detailed demographic data for the children and adolescents are provided in Supplemental Material, including differences across sampling groups.
Measures
Reading Anxiety Test (RAT)
As outlined above, the original standardized RAT-C, RAT-CP, RAT-Ad, and RAT-AdP each included 48 items to be completed by children (C) or their parents (CP) and adolescents (Ad) or their parents (AdP), respectively. These 48 items (and the final 21 items) are available at motif.org.au. Participants responded to each item on a 4-point scale where 0 = Never, 1 = Sometimes, 2 = Often, 3 = Always. Participants were also given the option to select “I don’t understand” for each item. Item scores are summed, with higher total scores indicating higher reading anxiety.
Revised Child Anxiety and Depression Scale-25 (RCADS-25)
The RCADS-25 (Ebesutani et al., 2012) includes 25 statements that relate to five anxiety content domains (generalized, social, separation, panic, and obsessive-compulsive, e.g., I worry that something bad will happen to me) and depression (e.g., I feel sad or empty). Children and adolescents (RCADS-25-C) or their parents (RCADS-25-P) use 4-point Likert Scales (0 = Never, 1 = Sometimes, 2 = Often, and 3 = Always) to indicate the degree to which each statement applies to themself/their child. Higher scores indicate higher anxiety (out of 45) or depressive (out of 30) symptoms. Raw scores are converted into grade and gender-normed T-scores.
Regarding internal consistency, Cronbach’s alpha values ranged from .79 to .91 (RCADS-25-C) and .80 to .90 (RCADS-25-P) in Ebesutani et al. (2012); and from .90 to .92 (RCADS-25-C) and at .89 (RCADS-25-P) in the current study. Also in terms of internal reliability, Cronbach’s alpha ranged from .77 to .90 for in-school and clinical samples tested by Ebesutani et al. (2017). In terms of validity, both versions effectively discriminate between individuals with and without anxiety or depression as diagnosed via clinical interviews (Ebesutani et al., 2012, 2017).
Strengths and Difficulties Questionnaire (SDQ)
The SDQ (Goodman, 2001) consists of 25 statements of emotional and behavioral symptoms, which form five subscales: emotional symptoms (e.g., I worry a lot), hyperactivity-inattention (e.g., I am constantly fidgeting or squirming), conduct problems (e.g., I get very angry and often lose my temper), peer problems (e.g., I have one good friend or more), and prosocial behavior (e.g., I am helpful if someone is hurt, upset or feeling ill). Children (SDQ-C) and parents (SDQ-P) indicate on a 3-point Likert scale (0 = Not True, 1 = Somewhat True, and 2 = Certainly True; with five items reverse-scored) the degree to which each item applies to them/their child. Scores on each subscale range from 0 to 10 where higher scores indicate a greater level of symptoms.
The SDQ has adequate internal consistency, with an average Cronbach’s alpha of .73 according to Goodman (2001), and a range of .59 to .79 in the present study. Correlations between parent, child, and teacher ratings indicate acceptable interrater reliability (Goodman, 2001). Regarding validity, the SDQ successfully identifies several DSM-IV diagnoses, including conduct disorder and attention-deficit/hyperactivity disorder (Goodman et al., 2003; He et al., 2013).
Procedure
Data was collected via online surveys (LimeSurvey) to maximize the diversity of participants and statistical power. Attention checks (two in the child/adolescent survey and one in the parent survey) were embedded in the survey to ensure participants were reading the items. Participants were asked to “please choose ‘sometimes’ for this question.” For children aged 4 to 6 years, we only collected reports from parents since their children were too young to complete self-report measures.
Students from the two independent schools completed the survey during class with the support of the researchers. Their parents were emailed the link to the survey to be completed in their own time. Researchers were on hand to assist participants who completed the online survey at the clinic during their clinical assessment. Parents and youth recruited from social media and the panel completed the survey independently online via the links provided. Most participants (71.7%) did not request help. Of those who did, 3.5% were assisted with technical issues (e.g., accessing the survey), 8.5% with reading questions (66% of whom were aged 7–11 years), and 17.8% with understanding questions (75% of whom were aged 7–11 years).
Panel participants were monetarily reimbursed for completing the survey. Other participants were entered in a draw to win an iPad valued at $529.
Data Analysis Plan
A total of 1,268 participants completed our survey. To ensure data quality, we assessed the reliability of responses made by participants who failed at least one attention check. On average, this was poorer than the rest of the sample and thus we excluded 137 parent reports and 102 self-reports that failed at least one attention check. We also excluded participants with >20% missing data on the RAT (n = 106), and we treated “I don’t understand” responses as missing values. Prorating was used to calculate total and subscale scores on the RAT where participants had < 20% missing data (e.g., a score of 40 based on 44 responses would become 43.6 on the full scale of 48). This process produced a final dataset that included 1,055 participants.
To first assess the factor structure of the RAT with sufficient power, we completed an exploratory factor analysis with the total sample. Parallel analysis and inspection of scree plots were first conducted to determine the number of factors to be retained for the parent and self-report RATs. Three factors were retained. We then performed principal axis factoring with oblique (oblimin) rotation to interpret factor loadings as we expected our factors to be correlated. Major loadings were defined as values of at least 0.32, which equates to a 10% overlapping variance with other items in that factor (Tabachnick & Fidell, 2001). We then repeated this process considering children and adolescents separately. We then inspected individual items and removed any that were poorly understood, had major factor loadings on multiple items, or had strong content overlap. This process resulted in a reduced 21-item RAT.
Next, we performed confirmatory factor analyses (CFA) to validate the proposed three-factor solution for the reduced RAT. Using the Structural Equation Modelling (SEM) builder in Stata/MP 18 (StataCorp LLC, Texas, USA), generalized reading anxiety, social reading anxiety, and physiological reading anxiety were included as latent variables, with covariances between them (given the correlations between factors). We included the relevant items as observed variables for each latent variable. This model was first tested on the total sample by randomly splitting the sample in half 10 times. We then completed a multigroup CFA to compare the model fit in children and adolescents separately. To assess goodness-of-fit, we used multiple indices. Root mean square error of approximation (RMSEA) < 0.08, comparative fit index (CFI) > 0.90, Tucker-Lewis index (TLI) > 0.90, and standardized root mean square residual (SRMR) < 0.08 were used to indicate acceptable model fit (Kline, 2005). We did not use modification indices or adjustment measures as these revealed no consistent pattern across the versions of the RAT.
To test the reliability of the RAT, we assessed internal consistency using Cronbach’s alpha and McDonald’s omega and assessed interrater reliability using intraclass correlations (ICCs) between parent and self-report scores. For internal consistency, we considered values greater than 0.8 to be very good (Ursachi et al., 2015). Regarding interrater reliability, values greater than .50 were considered acceptable (Portney & Watkins, 2013).
To assess convergent validity, we calculated Pearson correlation coefficients between RAT total scores and RCADS-25 anxiety subscale scores across the whole sample and for children and adolescents separately. To assess discriminant validity, we calculated Fisher’s r to z transformations between total scores on the RATs and (a) the RCADS-25 depression subscale, (b) the SDQ peer problems subscale, (c) the SDQ prosocial behavior subscale, and (d) the SDQ conduct problems subscale. Again, we did this for the whole sample and for children and adolescents separately. All analyses (excluding internal consistency, which was analyzed in R studio) were completed in Stata/MP 18.
Finally, we created norms for the RAT. We calculated percentiles for total and subscale scores for self and parent-report forms for children and adolescents. We interpolated percentiles for the possible values of the RAT that were missing in our dataset. For example, no participant scored 24 on the generalized reading anxiety subscale of the RAT-Ad, thus, a percentile for a score of 96 was interpolated from the percentiles associated with scores of 25 and 26. Percentiles were then rounded to the nearest integer. We considered scores at the 84th percentile or above as elevated.
Results
Aim 1: Assessing and Modifying the Internal Structures (i.e., Factors and Items)
Factors
In the first step of the analysis, we used exploratory factor analyses to understand the factor structure of the RATs. To maximize power, we started by combining child and adolescent data to conduct parallel factor analyses for self (n = 549) and parent (n = 584) report data.
Initially, the results suggested that three factors should be retained for the parent-report data and four factors for the self-report data. Closer examination of the factor loadings on the self-report data revealed just one item—“I worry that Mum or Dad or someone at home will think I’m not trying when I read aloud”—was captured uniquely by the fourth factor. This was removed and principal axis factoring with three factors was performed on both parent and self-report data. These factors were intercorrelated for parent-report data (rs = .56 to .64) and self-report data (rs = .41 to .72). Thus, we performed an oblimin rotation (factor loadings and correlations between factors are provided in Supplemental Material). Bartlett’s test of sphericity indicated that factor analysis was appropriate for the data in the parent report (X2[1,128] = 32,787.12, p < .001) and self-report (X2[1,128] = 28,006.34, p < .001). The Kaiser-Meyer-Olkin measure of sampling adequacy was also sufficient for both parent and self-report (both values = .98).
We then repeated these analyses on the child and adolescent data separately to assess whether this factor structure is valid for both children and adolescents (see Supplemental Material). Again, three factors emerged in the parent report for children and adolescents, and four factors emerged in the self-report for children and adolescents. Like the overall analysis, when the self-report for children and adolescents was analyzed separately, only one or two items were captured by the fourth factor. Collectively these results gave confidence that the overall three-factor solution was valid for both children and adolescents.
Items
Once we understood that each test had three factors, we focused on the quality of individual items. We started by removing any item that was rated as “I don’t understand” by five or more children. This removed just one item: “I feel light-headed when I’m reading or thinking about reading” (20). We also removed any items that loaded on two or more factors in self-report and/or parent-report versions of the scale. This removed 22 items (2, 5, 7, 14, 15, 17, 18, 22, 23, 24, 25, 27, 29, 31, 33, 35, 41, 43, 44, 45, 47, and 48). When we redid the factor analysis, items 42 and 46 loaded on more than one factor and hence were also removed.
We then inspected the remaining items and factor loadings to identify any obvious content overlap. This identified two similar items in the self and parent reports (30 and 36): “I feel afraid when I have to read because other kids will laugh at my reading”/“My child feels afraid when s/he has to read because s/he thinks other kids will laugh at his/her reading” (30) versus “I worry that other kids will laugh at me when I read aloud”/“My child worries that other kids will laugh at him/her when s/he reads aloud” (36). Item 36 had a stronger loading and was more succinct, so item 30 was removed. We also removed item 37 (“I worry when I have to read aloud in front of good readers”/“My child worries when s/he has to read aloud in front of good readers”) because (1) four children chose the “I don’t understand” option, (2) its loading was only 0.33, and (3) it was very similar to another item (“I worry when I have to read aloud in front of my classmates”/“My child worries when s/he has to read aloud in front of his/her classmates”).
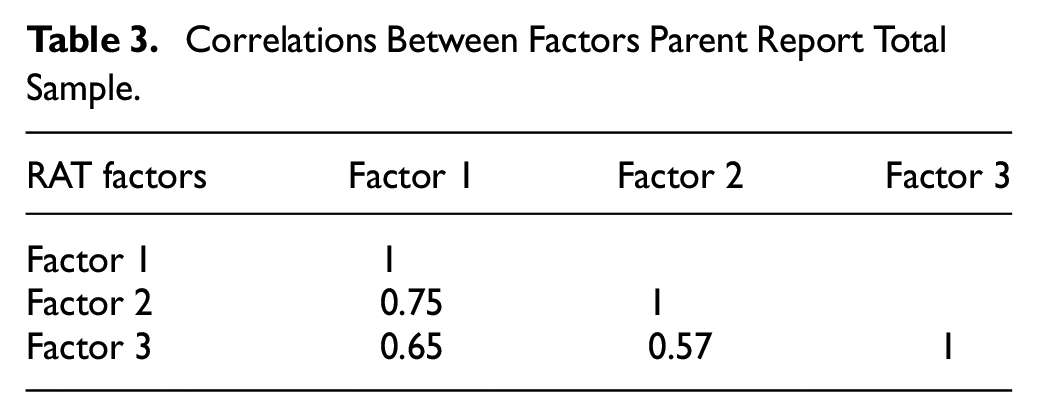
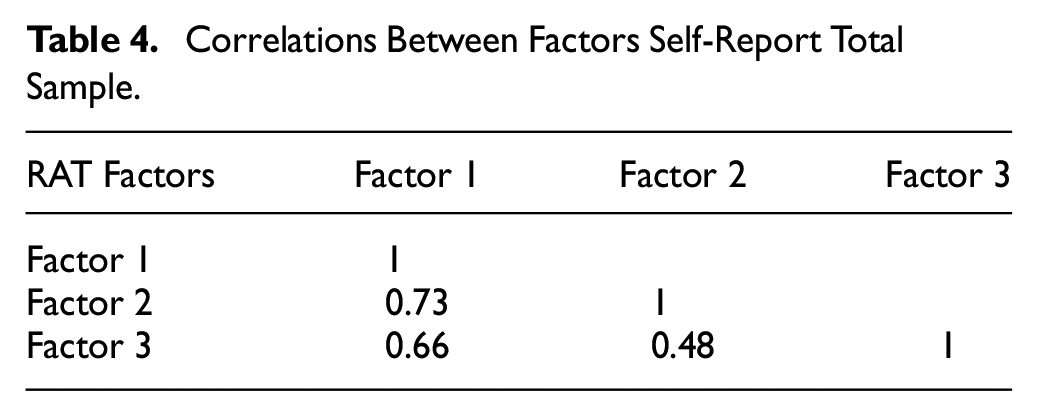
This process left us with 21 items in each of the RAT-C, RAT-Ad, RAT-CP, and RAT-AdP. Bartlett’s test of sphericity indicated sufficient correlations for both parent-report data (X2[210] = 13,021.55, p < .001) and self-report data (X2[210] = 10,332.83, p < .001). The Kaiser-Meyer-Olkin measure of sampling adequacy was also excellent for both parent (0.97) and self-report (0.96). Again, parallel analysis was performed with the 21-item measures and indicated that three factors should be retained for the parent and self-report. Principal axis factoring and oblimin rotation were also performed. Eleven items were loaded onto a generalized reading anxiety factor, six items loaded onto a social reading anxiety factor and four items loaded onto a physiological symptoms factor (see Tables 1 and 2). The correlations between factors are reported in Tables 3 and 4.
Major Factor Loadings of the RAT Parent Report Total Sample.
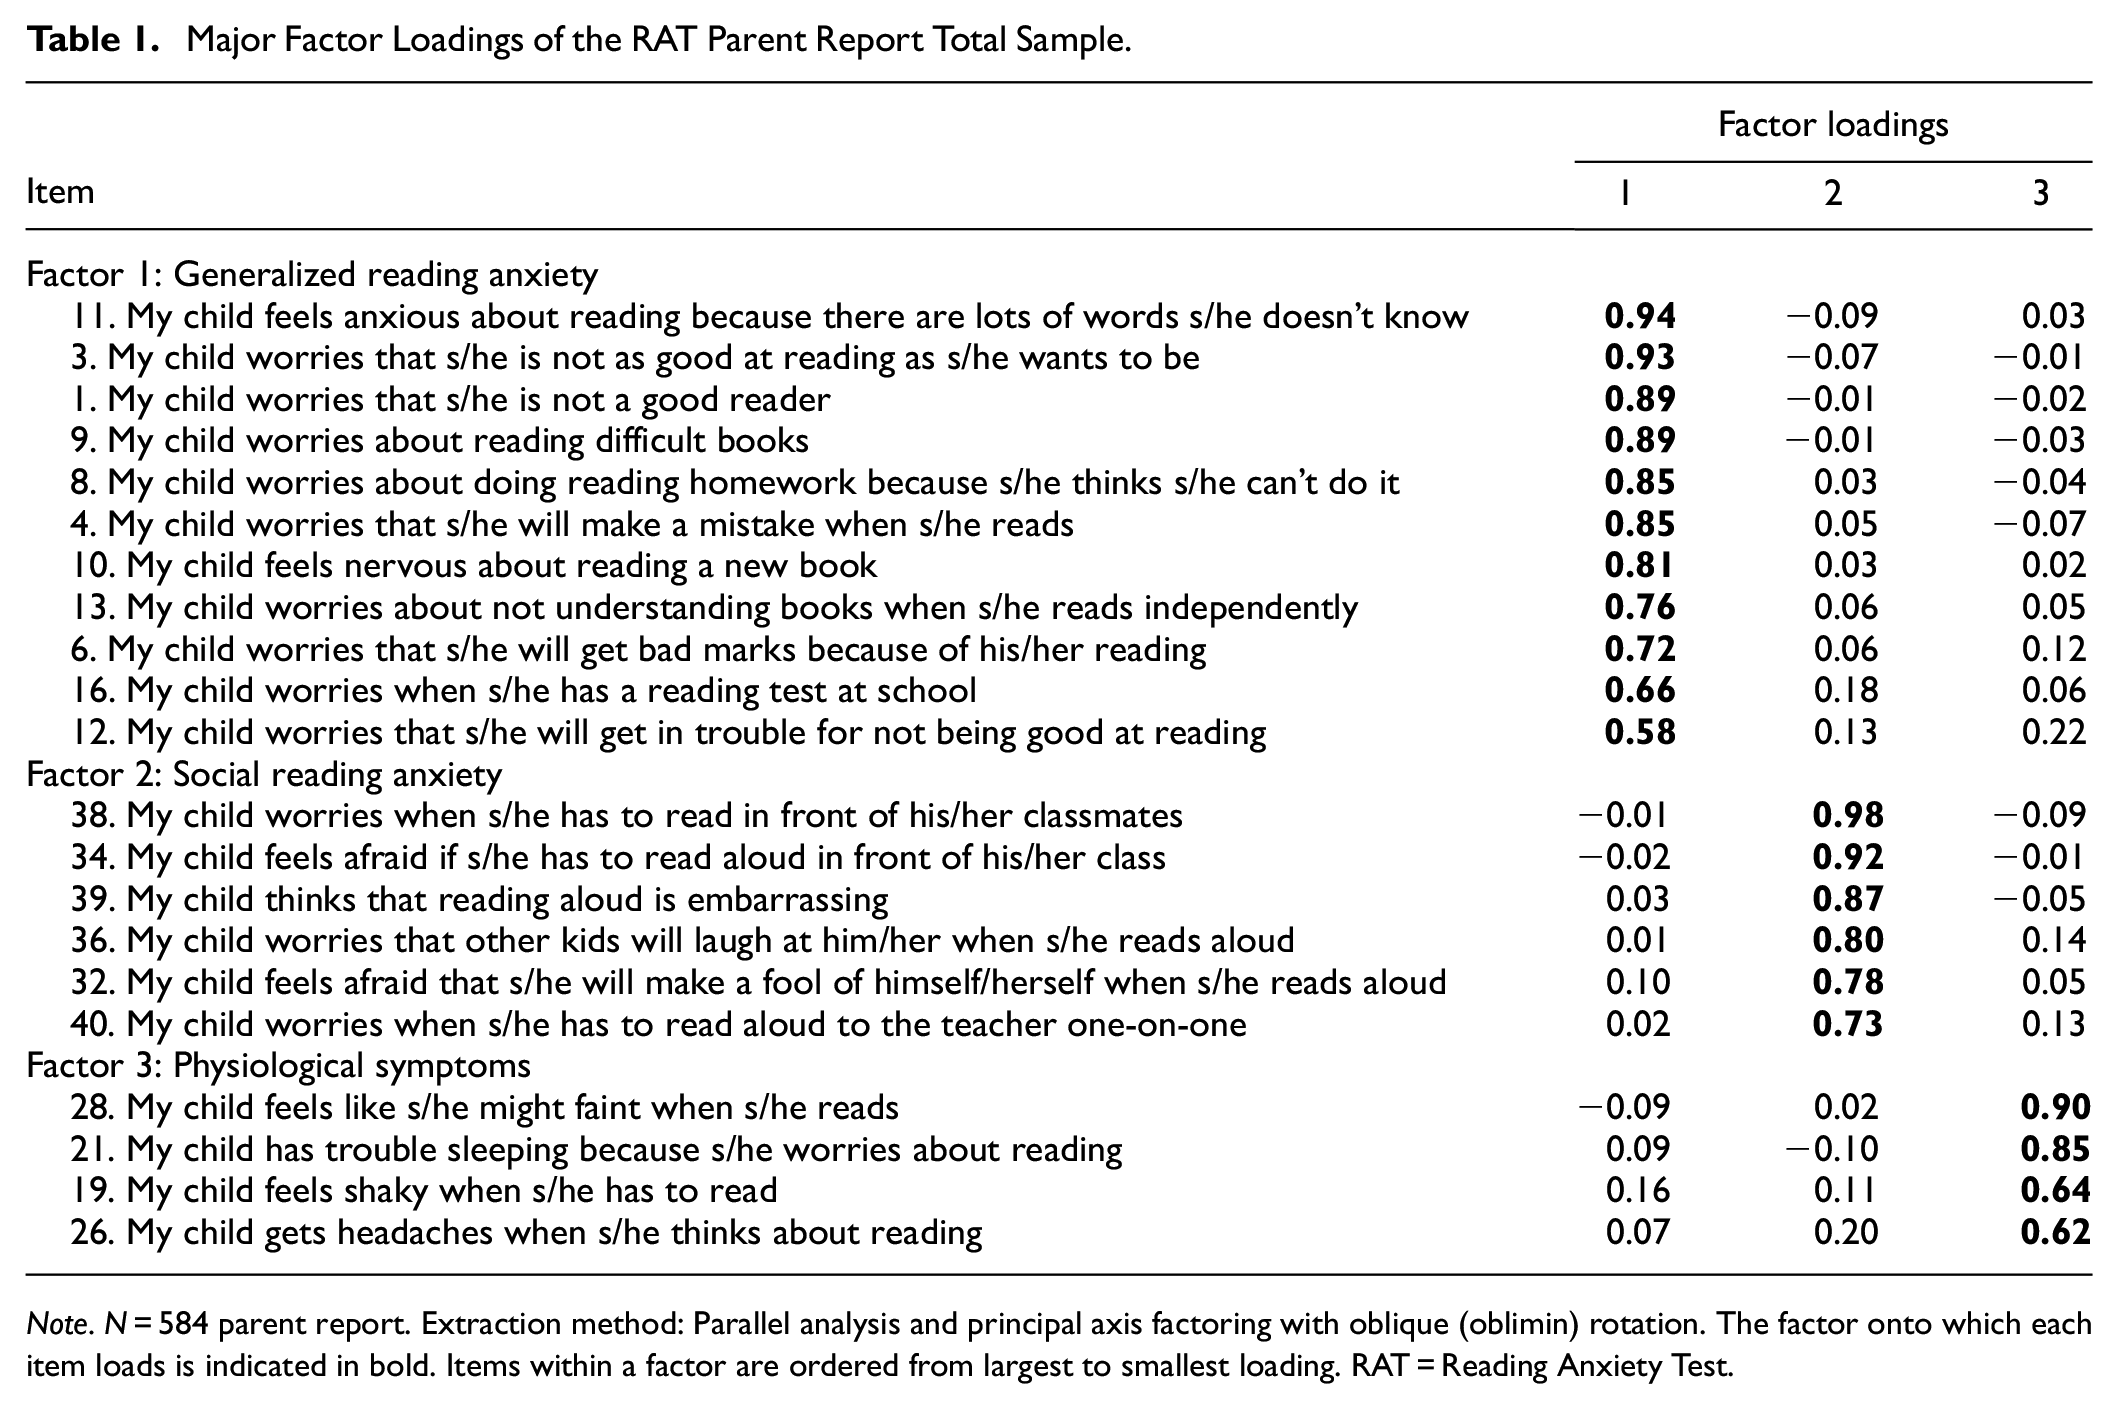
Note. N = 584 parent report. Extraction method: Parallel analysis and principal axis factoring with oblique (oblimin) rotation. The factor onto which each item loads is indicated in bold. Items within a factor are ordered from largest to smallest loading. RAT = Reading Anxiety Test.
Major Factor Loadings of the RAT Self-Report Total Sample.
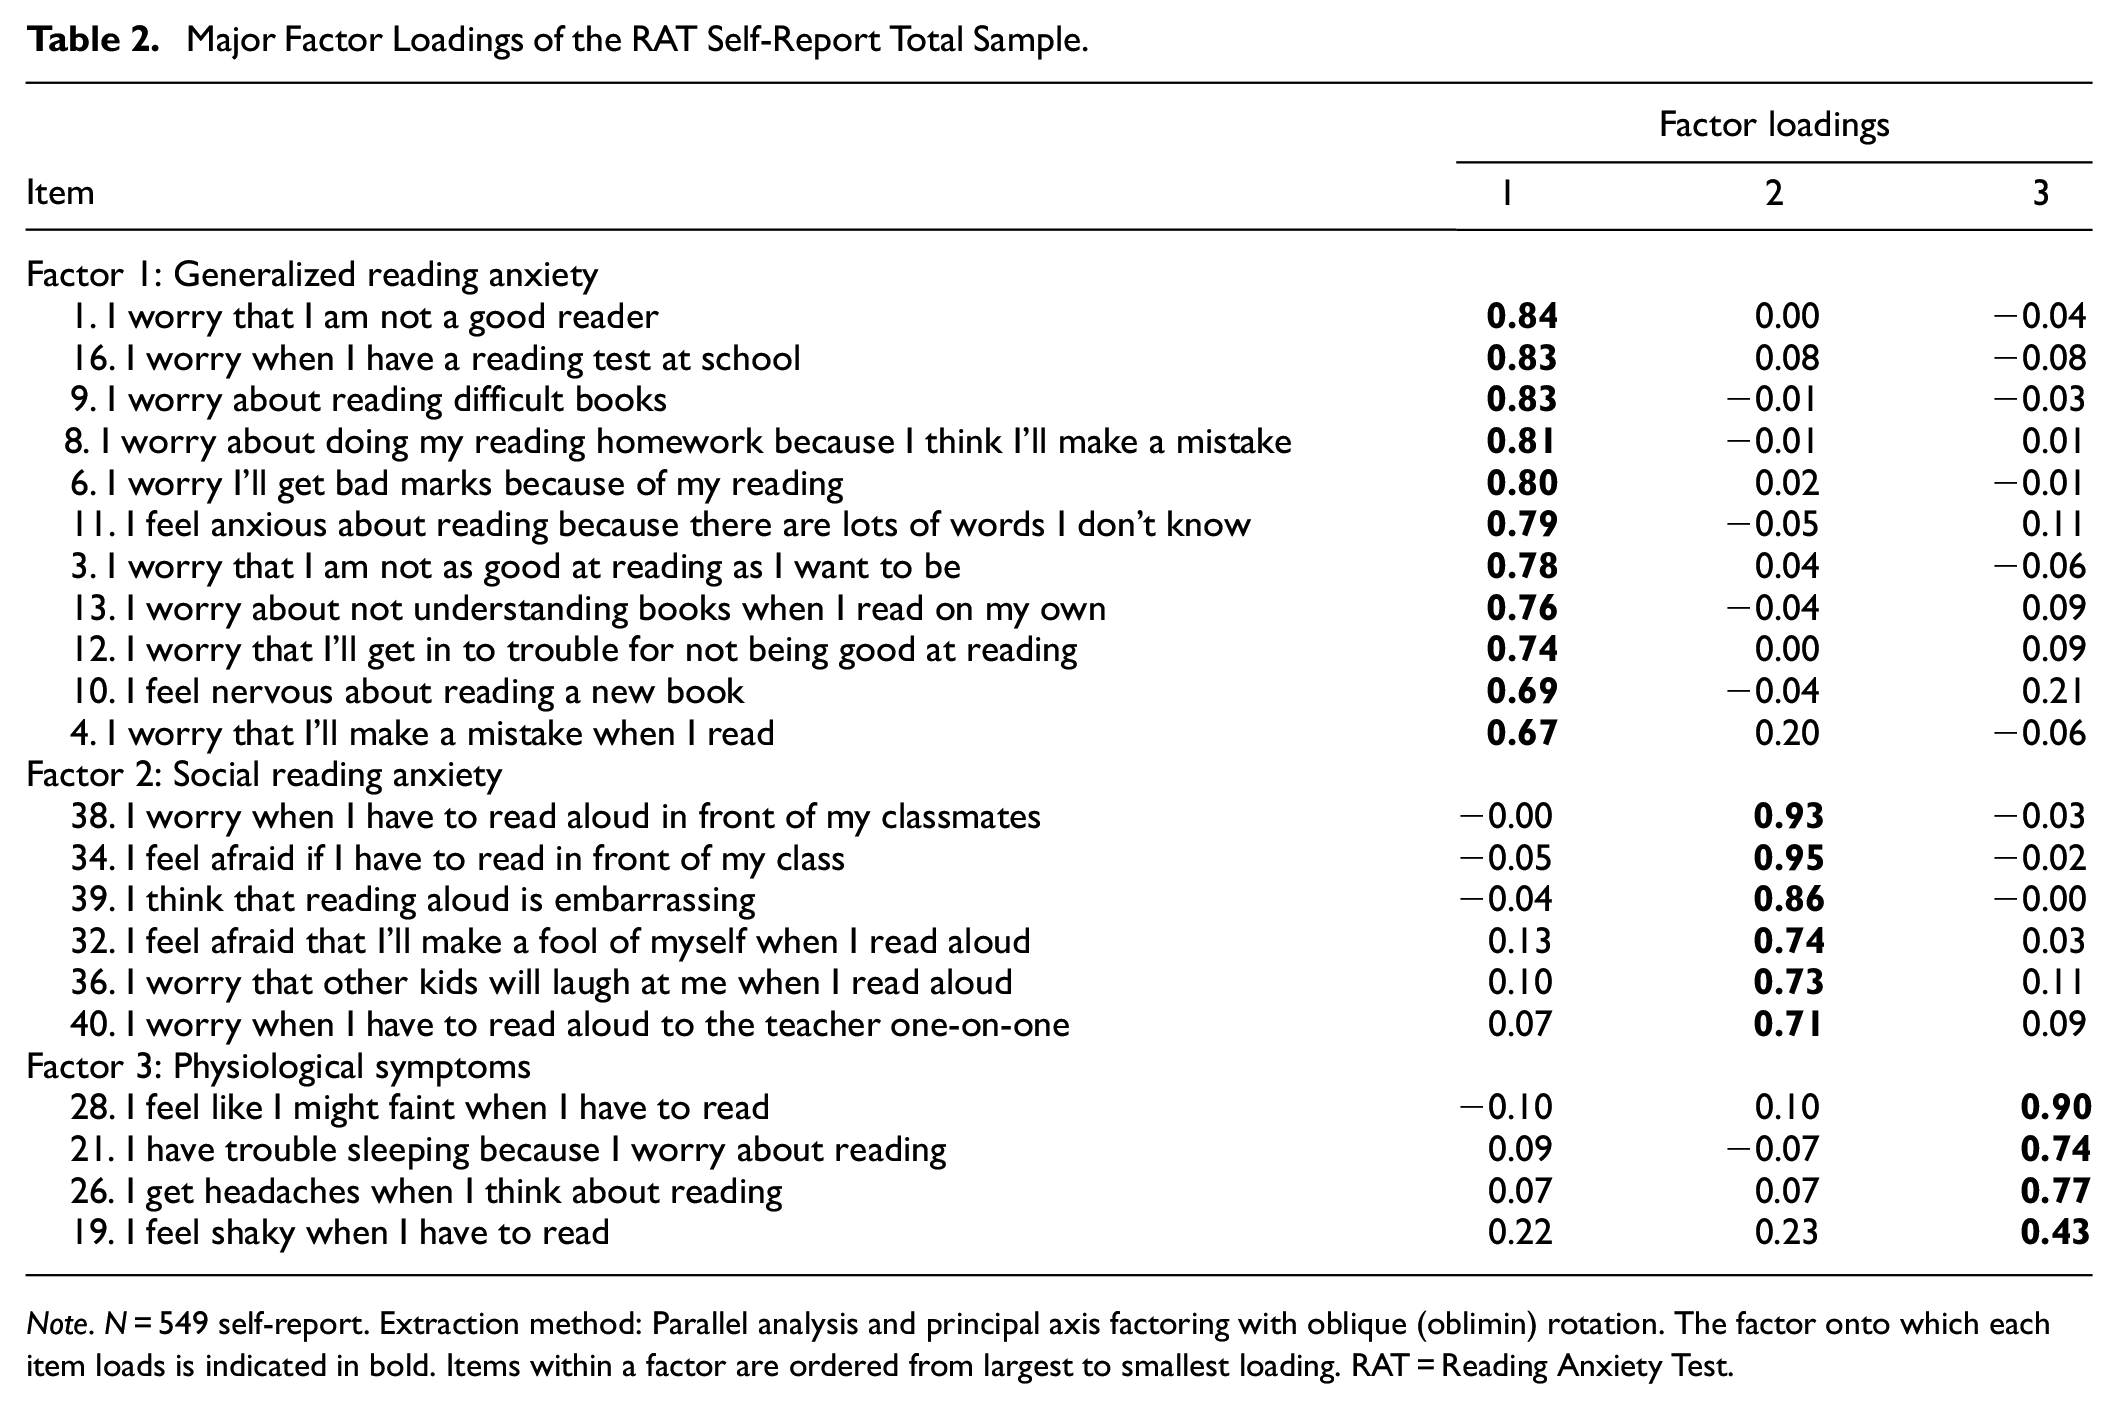
Note. N = 549 self-report. Extraction method: Parallel analysis and principal axis factoring with oblique (oblimin) rotation. The factor onto which each item loads is indicated in bold. Items within a factor are ordered from largest to smallest loading. RAT = Reading Anxiety Test.
Correlations Between Factors Parent Report Total Sample.
Correlations Between Factors Self-Report Total Sample.
Confirmatory Factor Analyses
We randomly split the total sample 10 times to fit a CFA for the parent and self-report forms of the 21-item RAT. This was done to avoid overfitting the model but also to identify any major variations across subsamples. Model fit was similar for both parent: N = 299–309; RMSEA = 0.086–0.102; CFI = 0.910–0.935; TLI = 0.899–0.927; SRMR = 0.047–0.056; and self-report: N = 276–287; RMSEA = 0.084–0.101; CFI = 0.895–0.926; TLI = 0.882–0.917; SRMR = 0.051–0.068 (see Supplemental Material). Multigroup CFA was then performed to assess the validity of the factor structure on children and adolescents separately. Considering children, the model fit for parent-report: N = 314; RMSEA = 0.091; CFI = 0.926; TLI = 0.916; SRMR = 0.058 was better than for self-report: N = 243; RMSEA = 0.095; CFI = 0.897; TLI = 0.884; SRMR = 0.054. Regarding adolescents, the model fit was comparable for both parent-report: N = 222; RMSEA = 0.103; CFI = 0.925; TLI = 0.915; SRMR = 0.047, and self-report: N = 298; RMSEA = 0.093; CFI = 0.924; TLI = 0.914; SRMR = 0.058. While the goodness-of-fit indices was generally adequate (CFI > 0.90, TLI > 0.90, SRMR < 0.08), RMSEA values did not meet the standard for good fit (<.08). Consequently, we inspected the items, residuals, and modification indices (e.g., additional covariances, and allowing cross-loadings) to improve the model. We found no consistent pattern across the measures that improved the RMSEA values, so we discuss this below as a limitation.
Aim 2: Assessing Reliability (i.e., Internal Consistency and Interrater Reliability)
Once the internal structure of the tests was established, we used Cronbach’s alpha and McDonald’s omega as evidence for internal consistency. The values ranged from 0.85 to 0.98 across the total sample and within all subsamples: child sample, adolescent sample, self-report sample, and parent-report sample (see Table 5). Thus, this form of evidence for test reliability was considered very good.
Cronbach’s Alpha of the RAT.
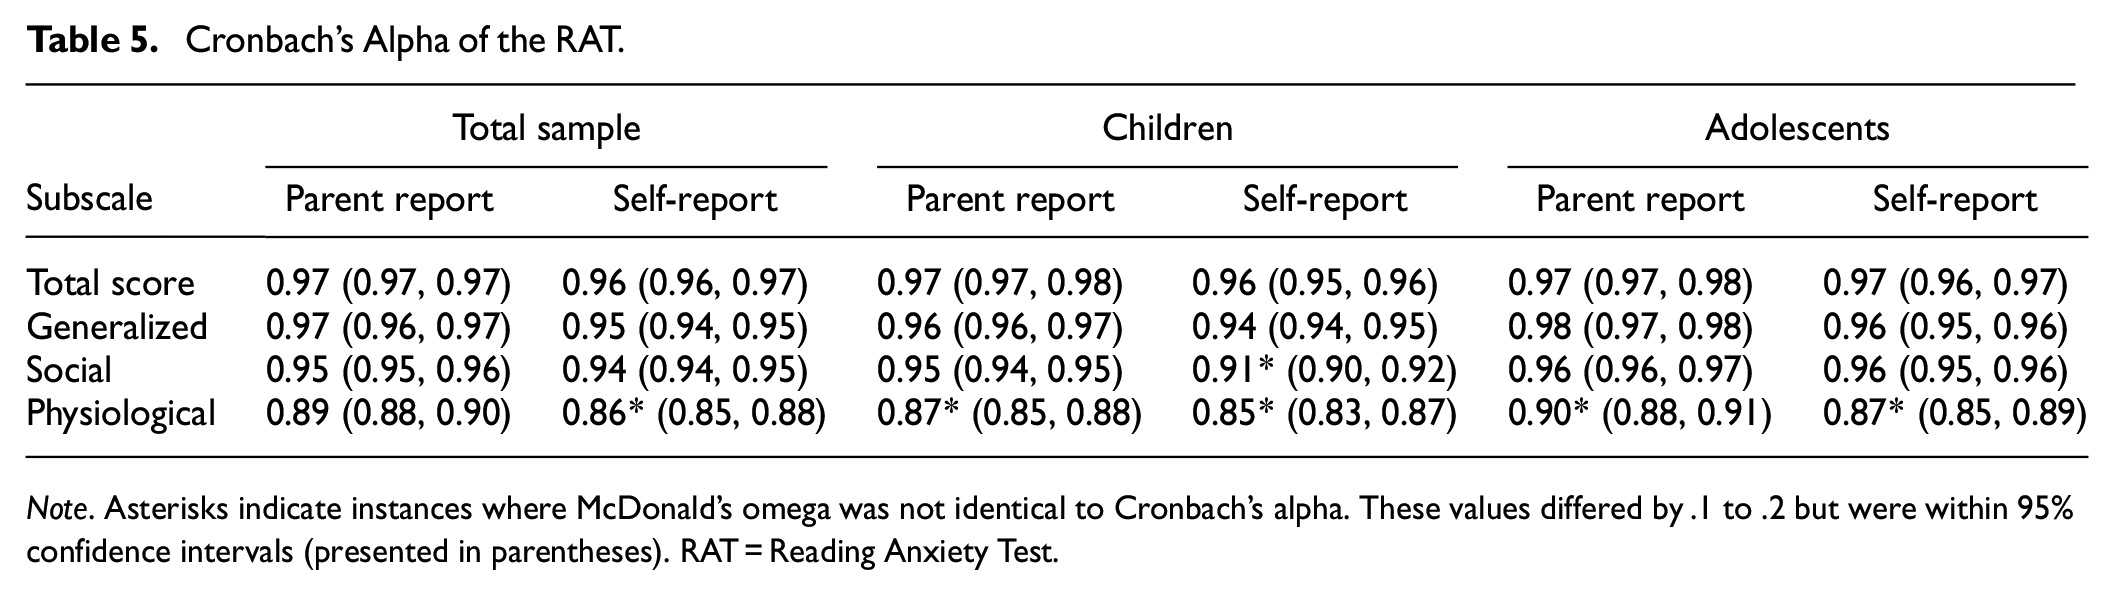
Note. Asterisks indicate instances where McDonald’s omega was not identical to Cronbach’s alpha. These values differed by .1 to .2 but were within 95% confidence intervals (presented in parentheses). RAT = Reading Anxiety Test.
We also assessed the interrater reliability of the RATs using ICCs between self- and parent-report scores for students with both types of scores. Across the total sample, the average ICCs ranged from r = .82 to .90 (n = 141–151). For children, they ranged from .73 to .88 (n = 76–83), and for adolescents they ranged from .90 to .95 (n = 60–62; see Table 6). Thus, this form of evidence for test reliability was also deemed very good.
Average Intraclass Correlations.
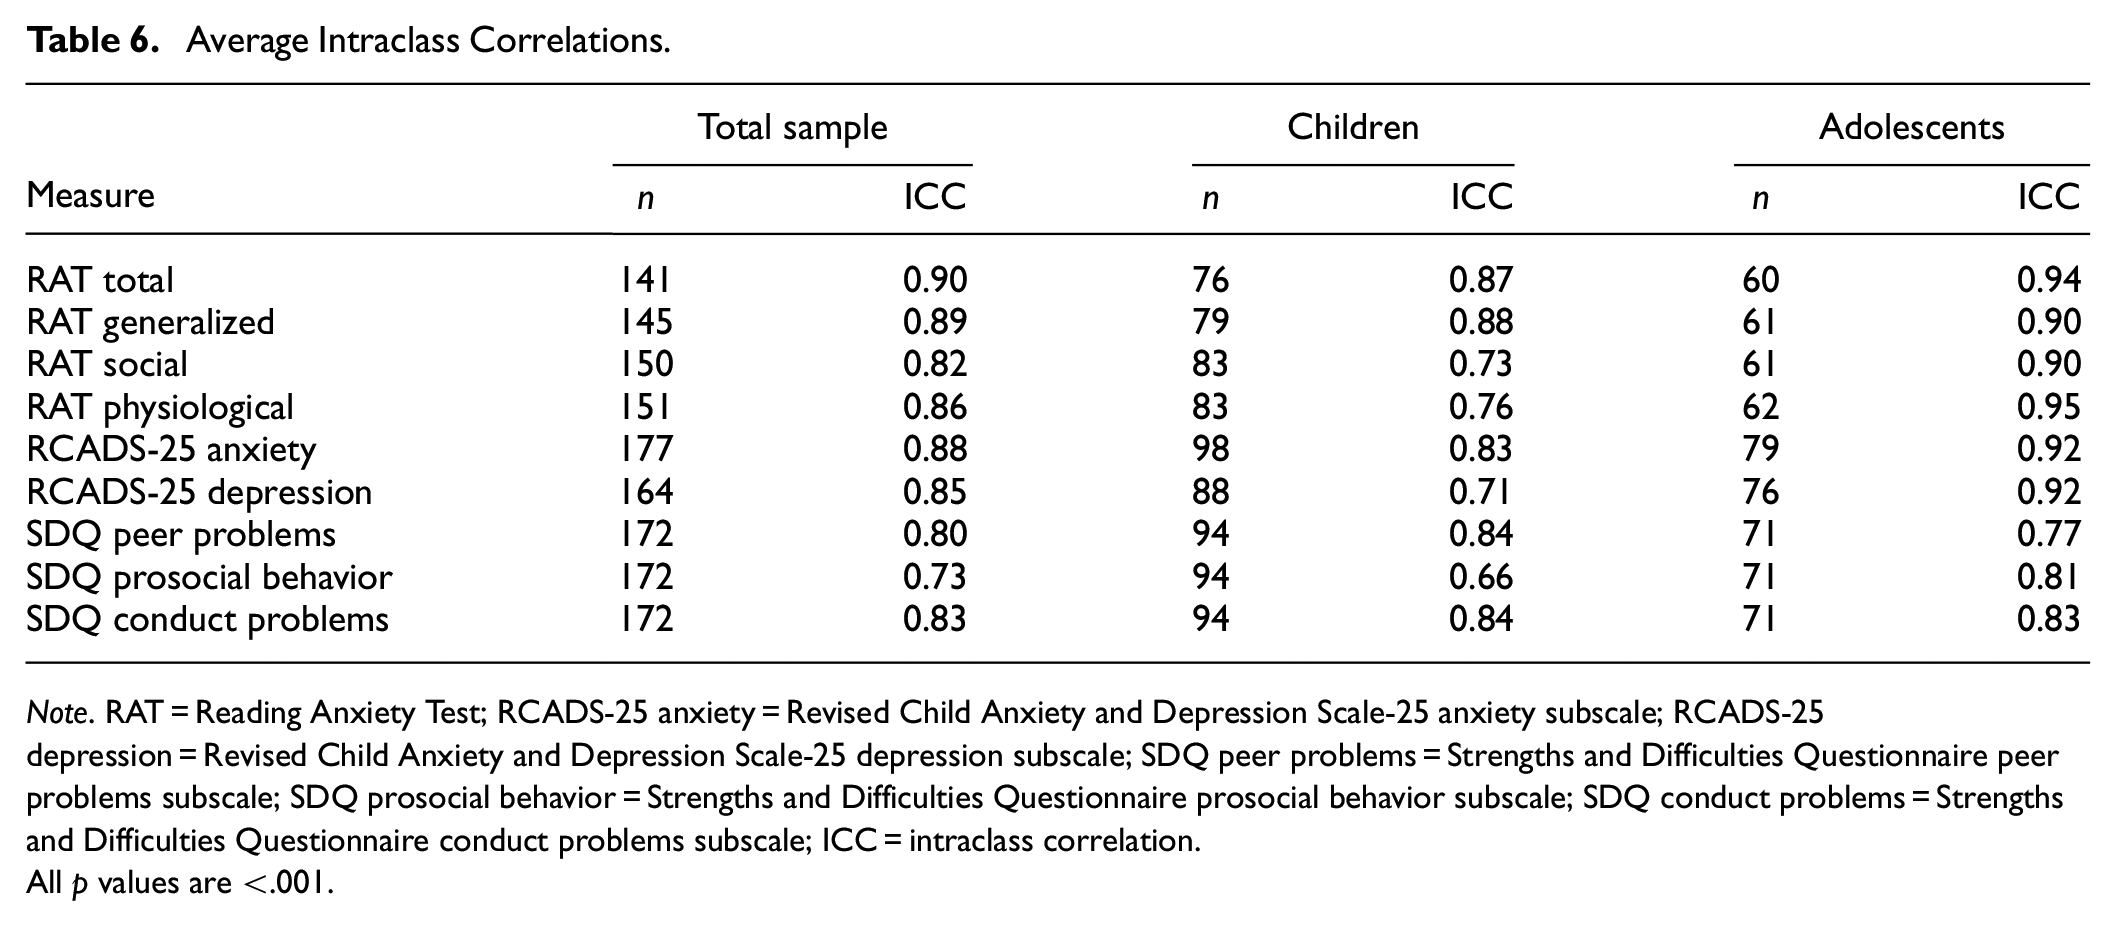
Note. RAT = Reading Anxiety Test; RCADS-25 anxiety = Revised Child Anxiety and Depression Scale-25 anxiety subscale; RCADS-25 depression = Revised Child Anxiety and Depression Scale-25 depression subscale; SDQ peer problems = Strengths and Difficulties Questionnaire peer problems subscale; SDQ prosocial behavior = Strengths and Difficulties Questionnaire prosocial behavior subscale; SDQ conduct problems = Strengths and Difficulties Questionnaire conduct problems subscale; ICC = intraclass correlation.
All p values are <.001.
Aim 3: Assess Validity (Convergent and Discriminant)
To assess convergent validity, we calculated Pearson correlation coefficients between RAT total scores and RCADS-25 anxiety subscale scores across the whole sample and for self- and parent-report data for children and adolescents. These were all large, positive, and statistically significant (rs = .52 to .60; see Table 7).
Pearson Correlations for Parent and Self-Report Data.

Note. RAT total = Reading Anxiety Test total score; Anxiety = Revised Child Anxiety and Depression Scale-25 anxiety subscale; Depression = Revised Child Anxiety and Depression Scale-25 depression subscale; Peer problems = Strengths and Difficulties Questionnaire (SDQ) peer problems subscale; Prosocial behavior = Strengths and Difficulties Questionnaire (SDQ) prosocial subscale; Conduct = Strengths and Difficulties Questionnaire (SDQ) conduct problems subscale.
p < .05. **p < .001.
To assess discriminant validity, we calculated Fisher’s r to z transformations between total scores on the RATs and (a) the RCADS-25 depression subscales, (b) the SDQ peer problems subscale, (c) the SDQ prosocial behavior subscale, and (d) the SDQ conduct problem subscale (see Table 8). We did this across the whole sample and for subsamples (i.e., children and adolescents; self-report and parent report). The correlations between RAT total scores and the RCADS-25 depression subscale and SDQ subscales were very similar for each sample: depression (.35 to .54), peer problems (.37 to .45), prosocial behavior (−.14 to .03), conduct problems (.32 to .39). All these correlations were significantly smaller than the correlations between RAT total scores and the RCADS-25 anxiety subscale except for RCADS-25 depression parent-report scores. This is probably because the latter was so highly correlated with parent-report RCADS-25 anxiety scores (.78), which has been found to be weaker in a previous study (.64; Klaufus et al. 2020). Thus, the RCADS-25 depression subscale was a poorer measure of discriminant validity than the SDQ subscales.
Discriminant Validity of the RAT for Parent and Self-Report Data.
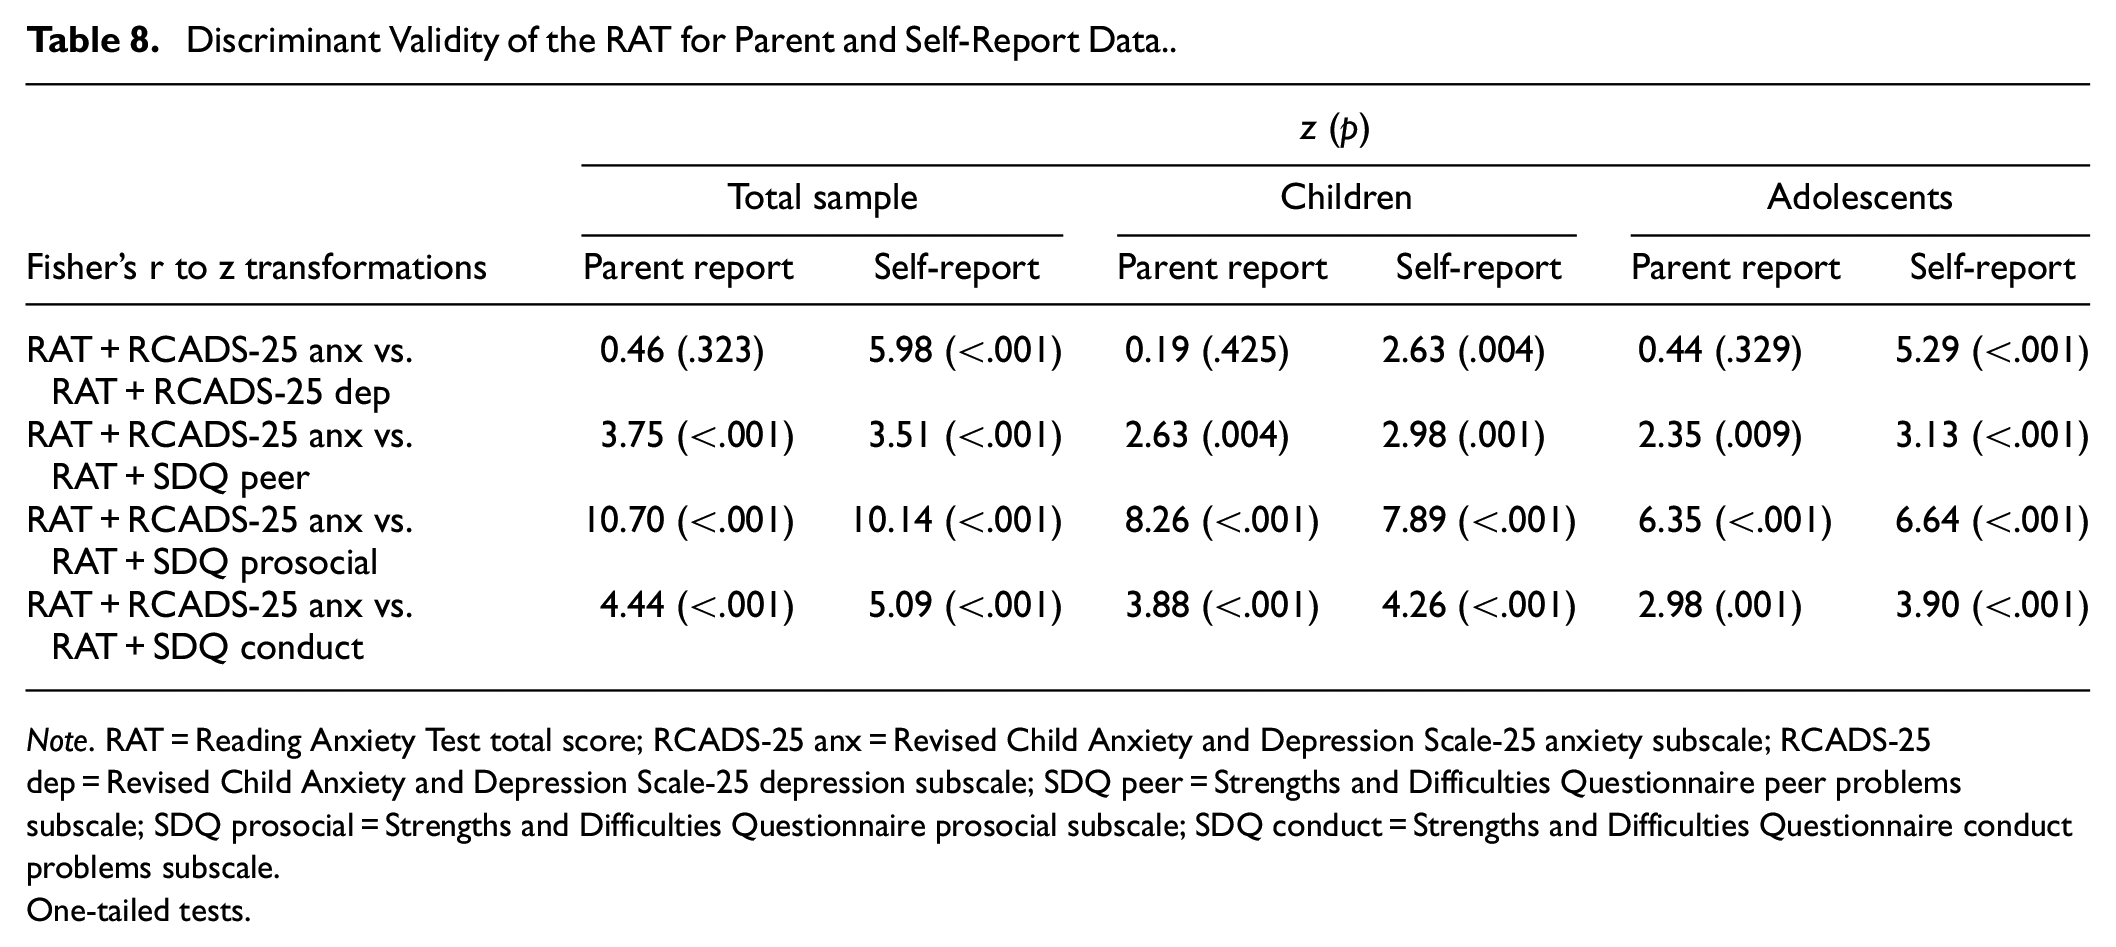
Note. RAT = Reading Anxiety Test total score; RCADS-25 anx = Revised Child Anxiety and Depression Scale-25 anxiety subscale; RCADS-25 dep = Revised Child Anxiety and Depression Scale-25 depression subscale; SDQ peer = Strengths and Difficulties Questionnaire peer problems subscale; SDQ prosocial = Strengths and Difficulties Questionnaire prosocial subscale; SDQ conduct = Strengths and Difficulties Questionnaire conduct problems subscale.
One-tailed tests.
Aim 4: Calculate Norms
In our overall sample of 1,055 young people, 84 had irreconcilable ages and grades (e.g., an individual who reported an age of 13 years and school grade of Grade 3) and were therefore unable to be accurately classified as a primary or secondary school student. This left us with 498 primary school students and 473 secondary school students. From these participants, we created norms for the RAT, which can be found at www.motif.org.au/rat.
Adolescence is a time during which mental health symptoms and disorders such as anxiety, increase (Rapee et al., 2019). Mann–Whitney U tests indicated that there were significant differences between children and adolescents for self-reported total reading anxiety (z = −2.82, p = .005), social reading anxiety (z = −3.34, p = .001), and physiological reading anxiety (z = −2.48, p = .013). This was supported by visual inspection of scatterplots, which suggested that reading anxiety, and specifically social reading anxiety, increases with age in adolescence. Using the same set of norms for children and adolescents would lead to an over-diagnosis in older kids, and a failure to recognize elevated symptoms in younger children. Thus, we decided to create separate norms for children and adolescents to allow for a more accurate assessment.
Discussion
The overarching goal of this study was to further develop four standardized RATs with strong test content that were designed for students in primary school and secondary school and their respective parents. To this end, for each test, we (a) assessed and modified the internal structure (i.e., factors and items), (b) assessed its reliability (i.e., internal consistency and interrater reliability), (c) measured its validity (i.e., convergent and discriminant validity), and then (d) calculated norms.
Regarding the first aim, the exploratory factor analyses identified 21 items that aligned with three factors in each test: generalized reading anxiety (n = 11 items), social reading anxiety, (n = 6 items), and physiological symptoms (n = 4 items). According to the Diagnostic and Statistical Manual of Mental Disorders (DSM-5-TR; APA, 2022), generalized anxiety disorder in childhood is often associated with excessive worry over competence and performance, and social anxiety involves anxiety or fear in environments where the individual may be evaluated by others (APA, 2022). The remaining four items loaded on the physiological symptoms factor, two of which assessed symptoms experienced while actually reading (“I feel shaky when I have to read”; “I feel like I might faint when I have to read”) and two which focused on anticipating reading (“I get headaches when I think about reading”; “I have trouble sleeping because I worry about reading”).
We know of just one other RAS that has multiple factors. This is Zbornik and Wallbrown’s (1991) RAS with its subscales for fear of curiosity, fear of aggression, and fear of independence. These factors differ from those in the RATs most likely due to differences in test content between the two tests. Specifically, the RAS included three items assessing any emotion relating to reading, while the RATs included 21 items that assess anxieties specifically relating to reading. It is noteworthy that the number of RAT items that focus on reading-related anxiety symptoms is notably higher than other RASs that have published their items (around 3–8 items).
The second aim of this study was to assess the reliability of the RATs. This was partly tested using Cronbach’s alpha and McDonald’s omega to assess internal consistency, which proved to be very good for each RAT (i.e., .85 to .98) and aligns nicely with internal consistency statistics reported by Katzir et al. (2018; .83), Ramirez et al. 2019; .86), Pollack et al. (2021; .84), and Sasanguie et al. (2024; .92). The RAT statistics are somewhat higher than those reported by Barber et al. (2022; .73) and Macdonald et al. (2021; .77) for their RASs.
We also assessed reliability using ICCs between self- and parent-report RAT total scores for a subset of students who had scores for both. Across the whole sample, and for children and adolescents separately, the ICCs were high, which suggested good agreement between parents and children (see Table 6). Interestingly, this positive outcome does not align with the position that self- and parent ratings usually correlate poorly for anxiety questionnaires (De Los Reyes, 2011). This encouraging result could be related to the nature of anxiety assessed by the RATs (i.e., anxiety in the context of reading may be more readily observed by both parents and children), resulting in responses that are more aligned. Another potential explanation is that perhaps the “laser-focus” of the RATs on a very specific type of anxiety constrained the interpretation of the meaning of items between respondents, which reduced variance arising from alternative interpretations. More research is needed to determine if this positive finding is reliable.
The third aim of this study was to assess two types of validity—convergent and discriminant—for each of the RATs. Convergent validity was assessed using Pearson correlations between RAT total scores and RCADS-25 anxiety subscale scores for self- and parent-report data for children and adolescents. All coefficients were large and statistically significant, aligning with the moderate-to-strong correlations reported by previous studies between scores for reading anxiety and other types of anxiety (Fishstrom et al., 2024; Macdonald et al., 2021; Sasanguie et al., 2024; Zbornik & Wallbrown, 1991).
Regarding discriminant validity, the correlations between self- and parent-report RAT total scores and SDQ scores for peer problems, prosocial behavior, and conduct problems were significantly lower (−.14 to .45) than those between the RAT and RCADS-25 anxiety scores (.52–.60). The same was true for self-report scores between the RAT and RCADS-25 depression scores. Considered together, this pattern of findings suggests that the RAT is more a measure of anxiety than depression, social, or behavioral problems, which is evidence for good discriminant validity for the RATs.
Given we found good evidence for internal consistency (a measure of reliability) and convergent and discriminant validity, it was appropriate to address a fourth aim in this study, which was to calculate norms for the RATs. These can be viewed in the Supplemental Material and in a free PDF version on motif.org.au. The latter also included a paid version with automated scoring and distribution that can be used for research and clinical purposes.
Limitations and Future Directions
There are some limitations of the current study to be noted. The first of these is the absence of a validated measure of reading ability. Consequently, we do not know the reading ability of our sample and cannot draw any conclusions regarding the relationship between reading ability and reading anxiety. This is an important area for future study as there is evidence that poor reading is significantly associated with internalizing symptoms, including anxiety (Francis et al., 2019).
The generalizability of our findings is also limited by the demographic characteristics of participants. Four subsamples were recruited to increase the size and diversity of the sample. However, there was an overrepresentation of participants from high socioeconomic backgrounds, as demonstrated by the greatest percentage of participants falling within the 8–10 range of the Index of Relative Socio-Economic Disadvantage decile (Australian Bureau of Statistics, 2016). Lower social class and lower levels of maternal education have been associated with a greater likelihood of reading difficulties (Carroll et al., 2005). Thus, poor readers may be underrepresented in the current sample. Furthermore, over 90% of participants spoke English as their main language at home. It would be beneficial to assess the reliability of these findings in new samples, which include more participants from disadvantaged backgrounds and different cultural and language profiles.
Furthermore, when assessing the model structure, RMSEA values did not meet the standards for good fit (<.08). These values were not consistently improved by modification indices (covariances and cross-loadings). We also did not find consistent issues with individual items or the distribution of residuals. While the other indices (CFI, TLI, SRMR) suggested that the model had adequate fit, we recommend re-testing the model in a new sample. Lower RMSEA values would increase our confidence in the three-factor model.
Clinical and Theoretical Implications
Reading anxiety is rarely assessed, and hence, rarely treated, in practice (either in education settings or clinical settings) despite the significant implications of the absence of treatment both in terms of mental health and educational outcomes. Since its development, the RAT has been implemented in our research and clinical practice (McArthur et al., 2024). In clinical practice, children and their parents complete various mental health measures, which now include the RAT to assess the child’s worries about reading. The RAT can also be used in research to assess relationships between reading ability and reading anxiety, as well as reading anxiety and other mental health constructs.
Conclusion
To date, only eight published studies have provided evidence for the reliability or validity of a reading anxiety assessment. The results of these pioneering studies encourage further exploration of reading anxiety as a valid concept requiring assessment. Building on the findings of these previous studies, the current research assessed and refined the internal structures of four standard RATs. It then assessed the reliability and validity of each test, which were very good. We therefore calculated norms for each RAT, which can be found on motif.org.au in a free PDF or a paid automated app. We hope they will be used by others to help support the mental health of people who struggle with reading.
Supplemental Material
sj-docx-1-asm-10.1177_10731911251327480 – Supplemental material for The Validity and Reliability of the Reading Anxiety Test (RAT) for Children and Adolescents
Supplemental material, sj-docx-1-asm-10.1177_10731911251327480 for The Validity and Reliability of the Reading Anxiety Test (RAT) for Children and Adolescents by Alana Jones, Esther Gandhi, Maddison O’Gradey-Lee, Deanna Francis, Serje Robidoux, Genevieve McArthur and Jennifer L. Hudson in Assessment
Footnotes
Declaration of Conflicting Interests
The authors declared no potential conflicts of interest with respect to the research, authorship, and/or publication of this article.
Funding
The authors disclosed receipt of the following financial support for the research, authorship, and/or publication of this article: This work was supported by an Australian Research Council Discovery Project (ARC DP200102241).
Ethics
This research was approved by the Macquarie University Human Research Ethics Committee (#52021618126362).
Consent to Participate
All participants were given information about the study and consent forms. Participants gave written informed consent via the online survey.
Consent for Publication
Not applicable.
Data Availability
Data collected for this study are available from the corresponding author upon reasonable request.
Supplemental Material
Supplemental material for this article is available online.
References
Supplementary Material
Please find the following supplemental material available below.
For Open Access articles published under a Creative Commons License, all supplemental material carries the same license as the article it is associated with.
For non-Open Access articles published, all supplemental material carries a non-exclusive license, and permission requests for re-use of supplemental material or any part of supplemental material shall be sent directly to the copyright owner as specified in the copyright notice associated with the article.