
Abstract
The present series of studies aimed to develop and provide initial validation of the Ease of Imagery Questionnaire (EIQ)—a measure assessing ease of imaging different positive and negative imagery content reflective of valence and engaging or disengaging in adverse situations. Five studies were conducted to collectively examine the questionnaire’s factor structure and concurrent validity. Study 1 (N = 336) and Study 2 (N = 207) informed the development of 16 items of the EIQ, with a four-factor structure supported in Studies 3 (N = 219), 4 (N = 135), and 5 (N = 184) using confirmatory factor analysis. Study 3 also supported concurrent validity with significant bivariate correlations (p < .05) with the similar Sport Imagery Ability Questionnaire subscales, while studies 4 and 5 demonstrated criterion validity in the EIQ’s prediction of challenge and threat appraisal tendencies, perceived stress, stress mindset, and anxiety and depressive symptoms. Overall, the EIQ demonstrates a replicable four-factor structure and appears to assess ability to image content associated with positive and negative emotions as well as demanding stress-evoking situations.
Imagery is foundational for the preparation of potential future situations and is thus an adaptive ability for human survival (Schacter et al., 2008). At the same time, imagery can contribute to nonadaptive outcomes and emotional disorders (e.g., anxiety and depression; Holmes et al., 2016). One way imagery may contribute to emotional disorders is by leading individuals to anticipate aversive events and, thus, imagery might contribute to conditioned responses being associated with a broader array of stimuli, situations, and contexts than have been directly experienced (Mertens et al., 2020). Following from its assumed causal and maintaining role in emotional disorders, imagery has been identified as a potential target for intervention to help alleviate the burden of those disorders by using imagery to facilitate adaptive ways to regulate negative emotion (Stopa, 2021). Given its proposed role in the development, maintenance, and treatment of emotional disorders, having assessment measures that effectively assess one’s ability to create such images are thus important in the service of seeking to improve outcomes associated with these disorders.
There exists a broad array of components surrounding imagery that can be assessed (Pearson et al., 2013). This focus is grounded within the extant literature via imagery ability influencing the effectiveness of imagery. Specifically, individuals who are more proficient at imagery see greater benefits than their lower-level counterparts, with imagery ability moderating the relationship between imagery use and its intended outcome (Cumming, 2008; Robin et al., 2007; Williams et al., 2013). Greater imagery ability is also related to traits and constructs associated with better coping and wellbeing, such as higher trait self-confidence, more adaptive stress appraisal tendencies (i.e., greater challenge appraisals and lower threat appraisals), more adaptive emotion regulation, and lower trait and state anxiety which is interpreted more positively (Anuar et al., 2016; Quinton et al., 2018; Williams & Cumming, 2013, 2016; Williams et al., 2021). Therefore, it is imperative to have access to measures that can validly and reliably assess components of imagery ability related to these behaviors (i.e., valence and situational engagement/disengagement).
Imagery ability has previously been defined as “an individual’s capability to form vivid, controllable images and retain them for a sufficient time to effect the desired imagery rehearsal” (Morris, 1997, p. 37). The imagery process is proposed to consist of image generation/formation, inspection, transformation, and maintenance (Kosslyn, 1994). As such, imagery ability is thought to be reflected by any number of characteristics that represent an individual’s capacity to perform these different parts of the imagery process (Williams & Cumming, 2011). Ease and vividness are two dimensions that are frequently assessed to reflect imagery ability. Ease of imaging typically refers to the extent to which an individual is readily able to image a scenario (Williams & Cumming, 2011). Imagery vividness refers to the clarity or richness of the image generated (Williams & Cumming, 2011). While both these dimensions are proposed to be reflective of the imagery process (i.e., image formation, maintenance, and transformation; Roberts et al., 2008), they have been conceptualized as different characteristics of imagery ability. For example, one may be able to generate a vivid image, but this may be somewhat hard to do. Alternatively, an individual may be able to image a scenario with relative ease, but the image may not be very vivid.
One of the most common and effective ways to assess imagery ability is via validated self-report questionnaires (see Suica et al., 2022, for a full-length review), with ease and vividness being the two main dimensions of imagery ability assessed. While ease and vividness are distinctive imagery ability dimensions, previous research has suggested that it can be challenging for questionnaires to distinguish between them with reported correlations between the two constructs as high as .74 to .88 (Williams & Cumming, 2011). As such, ease or vividness is typically used when assessing imagery ability using self-report questionnaires given difficulties for respondents to distinguish between these facets. For example the Vividness of Visual Imagery Questionnaire (VVIQ; Marks, 1973), Vividness of Movement Imagery Questionnaire (VMIQ; Isaac et al., 1986) and its revised version (VMIQ-2; Roberts et al., 2008), as well as the Plymouth Sensory Imagery Questionnaire (Psi-Q; Andrade et al., 2014) assess vividness, while the Movement Imagery Questionnaire (MIQ; Hall & Pongrac, 1983) and its revised versions (MIQ-R and MIQ-3; Hall & Martin, 1997; Williams et al., 2012), and the Sport Imagery Ability Questionnaire (SIAQ; Williams & Cumming, 2011) assess ease of imaging.
The majority of imagery ability questionnaires assess visual imagery or visual and kinesthetic imagery of basic movements, despite imagery being frequently used in clinical settings to regulate negative emotion and treat emotional disorders (Stopa, 2021). Imagery ability differs depending on the content (i.e., just because someone is proficient at imaging themselves performing a movement does not automatically mean they will be able to image feelings and emotions; see Hall, 1998). Consequently, in domains where emotional or valance-based imagery is the main focus, questionnaires assessing imagery ability of emotional content are likely to be more relevant.
To date, there are very few questionnaires that assess imagery ability of valance-based imagery content. The Dutch Imagery Survey (DImS; van den Berg et al., 2020) and the Emotional Imagery Scale (Guy & McCarter, 1978) are two. However, they lack extensive validation, and the DImS was not specifically developed as an assessment of imagery ability per se. More extensively validated questionnaires that assess valence-based content are the Psi-Q and SIAQ. The Psi-Q assesses vividness of five emotional feelings as well as other sensory modalities (vision, sound, smell, taste, touch, and bodily sensation), while the SIAQ is a sport-specific measure assessing athletes’ ease of imaging feelings and emotions associated with their sport in addition to skills, strategies, goals, and mastering difficult situations. Since their inceptions, both measures have been used widely. In a recent review of existing imagery ability assessment measures, the SIAQ is one of two existing measures to be rated as having sufficient evidence supportive of its psychometric properties (Suica et al., 2022).
Despite measuring valance-based imagery, both the SIAQ and PiSQ are limited in how they assess valence of imagery. The SIAQ only assesses positive valence or positive emotion, whereas the PiSQ combines positively valenced (e.g., excited, in love) and negative valenced (e.g., furious, scared) emotion into the same composite (i.e., “Feeling”). The ability to separately assess positively versus negatively valenced imagery is important. In clinical settings, individuals are likely to experience images of negative feelings and emotions, and their ability to image such negative content is likely to impact the effect the imagery has on them. For example, intrusive memories in the form of images are associated with a variety of negative emotions, such as anger and sadness, and tend to be vivid and distressing (Birrer et al., 2007; Patel et al., 2007; Reynolds & Brewin, 1999). In addition, negative intrusive images are one of the strongest predictors of depression (Williams & Moulds, 2008) and cognitive theories of emotion (Holmes & Mathews, 2010) propose that negative images contribute to the maintenance of emotional disorders (McEvoy et al., 2015). Assessing the ability to image negatively valanced imagery would therefore seem just as important as assessing positively valanced content to help anticipate the effects these different images may have on an individual.
In clinical settings, due to its ability to evoke emotion, imagery is regularly used as part of treatment for things such as (but not limited to) fears, phobias, posttraumatic stress disorder (PTSD), worry, anxiety, and depressive disorders (see Holmes & Mathews, 2010). Techniques such as “imagery rescripting” (i.e., modifying the content of emotion evoking imagery) have been employed in the treatment of disorders such as PTSD and phobias (e.g., Arntz & Weertman, 1999; Holmes et al., 2007; Hunt & Fenton, 2007). Guided imagery enables the individual to image themselves continuing and persevering in a situation they may find difficult or even triggering. This use of imagery may be particularly relevant in the clinical setting where the individual can first expose themselves to the situation in a safer space through the use of imagery (Abramowitz et al., 2019). However, an individual’s ability to generate images of themselves persevering (or alternatively giving up) has not been adequately assessed. Measuring this ability at baseline would provide informative data for the guided imagery sessions to know if patients need assistance in developing the ability to generate images of themselves persevering. For example, one individual with agoraphobia may be able to imagine themselves in a busy shopping mall, but may be able to imagine themselves continuing to walk toward the store even though they find it difficult and are experiencing intense negative feelings and emotions. Whereas another individual with agoraphobia may be able to imagine themselves in a busy shopping mall, but may instantly imagine themselves giving up when they are experiencing negative feelings and emotions. While imagery is an incredibly powerful tool used for treatments such as exposure therapies (Abramowitz et al., 2019), the ability to image preserving in difficult situations (along with images of feelings and emotions) is likely to determine the effectiveness of such imagery treatments. It is therefore important that questionnaires can assess imagery ability of such content.
The SIAQ (in addition to assessing positive affect) is the only questionnaire that currently assesses content reflective of persevering in adverse situations (referred to as the mastery subscale). However, while the item wording does not refer to sport and may thus may potentially be applied to non-sport-specific scenarios (e.g., the item “remaining confident in a difficult situation” could be used in relation to situations beyond sport), the questionnaire was not intended for use in nonathlete samples and is not validated in nonathlete samples. In addition, similar to the valance-based SIAQ subscale, all items refer to positive imagery content (i.e., items are reflective of persevering and not giving up in the face of adversity).
Previous research has suggested the importance of assessing ease of imaging positive and negative valance-based imagery as well imagery of persevering and giving up in difficult situations due to their associations with dispositions associated with emotional disorders and how stress is appraised. Specifically, Quinton et al. (2018) modified the mastery and affect subscales of the SIAQ to create negatively worded subscales, and then examined how athletes’ imagery ability of sport-specific positive and negative affect and mastery content related to stress appraisals and anxiety. Results showed that higher positive affect and mastery imagery ability predicted greater challenge appraisal tendencies, while higher negative affect and negative mastery imagery were both associated with greater threat appraisals. Negative affect imagery was also associated with lower challenge appraisals. Although these negative subscales were not validated, the findings highlight the importance that imagery ability of positive and negative valanced-based images as well as imagery of persevering or giving up in difficult situation may have on dispositions such as anxiety and adaptive and maladaptive stress appraisals.
With the above in mind, the aim of the present series of studies was to create a comprehensive measure of imagery ability to assess the ability to image valance-based images and images of persevering and giving up in demanding situations. The Ease of Imagery Questionnaire (EIQ) was designed to differ from existing imagery questionnaires by (a) assessing images of feelings and emotions and perseverance (or lack of) in demanding situations rather than generic visual images or movements, (b) assessing this content in a nonathlete population, and (c) simultaneously measuring positive and negative images to allow for the examination and direct comparisons of the same sort of imagery content. Five studies were conducted which collectively developed the EIQ item pool and then examined the content, construct (including structural, convergent, and discriminant), and criterion validity of item scores. The data files for the studies can be accessed here: https://doi.org/10.25500/edata.bham.00001115.
Study 1
The aim of Study 1 and Study 2 was to establish an initial pool of items to form the basis of the EIQ for further examination in the subsequent studies. For Study 1, expert opinion was obtained to show content validity by identifying the representativeness and quality of the developed items. A combination of descriptive statistics and structural validity analyses (the extent to which the questionnaire scores adequately reflect the dimensions of the construct to be measured; Mokkink et al., 2010) were used to inform item pool refinement.
Method
Instrument Development
The pool of initial items was drawn from items employed in the SIAQ (Williams & Cumming, 2011) which assesses ease of imaging content in relation to sport. Specifically, the three items from the SIAQ’s affect subscale and three items from the SIAQ’s mastery subscale were employed to reflect the ability to image positive feelings and emotions, and persevering and not giving up in difficult situations. The background and stem of the questionnaire were reworded so that content was in relation to everyday life rather than sport. Additional items were then written to capture similar content thus providing a bigger starting pool of items. To create items associated with negative feelings and emotions and giving up in difficult situations, items were initially based on those developed by Quinton et al. (2018) with some additional items created to provide a larger pool. In total, 24 items were employed.
Content validity of the items was assessed by four researchers, who have experience designing questionnaire items, and six individuals reflective of the general population (i.e., the population the questionnaire is designed for). All 10 individuals were provided with a subscale description and the items, and systematically examined the item wording and content, and indicated the extent they believed each item matched its intended subscale. Ratings were made on a 7-point scale ranging from 1 (poor match) to 7 (excellent match). The Content Validity Index (CVI; Lynn, 1986) was then calculated for each item by dividing the number of people who rated the item as a good match, very good match, or excellent match to a subscale, by the total number of people taking part in the rating exercise (i.e., 10). Only nine items were below the .80 criteria believed to be indicative of a valid item (Lynn, 1986). These potentially problematic items were revised as per suggestions made by the raters and were included in the pilot test. All other items had a CVI ranging between .80 (8/10) and 1 (10/10) and were therefore retained for Study 1.
During Study 1, participants were asked to image each item, then rate “how easy it is for you to image” each item. We decided to proceed with ease of imagery as the indicator of imagery ability (rather than vividness) for three main reasons:
Ease of imaging is the dimension of imagery ability used by the SIAQ—the measure which contains items from which the present questionnaire items were derived.
Ease of imaging is known to moderate the relationship between imagery use and a range of outcomes (e.g., Cumming, 2008; Goss et al., 1986) and has been shown to influence imagery intervention effectiveness (e.g., Robin et al., 2007).
Previous research has found some individuals found it difficult to comprehend what is meant by the “vividness” of an image (Williams & Cumming, 2011).
Ease of imaging ratings were made on the same 7-point scale employed by the SIAQ which ranges from 1 (very hard to image) to 7 (very easy to image).
Participants and Procedure
Following ethical approval at the last author’s institution, a heterogeneous sample of 363 participants were recruited. Participants were recruited through the Department of Psychology’s online subject pool (SONA). All potential participants were provided with an information sheet and had the chance to ask any questions. Those agreeing to take part understood it was voluntary and provided informed consent. Next, participants provided their demographic information and completed the questionnaire using the online platform Qualtrics. Study completion took between 10 and 15 minutes, and data collection ran from September 2020 through December 2020. Participants were given course credit for their participation.
Data Analysis
First data were screened for any missing values before means, standard deviations, skewness, and kurtosis values were calculated for all items and inspected. Next, factor analysis was conducted on the items. Factor analysis considers an underlying structure caused by the latent variables (Costello & Osborne, 2005). Parallel analysis (using O’Connor’s, 2000, macro) was used to determine how many factors to extract from the exploratory factor analysis (EFA). Owing to the SIAQ providing the underlying structure of the questionnaires, principle axis factoring with oblimin rotation was carried out on the data to reduce the 24 items to a number of meaningful factors (Tabachnick & Fidell, 2018). Items were deemed to saliently load on a primary factor if they displayed a factor weighting of at least .50 and were deemed to cross-load on a secondary factor if they possessed a factor weighting of at least .30. Based on the final rotated solution, internal reliability, means, standard deviations, and average interitem correlations for each subscale were calculated.
Results and Discussion
Participant Characteristics
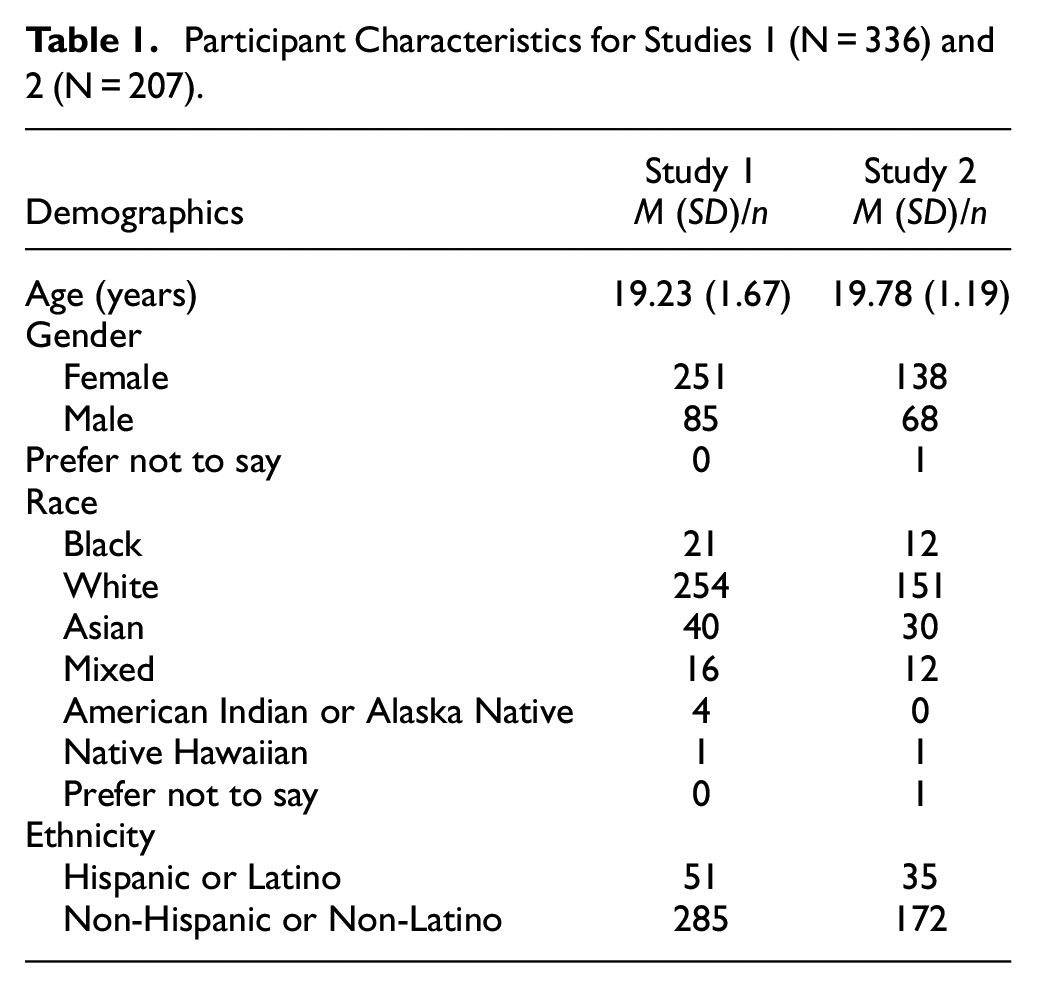
In total, 27 participants were missing multiple questionnaire data, so they were excluded from the analysis leaving a final sample of 336. A breakdown of the participant details can be seen in Table 1.
Participant Characteristics for Studies 1 (N = 336) and 2 (N = 207).
Data Screening and Item Characteristics
A list of all 24 items including their means, standard deviations, skewness, and kurtosis values are reported in Supplementary Table 1. Means ranged from 4.04 to 6.25. As with initial stages of previous questionnaire development (Cumming et al., 2005; Hall et al., 1998; Williams & Cumming, 2011), examination of standard deviations revealed values greater than 1.00 suggesting satisfactory variability. Item skewness and kurtosis values were also distributed within the tolerance levels of normality assumptions.
Principle Axis Factoring
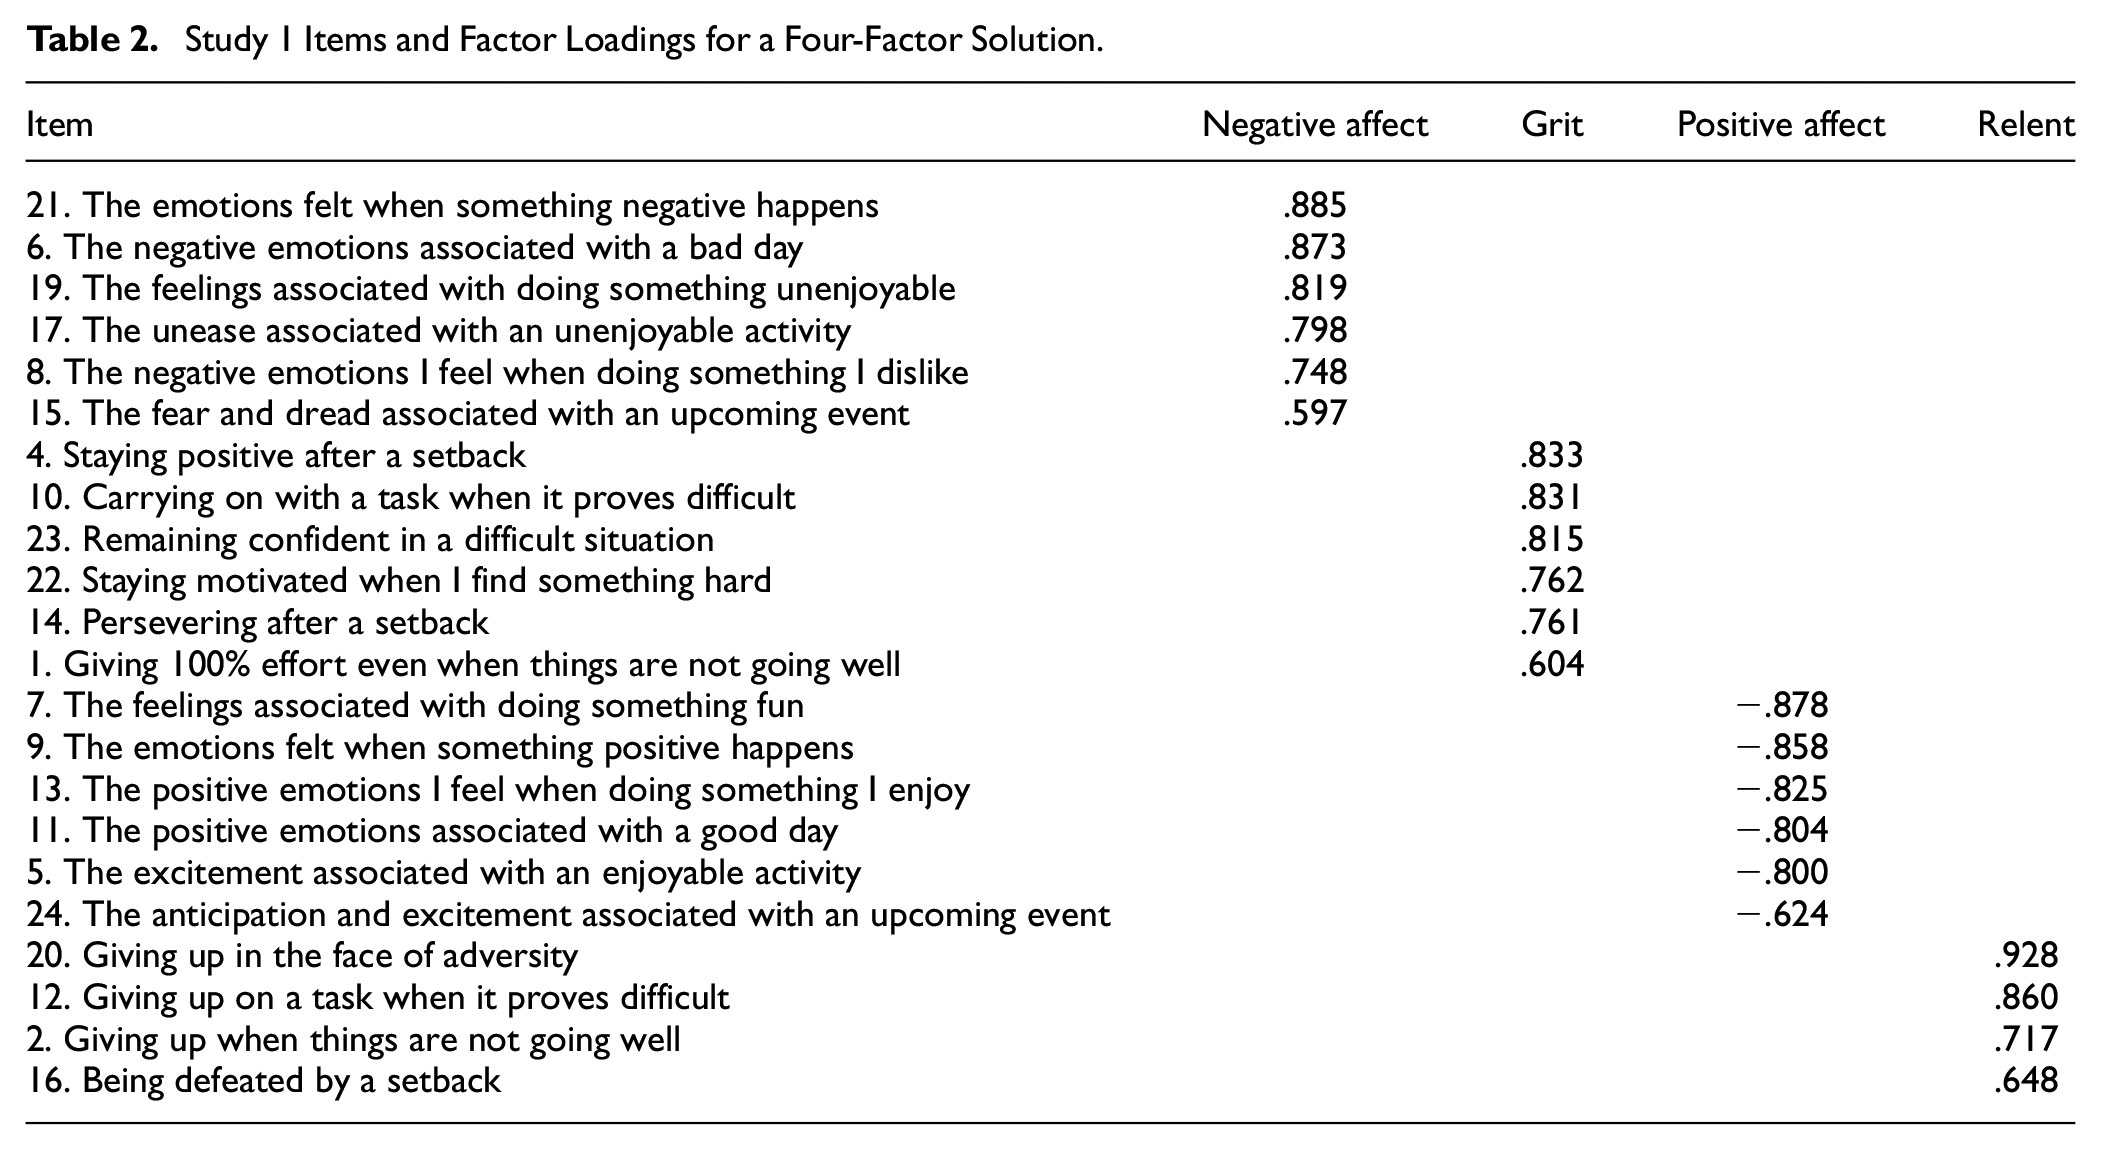
The first four eigenvalues from the EFA were 7.53, 6.27, 1.82, and 1.35 and the first four eigenvalues from parallel analysis were 1.49, 1.41, 1.35, and 1.30. As a result, a four-factor solution was retained. Principle axis factoring with oblimin rotation identified the four factors as, collectively, accounting for 70.68% of the variance. Most items loaded cleanly onto one subscale although two items cross-loaded highly on more than one factor. These were dropped in the second iteration of the analysis which showed eigenvalues of the four subscales ranging from 6.40 to 1.34, with all four above the first four eigenvalues from parallel analysis ranging from 1.46 to 1.28, together accounted for 71.43% of the variance. These four subscales were named negative affect imagery ability, grit imagery ability, positive affect imagery ability, and relent imagery ability. The retained 22 items and their factor loadings are reported in Table 2.
Study 1 Items and Factor Loadings for a Four-Factor Solution.
Internal Consistency, Means, and Standard Deviations
Internal reliability was assessed using composite reliability (CR) and average variance extracted (AVE) due to the limitations associated with Cronbach’s alpha coefficient (see Bentler, 2009; Sijtsma, 2009). The CR and AVE criterion levels were set at .70 and .50, respectively (Hair et al., 1998). All subscales demonstrated adequate CR: negative affect = .91, grit = .90, positive affect = .91, and relent = .87, and AVE: negative affect = .63, grit = .60, positive affect = .64, and relent = .63. The average interitem correlations across the subscales (.60–.66) fell in a range (above .50) to suggest the item content of each subscale is relatively narrow (Clark & Watson, 1995). Subscale means ranged from 4.21 (SD = 1.50) for relent imagery ability to 6.14 (SD = 1.20) for positive affect imagery ability (negative affect imagery ability: M = 5.48, SD = 1.28; grit imagery ability: M = 4.78; SD = 1.21).
Study 1 Summary
Study 1 indicated that the EIQ measures the ability to image four distinct types of imagery content associated with feelings and emotions (positive and negative affect imagery ability) and challenging situations (grit and relent imagery ability). The grit and positive affect subscales are similar in nature to the mastery and affect subscales of the SIAQ respectively, while the relent and negative affect subscales reflect content likely to be associated negative outcomes. However, two items from the relent imagery subscale had cross-loaded, meaning this subscale consisted of less items. In addition, some of the item wording used first person (e.g., “losing motivation when I find something hard”) which did not read as well as the other items which avoided referring to the individual in the first person (e.g., giving up on a task when it proves difficult). These item wording inconsistencies may have explained why some items did not load as well on certain subscales.
Study 2
Study 1 suggested a four-factor structure for the EIQ, but the relent imagery subscale consisted of fewer items. Following the rewording of some existing items and the inclusion of some additional negatively worded items, Study 2 re-examined the item pool using a combination of descriptive statistics and structural validity analyses.
Method
Measures
Ease of Imagery Questionnaire
The questionnaire contained the same items from Study 1 except one item which cross-loaded in Study 1 was removed and the four items which referred to “I” were reworded to be more consistent with the other items (e.g., “Staying motivated when I find something hard” was reworded to “Staying motivated when something is hard”). An additional three items were created. The 26 items administered are displayed in Supplementary Table 2.
Participants and Procedures
Following ethical approval at the university of the last author, a heterogeneous sample of 219 participants were recruited using identical procedures to Study 1. These participants were a different sample than Study 1. Data collection started in January 2021 and ended in May 2021.
Data Analysis
Data were analyzed using the same steps as Study 1.
Results and Discussion
Participant Characteristics
In total, 12 participants were missing multiple questionnaire data so were excluded from the analysis leaving a final sample of 207. A breakdown of the participant details can be seen in Table 1.
Data Screening and Item Characteristics
Means, standard deviations, skewness, and kurtosis values of the 26 items are reported in Supplementary Table 2. Means ranged from 4.02 to 6.01 and standard deviations revealed values greater than 1.00 suggesting satisfactory variability. Similar to Study 1, item skewness and kurtosis values were also distributed within the tolerance levels of normality assumptions.
Principle Axis Factoring
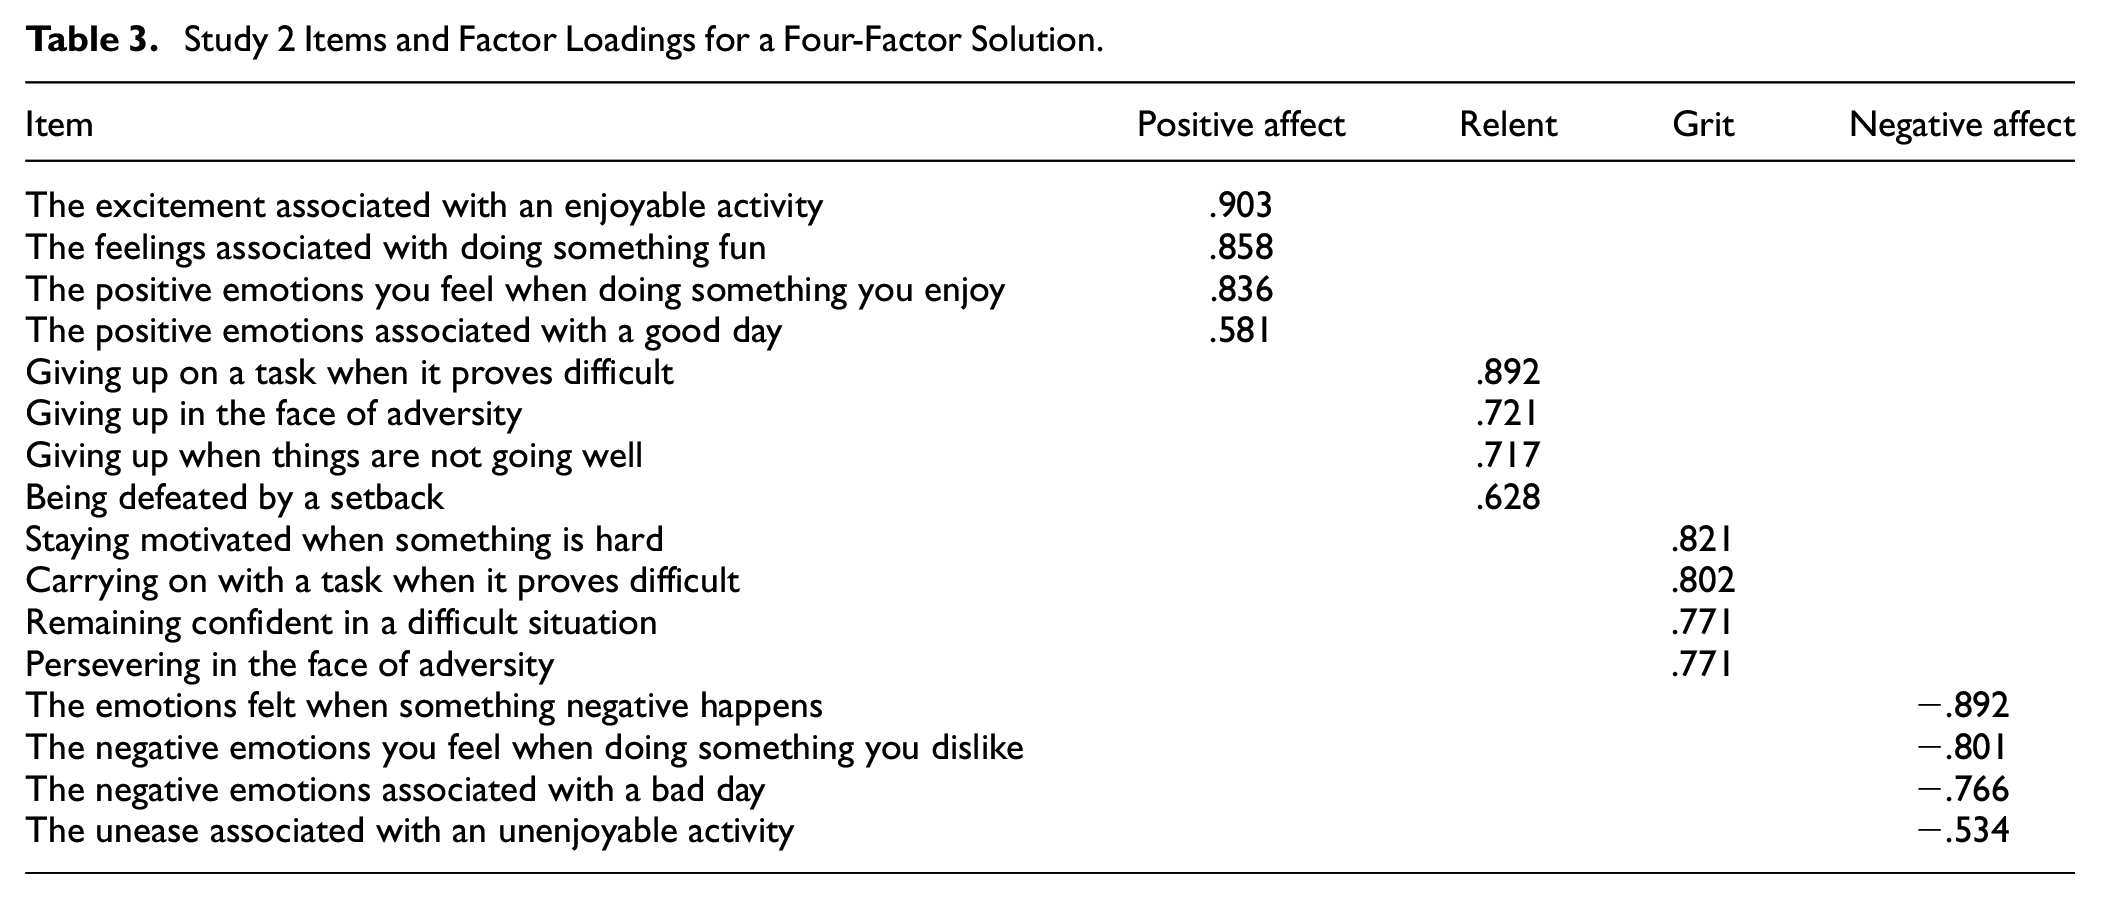
Only the first two observed eigenvalues from the EFA (8.68, 6.15, and 1.48) exceeded the eigenvalues from parallel analysis (1.72, 1.61, and 1.52). Extracting a two-factor solution evidenced a first factor that had item content related to positive affect while the second factor consisted of a mixture of relent content items and negative affect content items. To inform competing measurement models to further consider in structural analyses in subsequent studies, a forced four-factor solution was extracted within the Study 2 EFA to examine comparability to Study 1 EFA findings. The same four factors from Study 1 emerged in Study 2 when extracting an oblique four-factor solution with eigenvalues ranging from 8.68 to 1.22, collectively accounting for 67.39% of the variance. Two items cross-loaded highly on more than one factor and were dropped in the second iteration of the EFA. The second run of the analysis showed eigenvalues of the four subscales ranging from 8.36 to 1.21, together accounting for 67.83% of the variance. The number of items on each subscale ranged from seven to five items, and some items consisted of lower factor loadings. Therefore, these items with the weakest factor loadings were removed so that each subscale consisted of four items. The final run of the retained 16 items yielded eigenvalues ranging from 5.73 to 1.06 and collectively accounted for 73.63% of the variance. Factor weightings ranged from .903 to −.534. The resulting 16 items and their factor loadings are reported in Table 3.
Study 2 Items and Factor Loadings for a Four-Factor Solution.
Internal Consistency, Means, and Standard Deviations
All subscales demonstrated adequate CR (positive affect: .88, grit: .87, negative affect: .84, relent: .83) and AVE (positive affect: .65, grit: .63, negative affect: .58, relent: .56). Subscale means ranged from 4.18 for relent imagery ability (SD = 1.30) to 5.94 for positive affect imagery ability (SD = 1.13) with grit imagery ability (M = 5.00; SD = 1.20) and negative affect imagery ability (M = 5.40; SD = 1.17) in between.
Study 2 Summary
The first two studies identified competing measurement models surrounding the EIQ item scores. Study 1 most strongly supported a four-factor structure, whereas Study 2 most strongly supported a two-factor structure. An item pool of 16 items was retained from Study 2 for further examination in subsequent studies to examine these competing measurement models.
Study 3
Study 3 used confirmatory factor analysis (CFA) to further examine competing two-factor and four-factor measurement models that were informed from Study 1 and Study 2 EFA findings. Using a CFA approach allowed for a direct comparison of competing measurement models. Given the underlying conceptual basis of the EIQ being based upon a four-factor solution, a correlated four-factor model was expected to be most strongly supported in Study 3 and in subsequent studies. We also aimed to demonstrate the substantive aspect of construct validity by examining the association of EIQ scores and those from theoretically associated variables. Specifically, this was done by examining the EIQ concurrent validity by comparing it to the SIAQ which provides valid and reliable measures of affect and mastery imagery ability in relation to sport. Study 3 also examined whether the ability to image differed between the different EIQ subscales.
A priori hypothesized relationships were thought to exist between the EIQ and SIAQ due to both questionnaires measuring ease of imaging affect and mastery (grit/relent)-related content. It was hypothesized that the EIQ-grit and EIQ-positive affect subscales would significantly correlate with the five SIAQ subscales due to all assessing positively worded items. However, it was hypothesized that the strongest correlations would be between EIQ-grit and SIAQ-mastery, and EIQ-positive affect and SIAQ-affect due to these subscales being most similar in imagery content. It was hypothesized that EIQ-relent and EIQ-negative affect would only significantly correlate with the SIAQ-mastery and SIAQ-affect, respectively, due to these being the only subscales that are similar in imagery content. For all the hypothesized relationships, it was expected that these would be small to moderate in size due to the EIQ assessing images related to everyday life while the SIAQ assesses content related to sporting scenarios.
Based on reported significant differences in imagery ability between the affect and mastery subscales of the SIAQ (Williams & Cumming, 2011), it was hypothesized that participants would similarly find it easier to image affect-related content compared to grit and relent content and thus report significantly higher ease of imaging scores for affect imagery compared to grit and relent imagery ability.
Method
Measures
Ease of Imagery Questionnaire
The 16-item EIQ identified in Study 2 was administered assessing the ease with which participants could image grit, relent, positive affect, and negative affect images.
Sport Imagery Ability Questionnaire
The 15-item SIAQ assessed the ability to image five types of imagery athletes experience in relation to sport. The five subscales include: skill (e.g., improving a particular skill), strategy (e.g., creating a new event/game plan), goal (e.g., myself winning), affect (e.g., the positive emotions I feel while doing my sport), and mastery (e.g., giving 100% effort even when things are not going well). Individuals image each item and rate the ease of imaging the scenario on a 7-point scale ranging between 1 (very hard to image) and 7 (very easy to image) before an average score for each subscale is calculated so a higher score reflects a greater ability to image. The SIAQ has been shown to produce valid and reliable imagery ability scores (Williams & Cumming, 2011).
Participants and Procedures
Following ethical approval at the first author’s institution, a new heterogeneous sample of 219 participants completed the study using identical procedures to Study 1 and 2. Data collection started in November 2021 and ended in April 2022.
Data Analysis
A series of confirmatory factor analyses (CFAs) sought to fit the correlated four-factor measurement model and competing measurement models using Mplus 8.3 (Muthén & Muthén, 1998–2019). Given that the EIQ item responses are ordered-categories, mean- and variance-adjusted weighted least squares (WLSMV) estimation was used (Asparouhov, 2005). A model testing the questionnaire’s four-factor solution in which subscales were allowed to correlate (i.e., correlated traits model) was created, and the overall goodness of fit was tested using the chi-square likelihood ratio statistic (χ2; Jöreskog & Sörbom, 1993) as well as the standardized root mean square residual (SRMR; Bentler, 1995) and supplementary incremental fit indices (i.e., Tucker–Lewis Index [TLI], Comparative Fit Index [CFI], or root mean square error of approximation [RMSEA]) based on Hu and Bentler’s (1999) recommendations due to a nonsignificant χ2 value being rarely obtained in practice (MacCallum, 2003). An adequate model fit is indicated by an SRMR value close to 0.08, a CFI and TLI being close to 0.95, and an RMSEA being close to 0.06 (Hu & Bentler, 1999). Finally, standardized factor loadings, standardized residuals, and modification indices were examined to investigate any model misspecification. Mardia’s coefficient (Mardia, 1970) revealed data did not display multivariate normality (Mardia’s multivariate kurtosis = 39.40; normalized estimate = 10.28) so bootstrapping was employed to create multiple subsamples from the original data and examine parameter distributions relative to each of these samples (Byrne, 2010).
The model fit was then compared to three alternate models, one two-factor model consisting of a positive imagery subscale and a negative imagery subscale, a second two-factor model consisting of an affect subscale and an adverse situations subscale (consisting of grit and relent items), and a one-factor model in which all items loaded on the same latent factor. In addition to examining whether each measurement model met a-priori benchmarks for fit indices articulated above, the chi-square difference test was used (using the DIFFTEST function in Mplus; Muthén & Muthén, 1998–2019). A significant difference between two comparable models indicates a significant decrement in model fit.
Following the CFAs, internal reliability, means, and standard deviations for each subscale of the EIQ, based upon the best fitting measurement model, and SIAQ were calculated. Using a similar approach to Williams and Cumming (2011), a repeated measures analysis of variance (ANOVA) was run on the EIQ subscales to examine whether there were any significant differences in ease of imaging. The Greenhouse–Geisser correction was implemented, partial eta squared was reported as the measure of effect size, and the significant effect was followed up with post hoc Bonferroni pairwise comparisons. Finally, bivariate correlations were run to examine associations between the EIQ and SIAQ subscales. The critical alpha level for all analyses was set at .05.
Results and Discussion
Factor Structure
Goodness-of-fit statistics and chi-square difference test values from the measurement models are presented in Table 5. The correlated four-factor model identified in Study 2 demonstrated good fit to the data with all fit indices meeting or exceeding specified guidelines. Inspection of the standardized factor loadings (ranging from .51 to .90), modification indices, and standardized residuals revealed all values were within acceptable limits and no offending estimates existed (Hair et al., 1998) meaning each EIQ item contributed meaningfully to its subscale. None of the competing measurement models provided adequate model fit, with the correlated four-factor model providing a significantly better fit to the data compared to each competing measurement model (via chi-square difference testing). Collectively these results support the EIQ’s four-factor structure.
EIQ Descriptives, Internal Consistencies, and Subscale Differences
Means standard deviations and internal reliabilities of the EIQ and SIAQ are displayed in Table 4. Adequate internal reliability was demonstrated for all subscales of the EIQ and SIAQ, and the average interitem correlations ranged from .56 to .48. The repeated measures ANOVA demonstrated significant differences in ease of imaging between the four EIQ subscales, F(1.96, 305.58) = 134.99, p < .001, η2p = .464 suggesting a large effect. Post hoc analyses showed that ease of imaging scores for positive affect imagery were significantly greater than negative affect and grit imagery which were both in turn significantly easier to image than relent imagery. Similar to the SIAQ, findings for the EIQ demonstrate the ability to image feelings and emotions tends to be easier that difficult situations. However, findings also suggest that it is generally easier to image positive imagery content compared with negative imagery content.
EIQ, SIAQ, CAS, Perceived Stress, Stress Mindset, Anxiety, and Depressive Symptoms Subscale Internal Reliabilities, Means (SDs), and Correlations Between Subscales for Studies 3, 4, and 5.
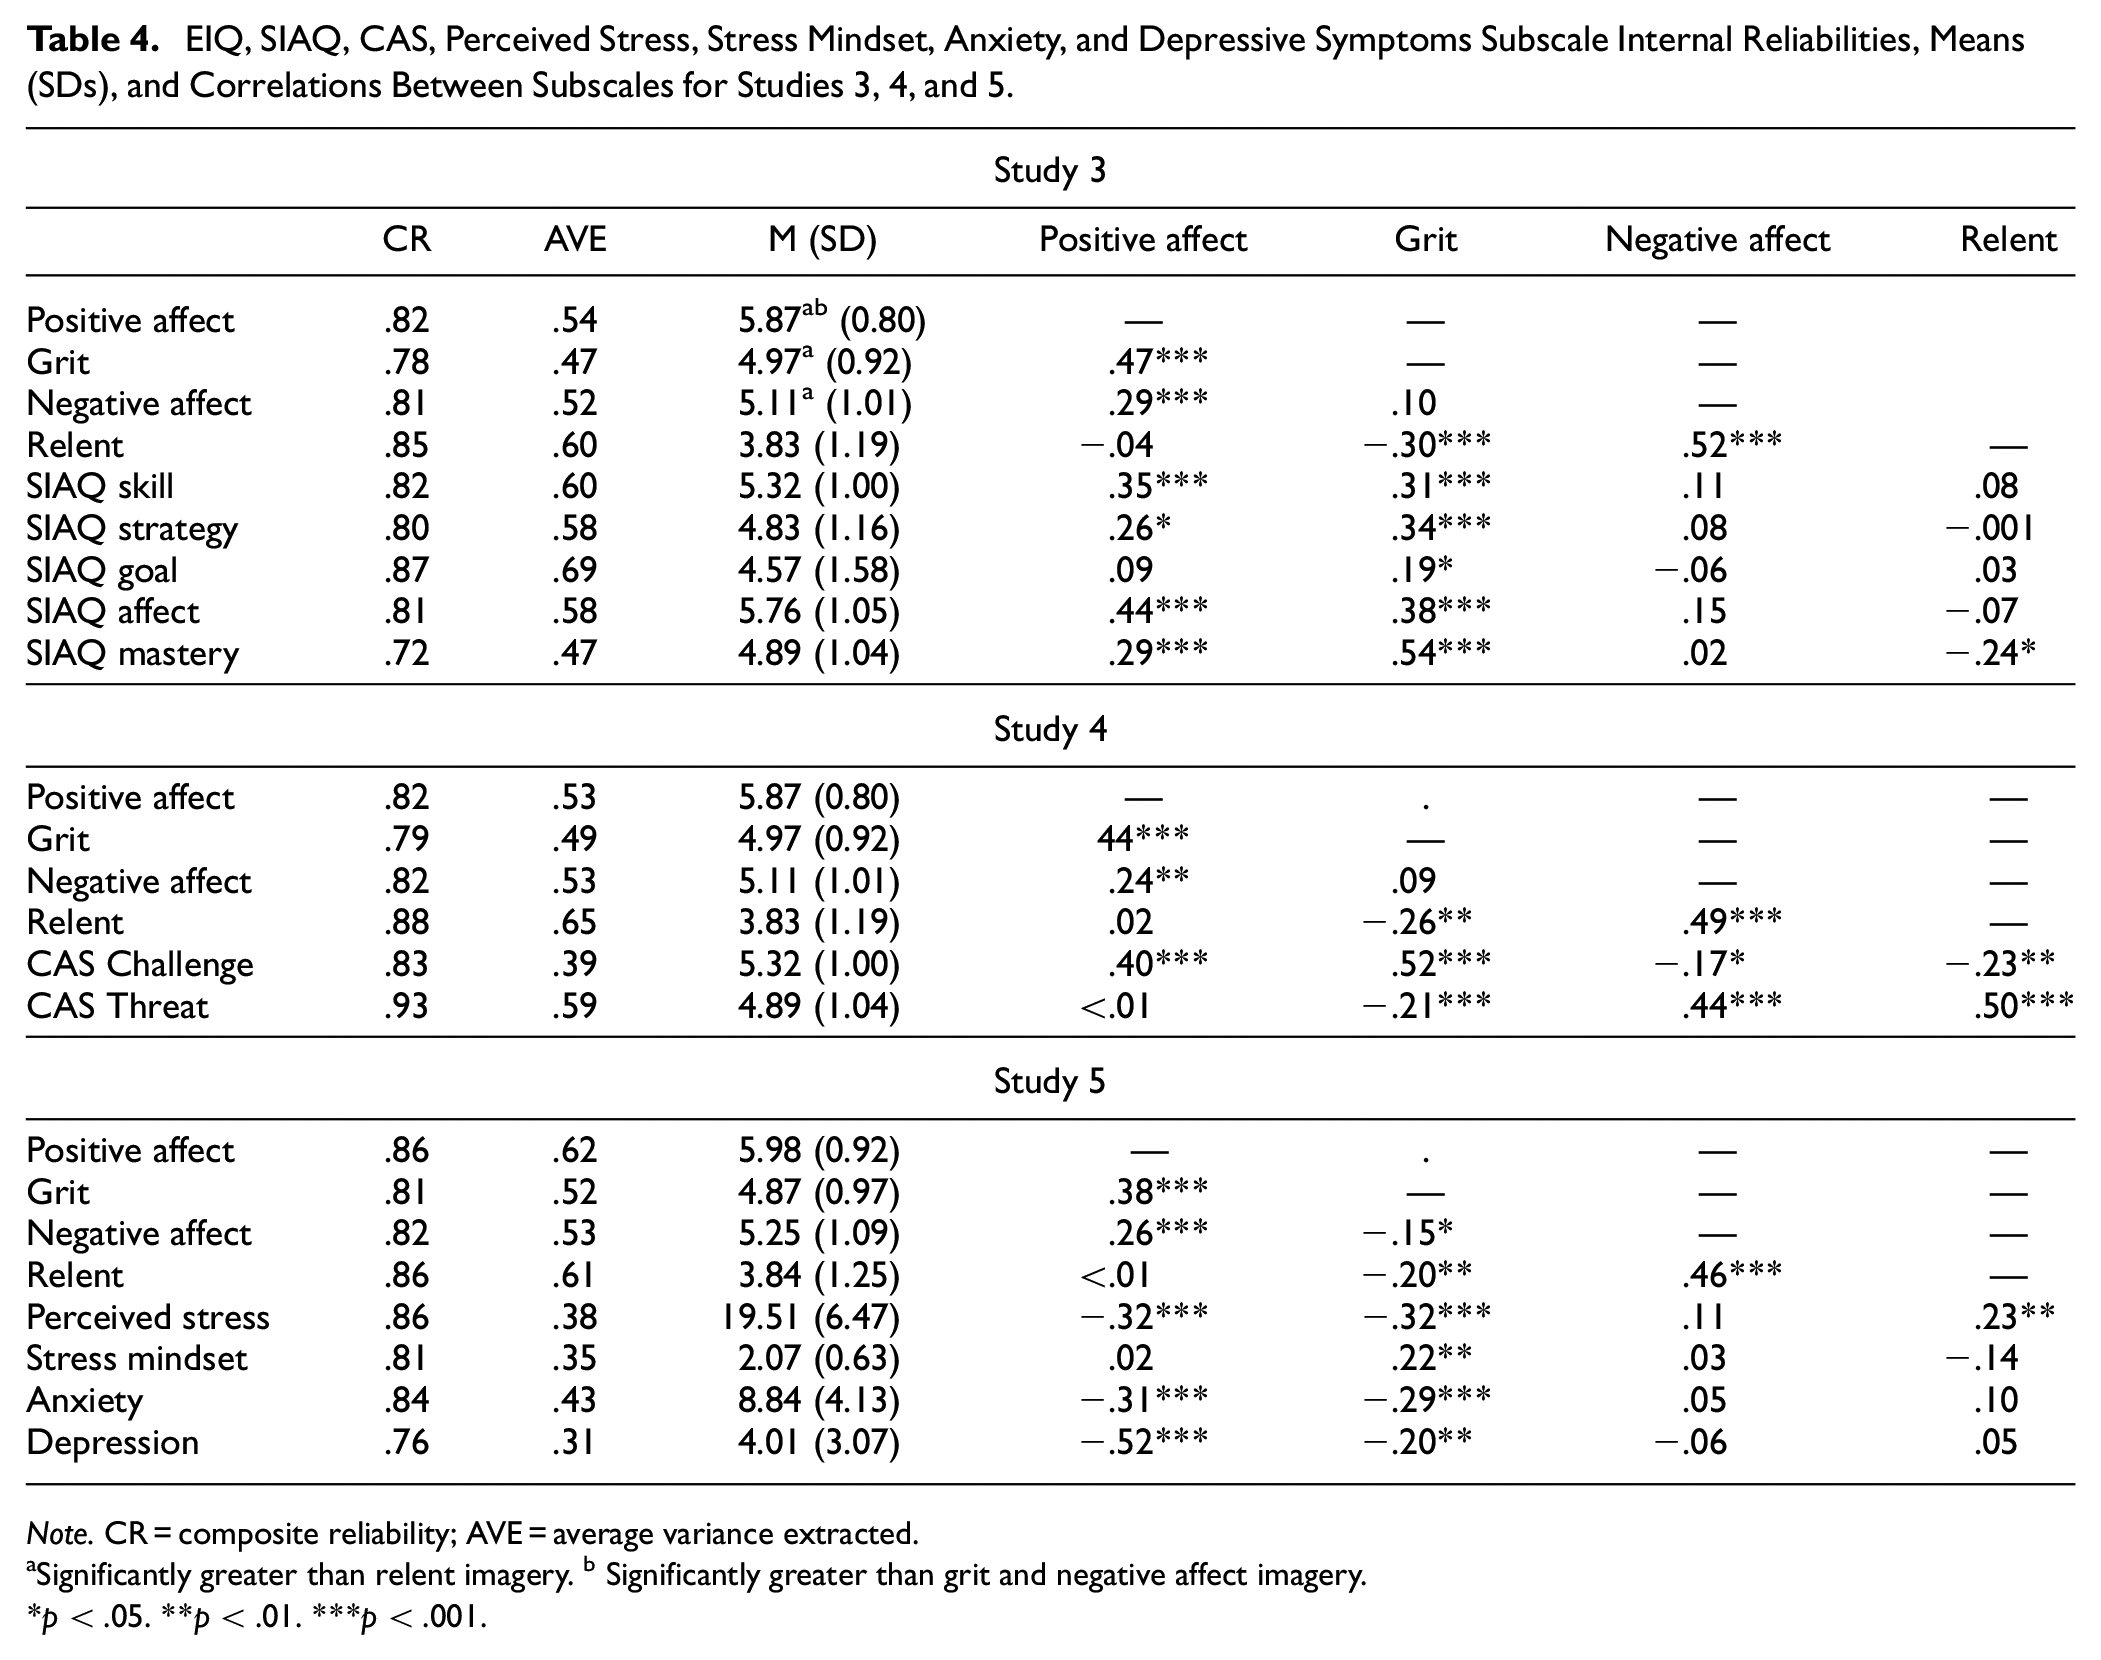
Note. CR = composite reliability; AVE = average variance extracted.
Significantly greater than relent imagery. b Significantly greater than grit and negative affect imagery.
p < .05. **p < .01. ***p < .001.
Correlations
Table 4 displays all the EIQ intersubscale correlations and EIQ correlations with the SIAQ. Correlations between the EIQ subscales were replicated from Study 2. That is, subscales correlated strongest with the subscale similar in direction (i.e., positively or negatively worded items), such that the grit and positive affect subscales were most strongly associated and the relent and negative-affect subscales most strongly associated. Subscales similar in content were also correlated, but not as strongly (i.e., the grit and relent subscales were related and the two affect-related subscales were related). Collectively, these findings suggest the ability to image scenarios of a similar direction (i.e., positive or negative) is more similar than the ability to image certain related content (e.g., emotional types of imagery both positive and negative in nature).
Correlations between the EIQ and SIAQ showed the positively worded EIQ subscales correlated with all SIAQ subscales (with the exception of SIAQ-goal imagery correlating with EIQ-positive affect). These significant correlations are likely due to the SIAQ subscales all consisting of positively worded items (i.e., the same direction as the EIQ-grit and EIQ-positive affect subscales). The EIQ subscales also correlated most strongly with the most similar SIAQ subscale and that was found for both the positive EIQ subscales and the negative EIQ subscales (i.e., grit and relent from the EIQ each correlated most strongly with SIAQ-mastery, and positive and negative affect from the EIQ each correlated most strongly with SIAQ-affect). The negative EIQ subscales did not correlate with any other SIAQ subscales. Collectively, these results suggest the EIQ and SIAQ are assessing distinct content but that the EIQ content is still related to that of affect and mastery content assessed by the SIAQ. The findings also emphasize the importance of separately assessing the ability to image both positive and negative imagery reflective of the content being assessed.
Study 4
Studies 1 to 3 demonstrated the content and structural aspects of construct validity of the EIQ. The aim of Study 4 was to demonstrate the substantive aspect of construct validity by examining the association of grit, relent, positive affect, and negative affect imagery ability and those from the theoretically associated variables challenge and threat appraisal tendencies. Challenge and threat are motivational states characterized by adaptive and maladaptive approaches to coping respectively (Blascovich & Mendes, 2000). Challenge states are experienced when individuals perceive they have sufficient resources to meet the demands of a stressful situation, whereas threat states are experienced when individuals believe they do not possess the sufficient resources to meet the demands (Blascovich & Mendes, 2000). Previous research demonstrated that greater ease of imaging positive emotions and persevering during difficult situations (i.e., affect and mastery [grit]-based content assessed via the SIAQ) was positively associated with challenge appraisal tendencies and negatively associated with threat appraisal tendencies (Williams & Cumming, 2013). The proposed explanation for this association has been that being able to more clearly image this content may help individuals believe that they have the resources to meet the demands of stress-evoking situations (Williams & Cumming, 2013). Therefore, if the EIQ assesses ease of imaging similar imagery content, it would be expected that similar relationships between the EIQ and challenge and threat appraisal tendencies would exist.
Method
Measures
Imagery Ability
The EIQ from Study 2 and 3 was administered to assess ease of imaging grit, relent, positive affect, and negative affect imagery content.
Challenge and Threat Appraisal Tendencies
The Cognitive Appraisal Scale (CAS: Skinner & Brewer, 2002) was employed to measure challenge and threat appraisal tendencies. The 18-item questionnaire assesses the likelihood of appraising situations as a challenge (e.g., “I tend to focus on the positive aspects of any situation”) and a threat (e.g., “I feel like a failure”). Responses are made on a 6-point scale ranging from 1 (strongly disagree) to 6 (strongly agree). Skinner and Brewer (2002) demonstrated the CAS is a valid measure of challenge and threat appraisal tendencies.
Participants and Procedures
Following ethical approval at the first author’s institution, a unique sample of 140 participants was recruited via email, posters, and word of mouth. Data collection started in January 2022 and ended in April 2022.
Data Analysis
First, data were screened for missing values before a CFA on the EIQ factor structure was undertaken using the same criteria as Study 3. Bivariate correlations examined relationships between EIQ and CAS subscales and one-way ANOVAs investigated any differences in EIQ and CAS subscales due to gender (the genderfluid participant was excluded from these ANOVA analyses because ANOVAs cannot be run on groups containing only one participant). Finally, two hierarchical multiple regressions were run to examine whether the EIQ subscales predicted challenge appraisal tendency and threat appraisal tendency. Both regressions adjusted for age and gender which were entered in Step 1 of the analyses before all four EIQ subscales were entered in Step 2.
Results
Participant Characteristics and EIQ CFA
In total, five participants were missing multiple EIQ data, so they were excluded from the analysis leaving a final sample of 135 (male = 51, female = 83, genderfluid = 1; Mage = 19.83, SD = 0.93 years). The correlated four-factor model again evidenced good fit to the data (Table 5). None of the competing measurement models provided adequate model fit, with the correlated four-factor model providing a significantly better fit to the data compared to each competing measurement model (via chi-square difference testing). Collectively, these results further support the EIQ’s four-factor structure.
Goodness-of-Fit Statistics for Tested Models.
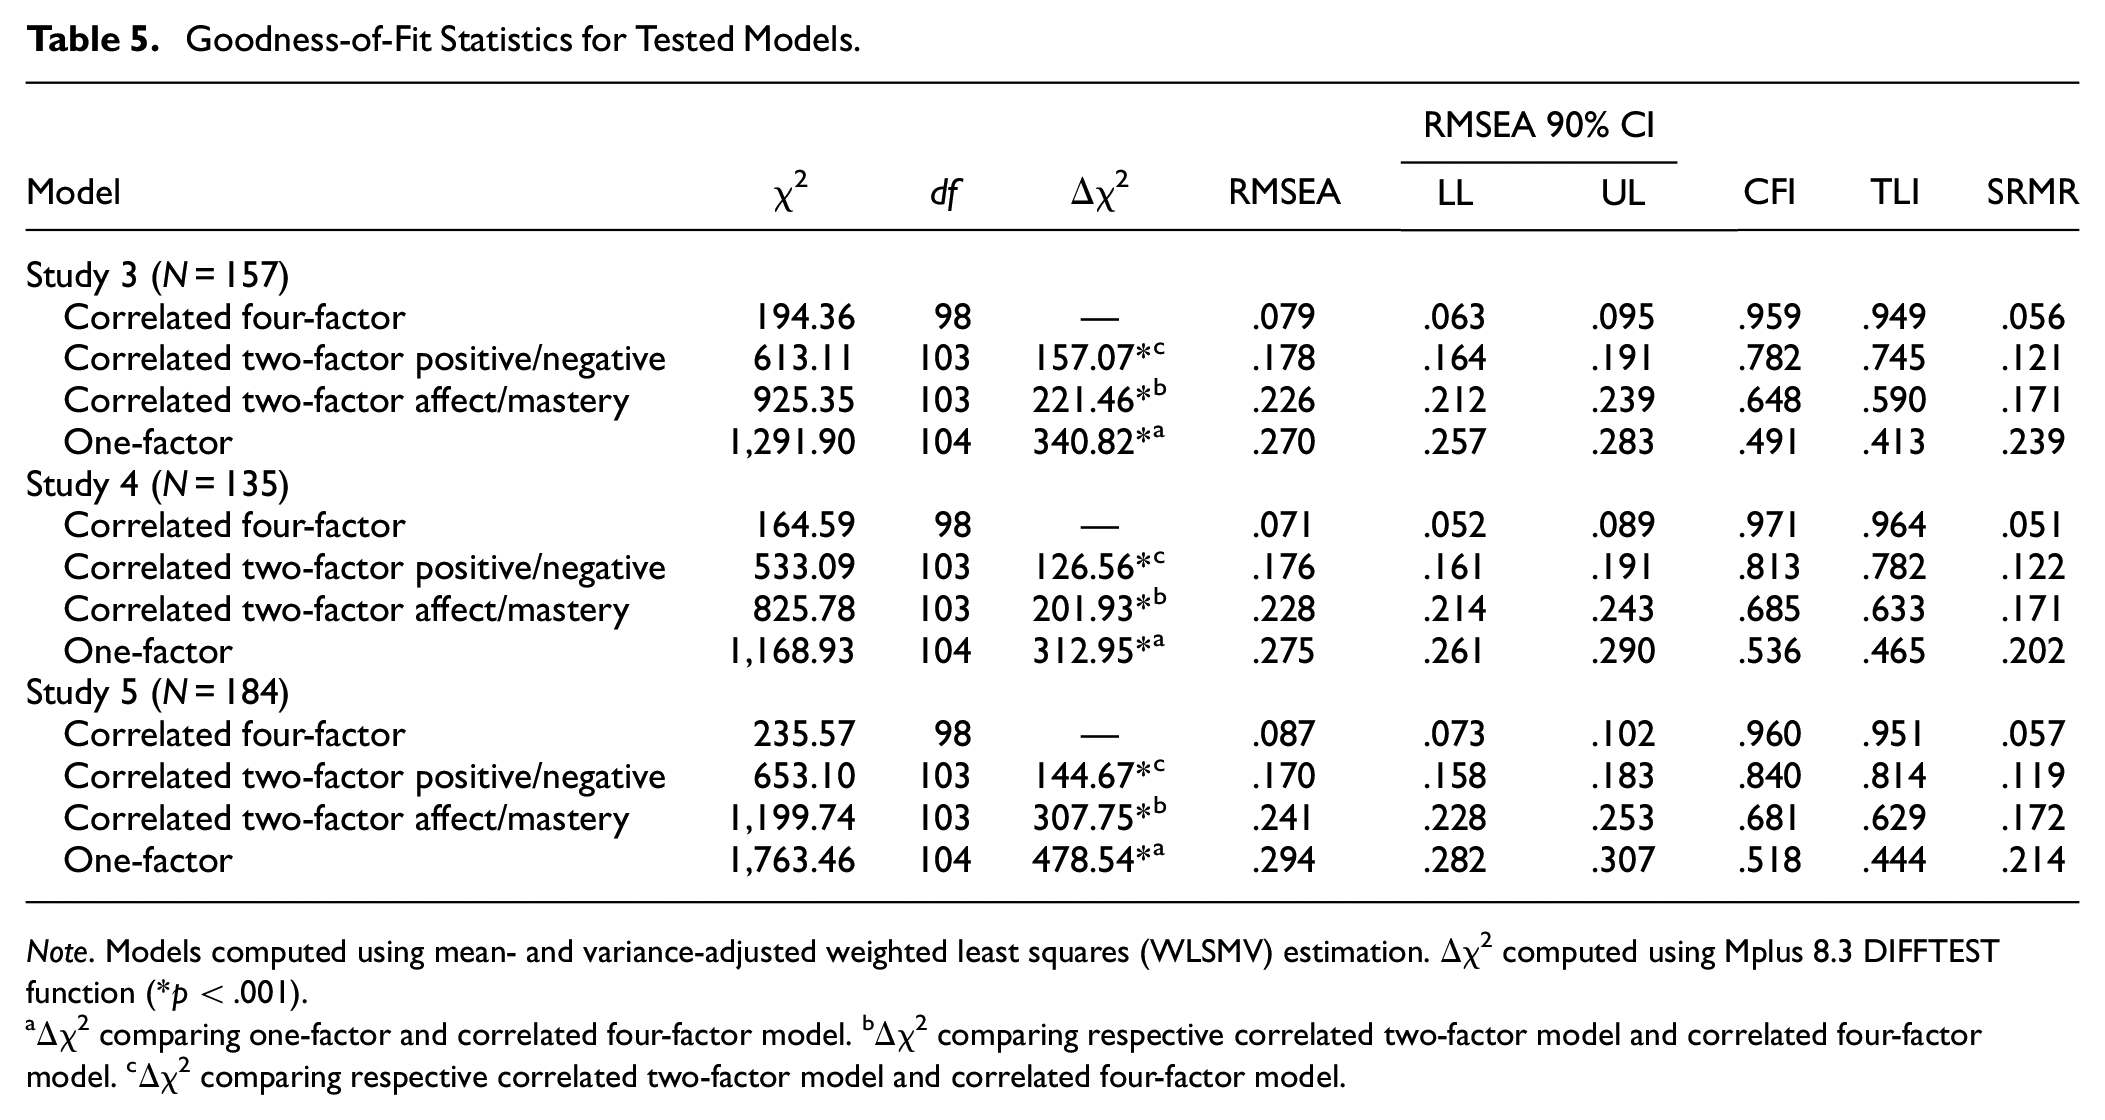
Note. Models computed using mean- and variance-adjusted weighted least squares (WLSMV) estimation. Δχ2 computed using Mplus 8.3 DIFFTEST function (*p < .001).
Δχ2 comparing one-factor and correlated four-factor model. bΔχ2 comparing respective correlated two-factor model and correlated four-factor model. cΔχ2 comparing respective correlated two-factor model and correlated four-factor model.
Correlations
Table 4 displays the correlations between the EIQ and CAS (one participant was missing a challenge data point and two participants a threat data point so these participants were excluded from any analyses involving those variables). Correlations between the EIQ subscales were similar to previous studies (subscales correlated strongest with the subscale similar in direction [i.e., positively or negatively worded items], and those similar in content [e.g., both affect subscales] were also correlated but not as strongly). Positive EIQ subscales significantly correlated positively with challenge appraisal tendencies and negatively with threat appraisal tendencies (with the exception of positive affect which did not relate to threat). Negative EIQ subscales significantly correlated negatively with challenge appraisal tendencies and positively with threat appraisal tendencies. Grit correlated most strongly with challenge and relent correlated most strongly with threat.
Gender Differences
Means and standard deviations of EIQ and CAS subscales broken down by gender are displayed in Table 6. The was a moderate to large effect of females reporting significantly greater relent imagery ability and a small to moderate effect of females reporting significantly greater threat appraisal tendencies. There were no other gender differences.
Means (SDs) Broken Down by Gender and One-Way ANOVA Results for EIQ, CAS Subscales, PSS, SMM, and HADS Subscales From Study 4 and Study 5
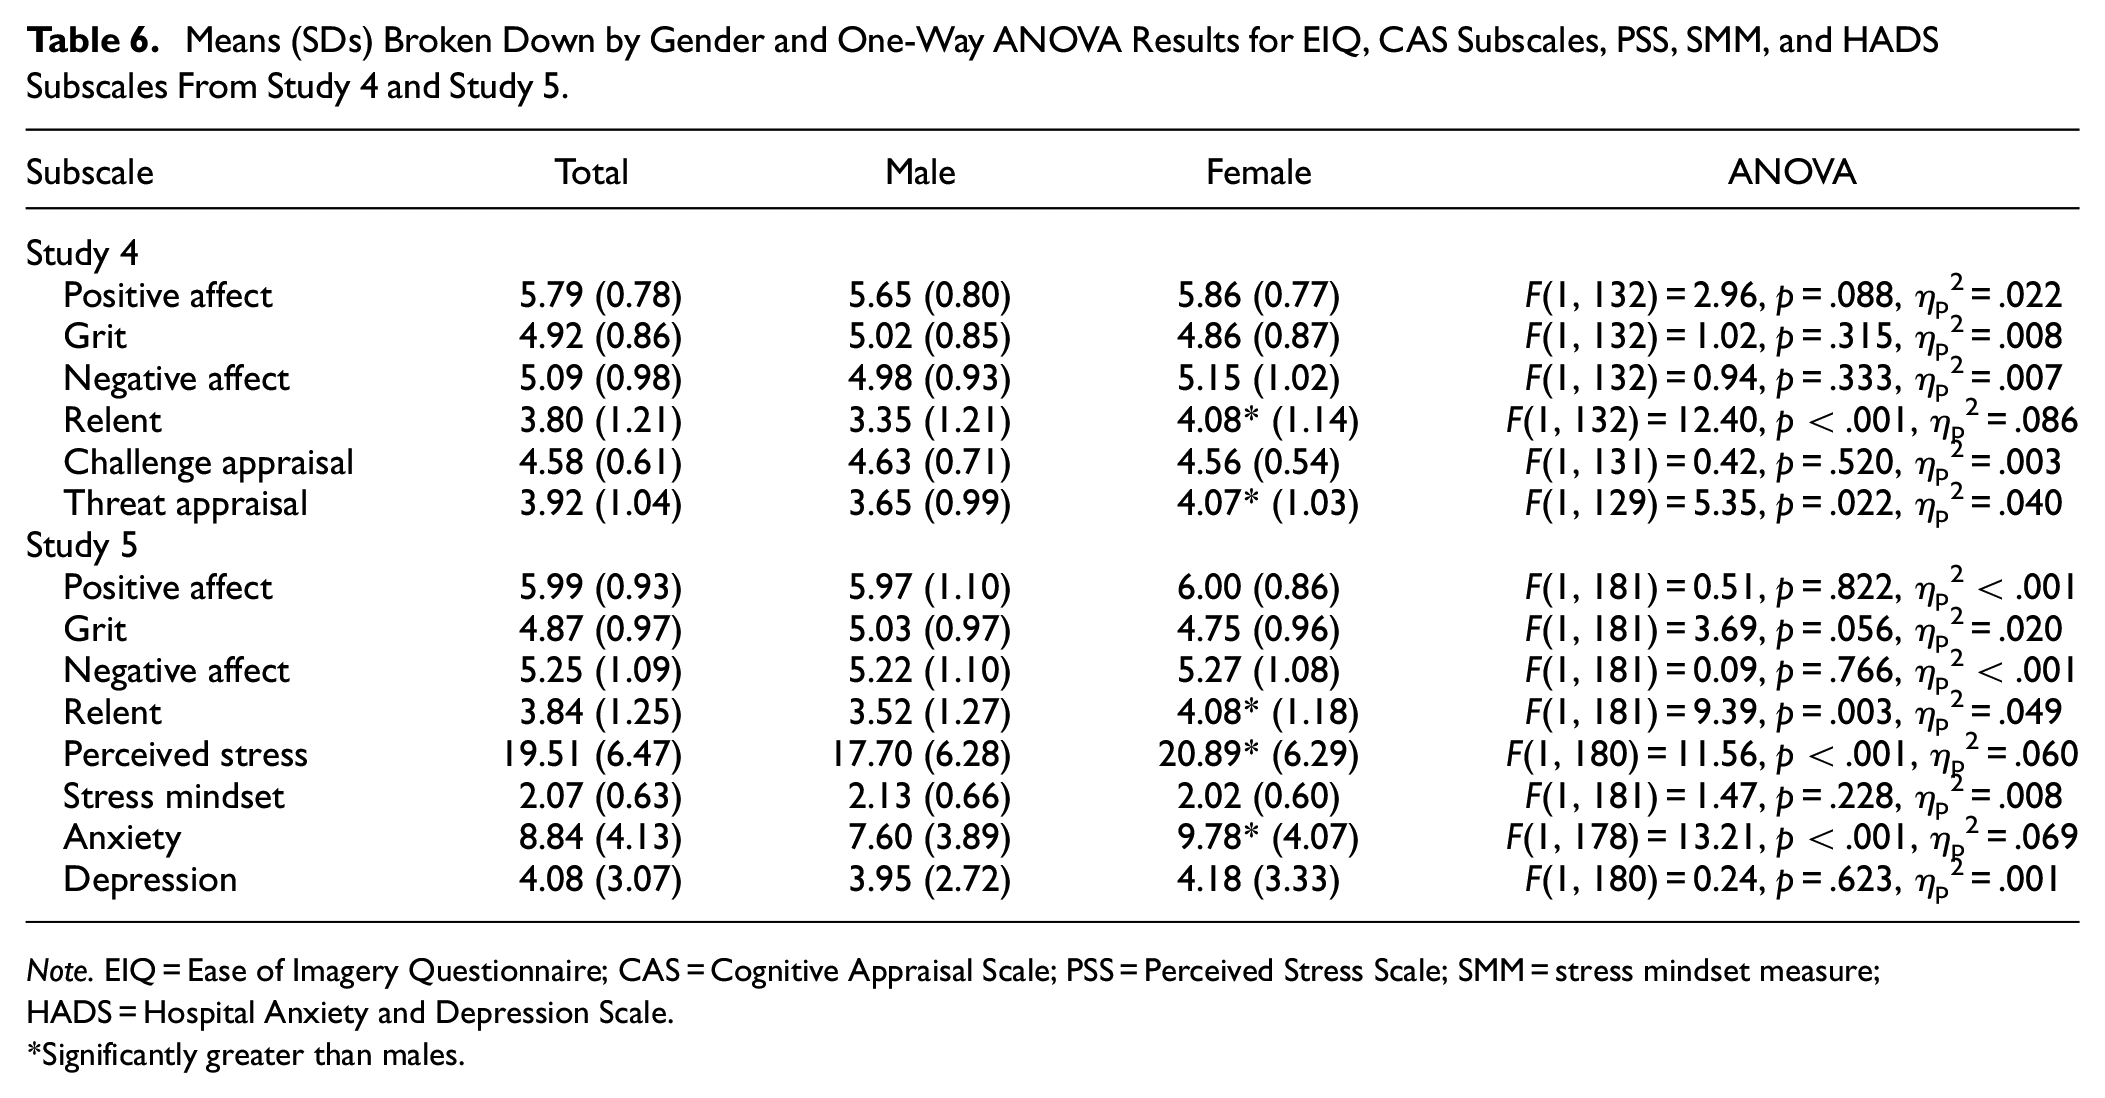
Note. EIQ = Ease of Imagery Questionnaire; CAS = Cognitive Appraisal Scale; PSS = Perceived Stress Scale; SMM = stress mindset measure; HADS = Hospital Anxiety and Depression Scale.
Significantly greater than males.
EIQ Criterion Validity
Regression standardized and unstandardized beta weightings, standard errors, t values, p values, and 95% confidence intervals of both regressions are reported in Table 7.
Regression Standardized and Unstandardized Beta Weightings, Standard Errors, t Values, p Values, and 95% Confidence Intervals for EIQ Subscales Predicting Challenge and Threat Appraisal Tendencies.
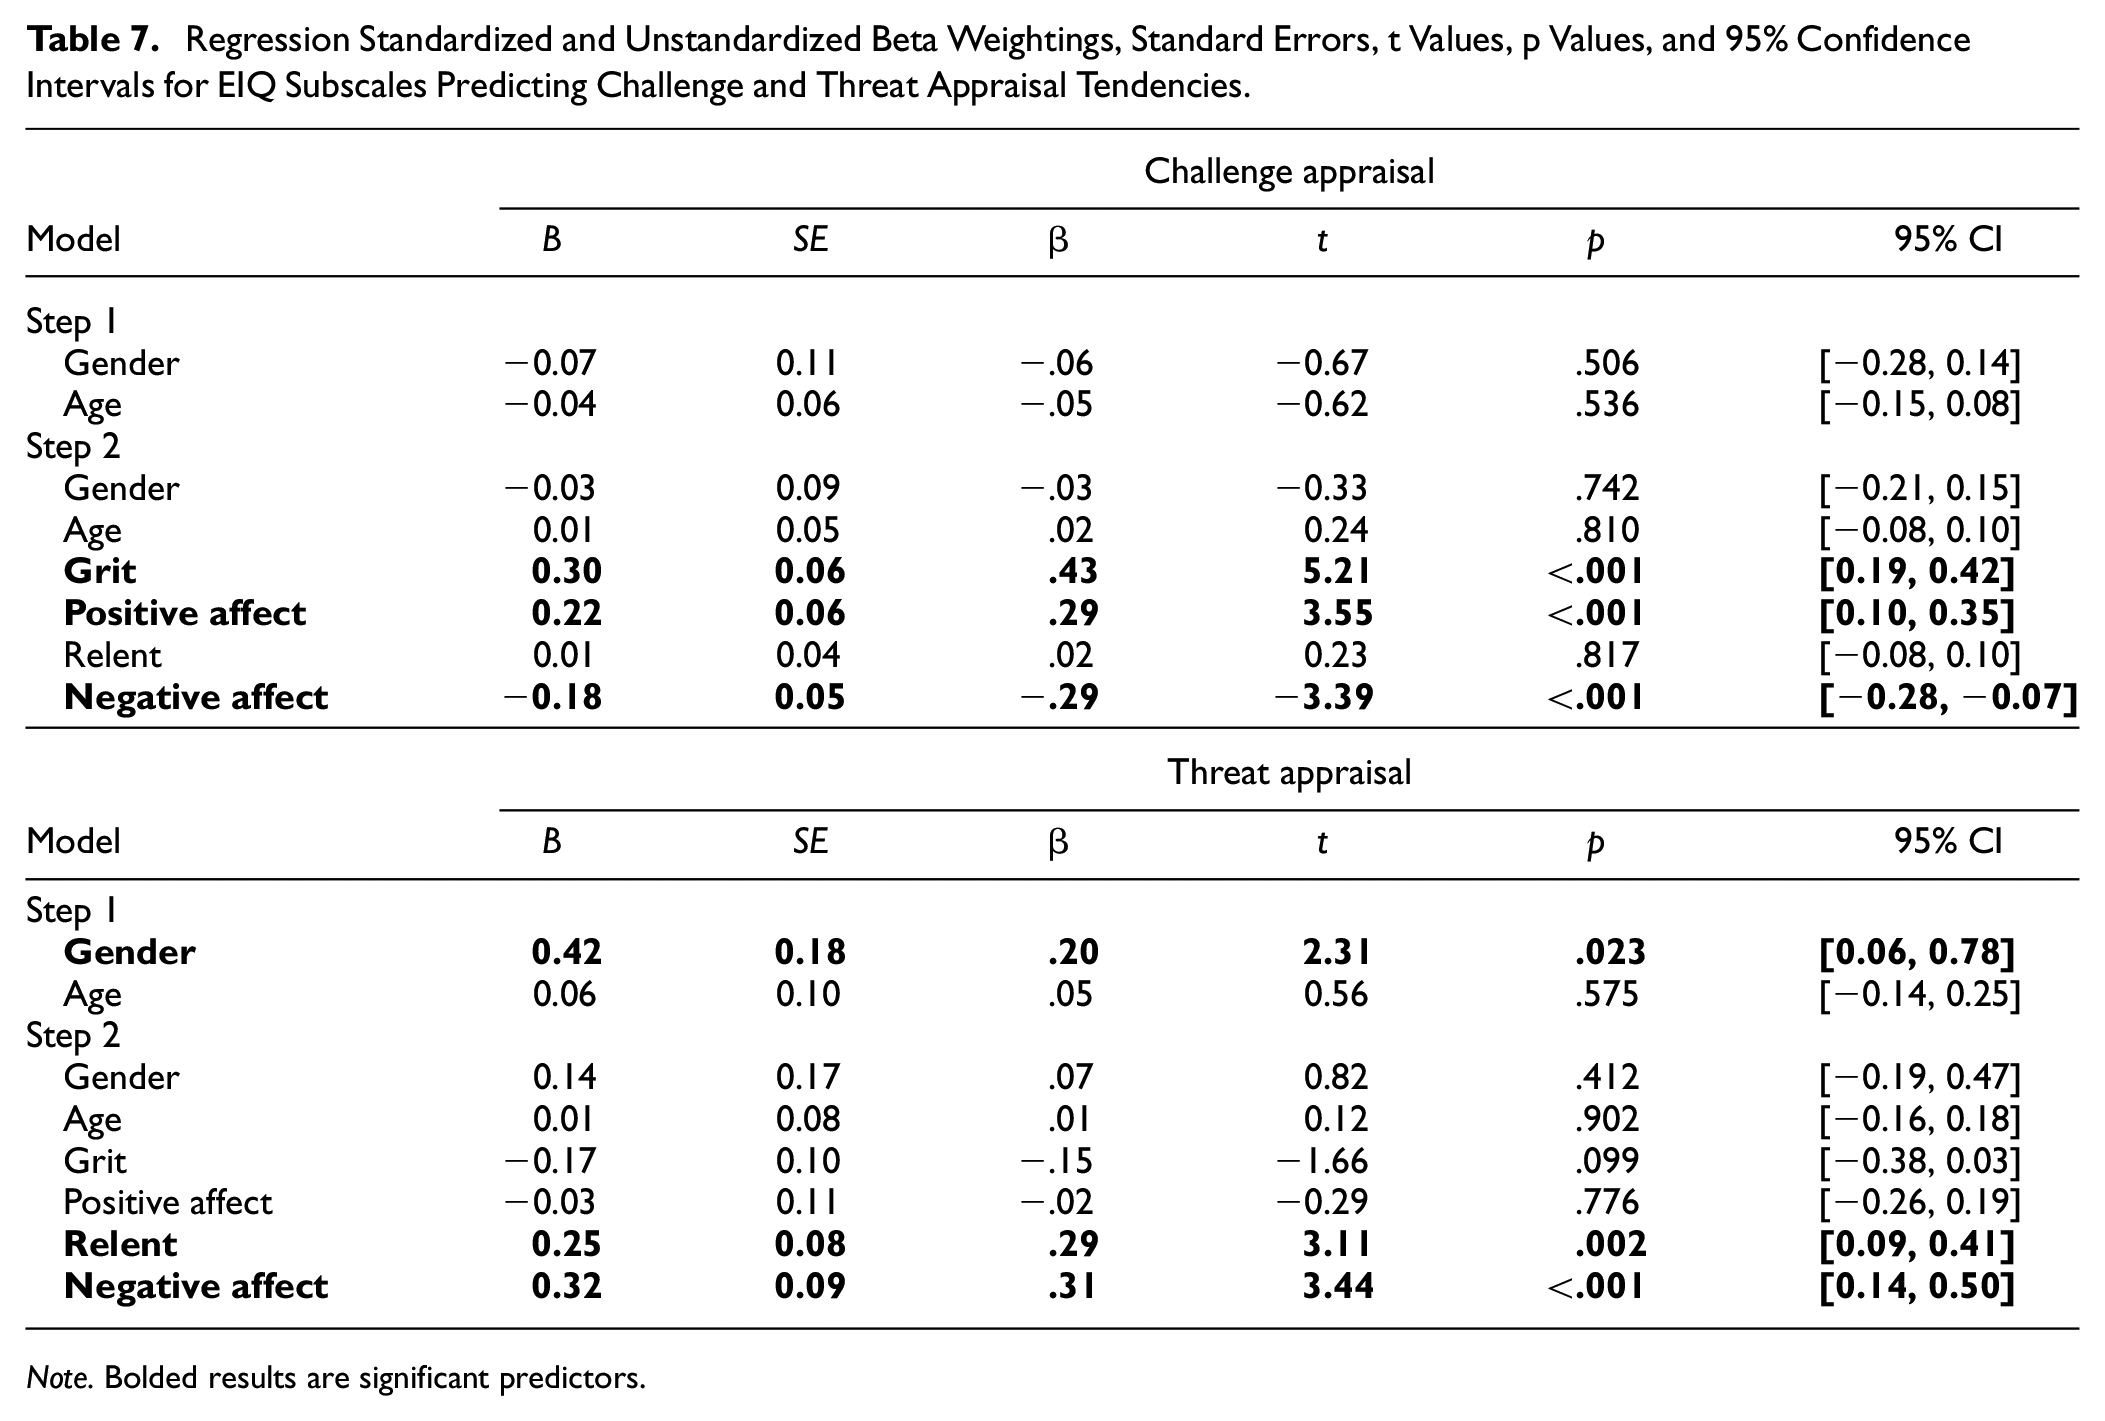
Note. Bolded results are significant predictors.
Challenge Appraisal Tendency
Step 1 demonstrated a nonsignificant overall effect, F(2, 131) = 0.351, p = .705 accounting for 0.5% of the variance. However, the addition of the EIQ subscales in Step 2 led to a significant change to the overall model, F(6, 127) = 13.15, p < .001 which accounted for 38% of the variance. Grit imagery ability was the strongest significant predictor of challenge appraisal tendency such that a higher grit imagery ability predicted greater challenge appraisal tendency. Other significant predictors were positive affect imagery ability (positively predicting) and negative affect imagery ability (negatively predicting). Relent imagery ability did not significantly predict challenge appraisal tendencies.
Threat Appraisal Tendency
There was a nonsignificant overall effect, F(2, 129) = 2.67, p = .073 accounting for 4% percentage of the variance. In Step 2, the addition of EIQ subscales lead to a significant overall effect, F(6, 125) = 9.92, p < .001 which accounted for 32% of the variance. Negative affect imagery ability was the strongest significant predictor of threat appraisal tendency closely followed by relent imagery ability such that a higher negative affect imagery ability and relent imagery ability predicted greater threat appraisal tendency. Grit and positive affect imagery ability did not significantly predict threat appraisal tendencies.
Discussion
Results of Study 4 replicated the good factor structure identified in Study 3 in a unique sample suggesting that the questionnaire assesses distinct dimensions of imagery ability. Furthermore, results of the regressions analyses provide further evidence of EIQ validation through its associations with theoretically associated variables namely challenge and threat appraisal tendencies. Findings were similar to Williams and Cumming (2013) who showed in an athlete sample that sport-specific mastery and affect imagery ability positively predicted challenge appraisal tendency with mastery imagery ability as the strongest predictor. This study demonstrated that both EIQ positive affect and grit imagery ability subscales predicted challenge appraisal tendencies in a nonathlete sample with grit (akin to mastery) as the strongest predictor.
While Williams and Cumming (2013) found mastery imagery ability negatively predicted threat appraisals, this study instead found relent and negative affect imagery ability to positively predict threat appraisal tendencies. This difference between studies is likely due to the SIAQ not measuring negative affect or relent content. Indeed, a modified SIAQ created by Quinton et al. (2018) showed that threat appraisal tendencies in an athlete sample were only predicted by SIAQ negative affect and negative mastery imagery ability (similar in content to relent imagery ability) and not positive affect or mastery imagery (similar in content to grit). The present findings replicate the findings of Quinton et al. (2018) in a nonathlete population using the EIQ and thus provide further support for the separate assessment of positive and negative imagery content due to the unique variance each account for in different stress-related constructs. The earlier studies in the present program of research demonstrate the EIQ’s ability to produce valid and reliable positive and negative affect, grit, and relent imagery ability scores. Consequently, researchers can now examine how imagery ability of such content relates to other constructs associated with stress.
Study 5
As noted, imagery is considered an important construct in relation to emotional disorders. In Study 5, the construct validity of the EIQ scores was thus further examined through correlations with indicators of negative emotion including anxiety symptom severity, depression symptom severity, and perceived stress. In addition, stress mindset was examined given its association with stress interpretation and indicators of wellbeing. It was hypothesized that the grit and positive affect subscales would be negatively associated with perceived stress, anxiety, and depressive symptoms, and positively associated with stress mindset. Conversely, it was hypothesized that relent and negative affect subscales would be positively associated with perceived stress, anxiety, and depressive symptoms, and negatively associated with stress mindset.
Method
Measures
Imagery Ability
The 16-item EIQ was administered to assess grit, relent, positive affect, and negative affect imagery ability (i.e., the ease to which they could image each of the 16 prompts).
Perceived Stress
The 10-item Perceived Stress Scale (PSS-10; Cohen & Williamson, 1988) measured perceived stress in the last week. Items (e.g., “How often have you felt ‘stressed’?”) were rated on a 5-point scale (0 = never, 4 = almost always). Items are summed so scores range from 0 to 40, with higher scores indicating more perceived stress. The PSS has demonstrated highly valid and reliable scores of perceived stress (Cohen et al., 1994).
Stress Mindset
The Stress Mindset Measure (SMM; Crum et al., 2013) assessed participants’ general stress mindset. Participants rate the extent to which they agree or disagree with each of the 8-items (e.g., “The effects of stress are positive and should be utilized”) on a 5-point scale (0 = strongly disagree, 4 = strongly agree). Items are totaled so a higher score indicates a more stress-is-enhancing mindset. The SMM produces valid and reliable stress mindset scores (Crum et al., 2013).
Anxiety and Depressive Symptoms
The Hospital Anxiety and Depression Scale (HADS; Zigmond & Snaith, 1983) measured trait anxiety and depressive symptoms. Each subscale consists of seven questions reflecting anxiety (e.g., “I feel tense or ‘wound up’”) and depressive symptoms (e.g., “I feel as if I am slowed down”) that are answered on a 4-point scale between 0 and 3. Subscale items are summed to derive overall ratings of anxiety and depressive symptoms ranging from 0-21 with higher scores indicating greater trait anxiety/depressive symptoms. The HADS produces valid and reliable anxiety and depressive symptom scores (Bjelland et al., 2002).
Participants and Procedures
Following ethical approval at the first author’s institution, a unique sample of 184 participants were recruited via email, posters, and word of mouth. Data collection started in October 2022 and ended in March 2023.
Data Analysis
Data were screened for missing values before a CFA was run on the EIQ factor structure (same criteria as Study 3 and 4). While there was no missing data for the EIQ and SMM, one participant elected to not complete the PSS, one participant elected not to complete a number of HADS items measuring depressive symptoms, and three participants elected not to complete a number of HADS items measuring anxiety. These participants were therefore excluded from any analysis including the variables from which they had missing data. Bivariate correlations examined relationships between EIQ, PSS, SMM, and HADS subscales and one-way ANOVAs investigated differences in the subscales due to gender. Hierarchical multiple regressions were then run to examine which EIQ subscales predicted perceived stress, stress mindset, anxiety, and depressive symptoms. Age and gender were entered in Step 1 before all five EIQ subscales entered in Step 2.
Results
Participant Characteristics and EIQ CFA
The final sample consisted of 184 (male = 80, female = 103, not reported = 1; Mage = 19.95, SD = 1.16 years). The correlated four-factor model again evidenced good fit to the data (Table 5). None of the competing measurement models provided adequate model fit, with the correlated four-factor model providing a significantly better fit to the data compared to each competing measurement model (via chi-square difference testing). Collectively these results further support the EIQ’s four-factor structure.
Correlations
Table 4 displays the correlations between the EIQ, PSS, SMM, and HADS subscales. Correlations between the EIQ subscales were similar to previous studies with the exception that negative affect was negatively associated with grit imagery ability. Positive EIQ subscales significantly correlated negatively with perceived stress, anxiety, and depressive symptoms and grit imagery ability positively correlated with a more stress-is-enhancing mindset. Relent imagery ability significantly and positively correlated with perceived stress.
Gender Differences
Means and standard deviations of EIQ, PSS, SMM, and HADS subscales broken down by gender are displayed in Table 6. Similar to Study 4, females reported significantly greater relent imagery ability (moderate effect). They also reported significantly greater stress and anxiety (both a moderate effect) with no other gender differences.
EIQ Predicting Stress, Stress Mind-set, Anxiety, and Depressive Symptoms
Regression standardized and unstandardized beta weightings, standard errors, t values, p values, and 95% confidence intervals of the four regressions are reported in Table 8.
Regression Standardized and Unstandardized Beta Weightings, Standard Errors, t Values, p Values, and 95% Confidence Intervals for Ease of Imagery Questionnaire Predicting Perceived Stress, Stress Mindset, Anxiety, and Depressive Symptoms.
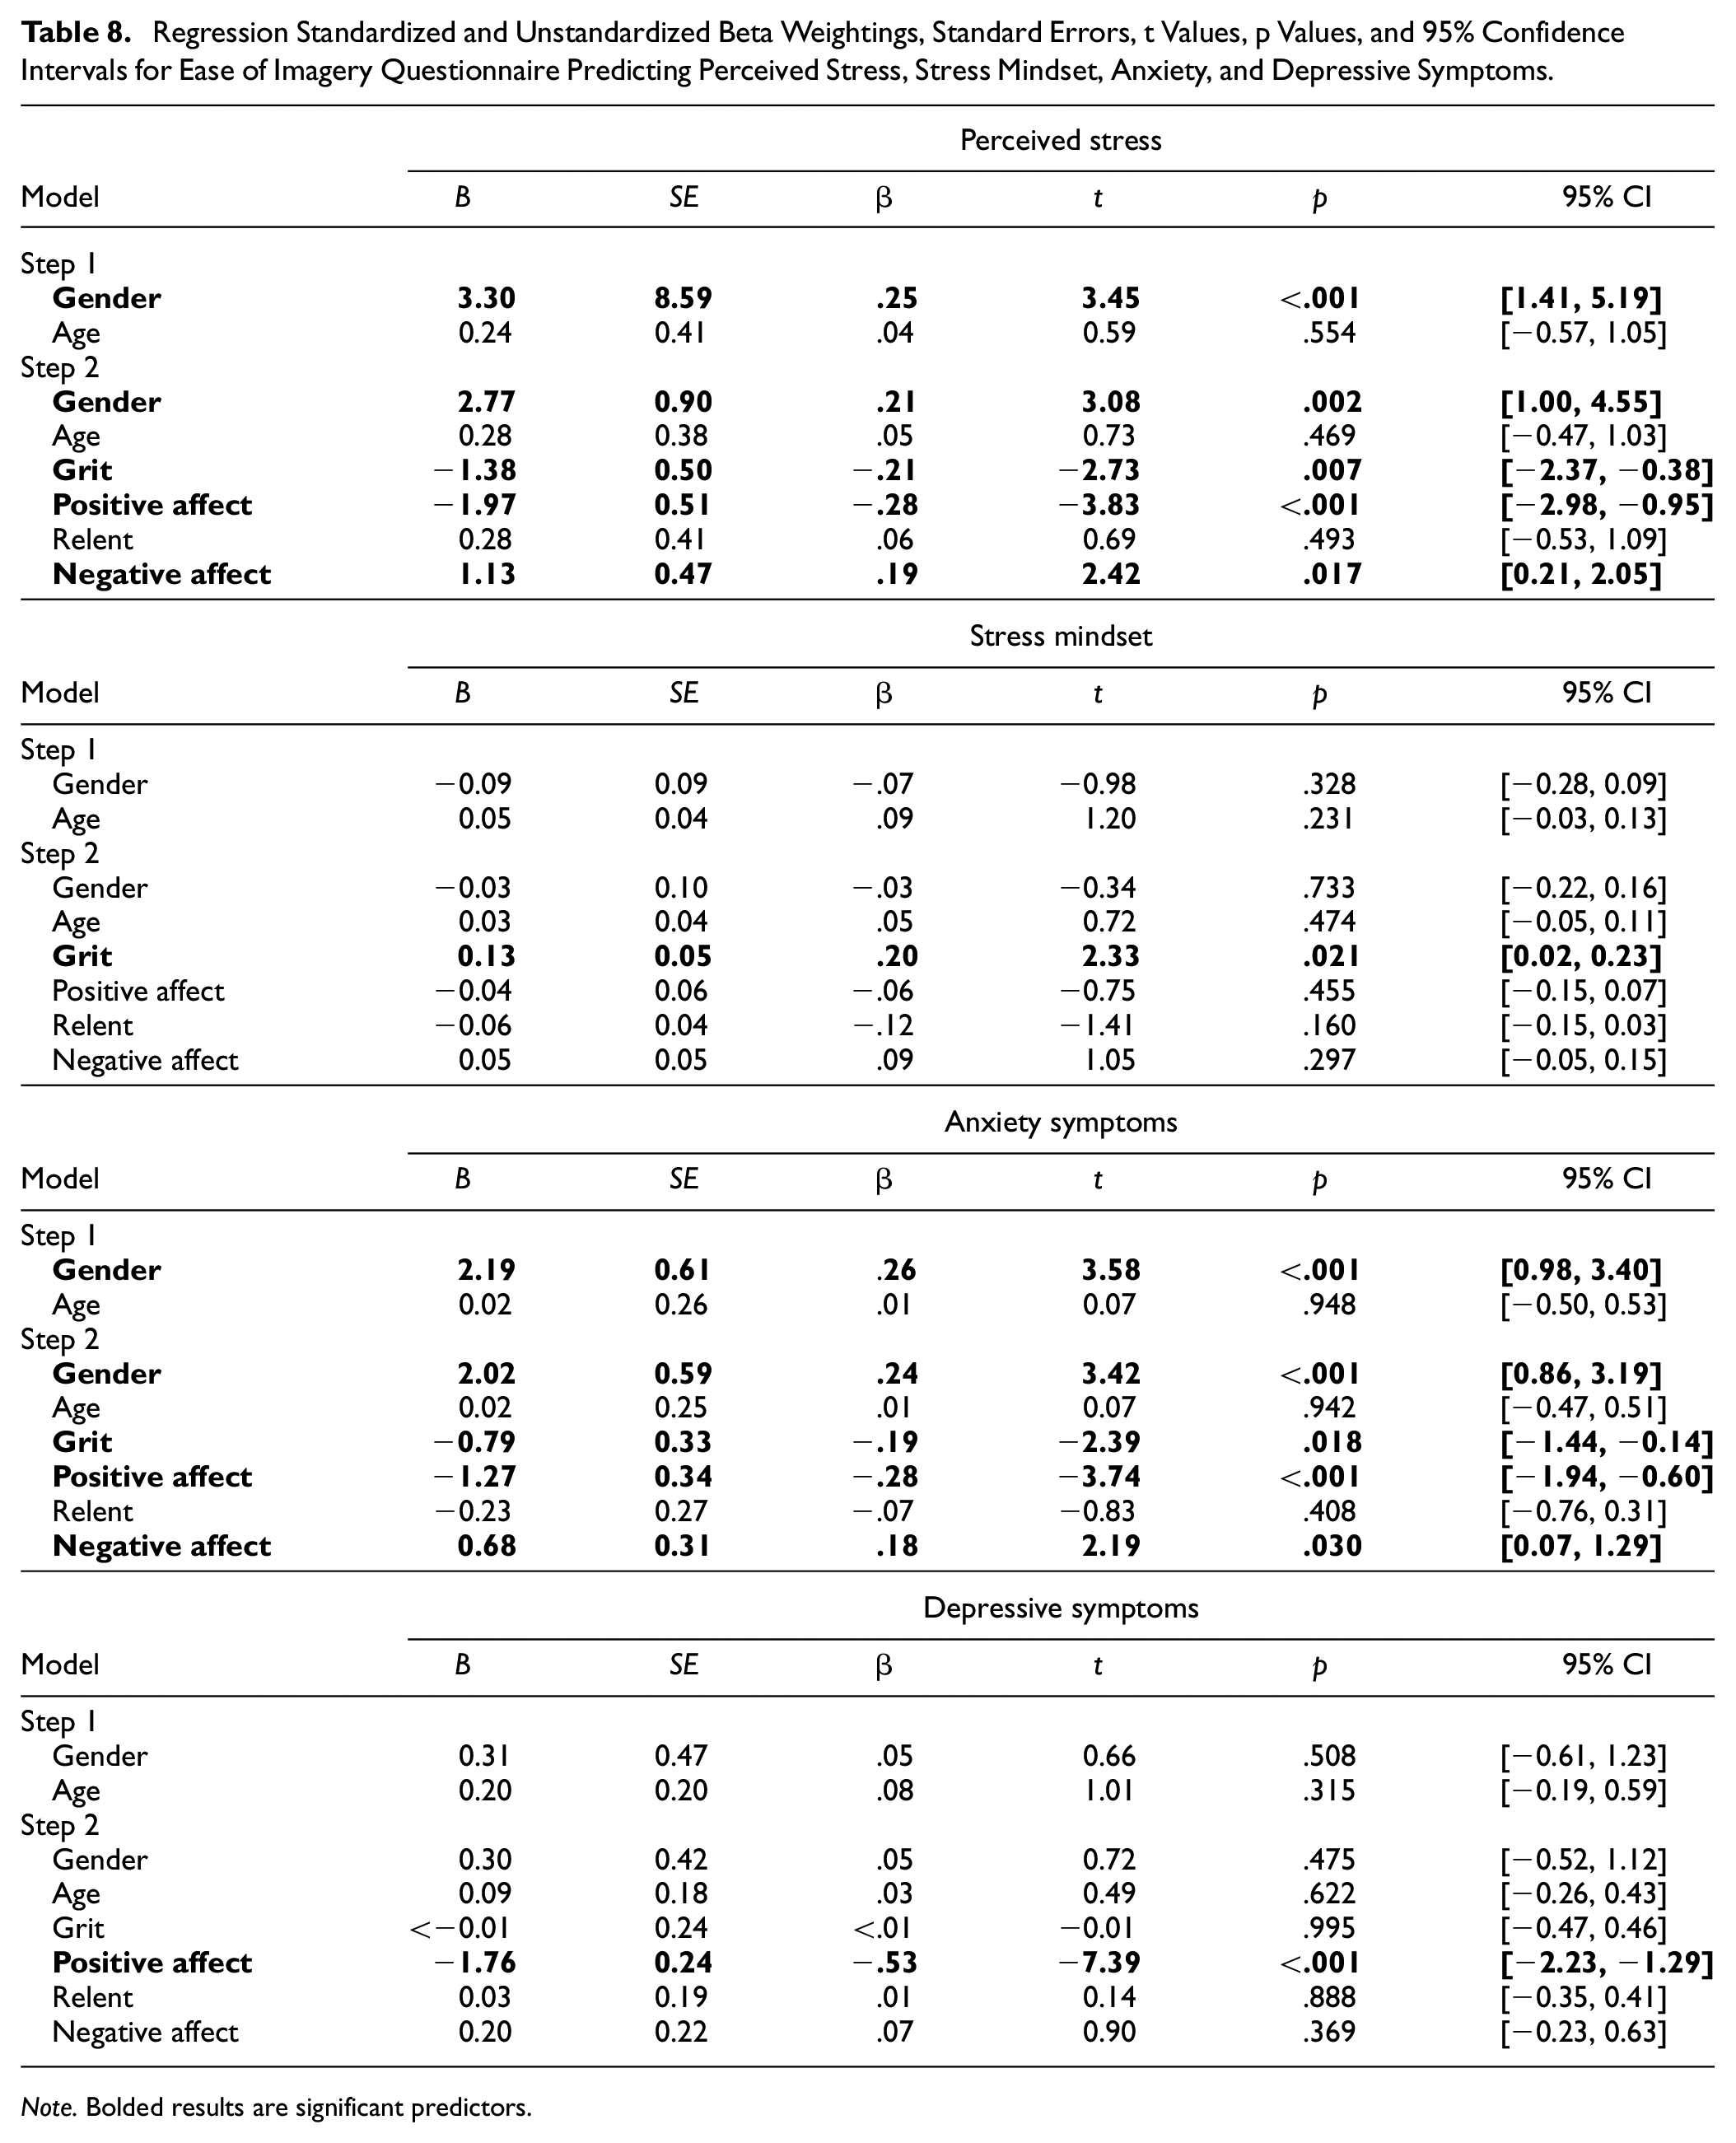
Note. Bolded results are significant predictors.
Perceived Stress
There was a significant overall effect, F(2, 179) = 5.94, p = .003 accounting for 6% of the variance. However, the addition of the EIQ subscales in Step 2 led to a significant change to the overall model, F(6, 175) = 9.32, p < .001 which accounted for 24% of the variance. In addition to gender, grit and positive affect imagery ability significantly related to perceived stress, with positive affect the strongest predictor, such that higher grit and positive affect imagery ability was related to lower perceived stress. Negative affect imagery was also significantly and positively related to perceived stress.
Stress Mindset
There was a nonsignificant overall effect, F(2, 180) = 1.46, p = .236 accounting for 2% percentage of the variance. Adding the EIQ in Step 2 lead to a significant overall effect, F(6, 176) = 2.21, p = .044 accounting for 7% of the variance. Grit imagery ability positively related to a more stress-is-enhancing mindset.
Anxiety
There was a significant overall effect, F(2, 177) = 6.57, p = .002 accounting for 7% of the variance. However, the addition of the EIQ subscales in Step 2 led to a significant change to the overall model, F(6, 173) = 7.44, p < .001 which accounted for 21% of the variance. Results were the same as those for perceived stress with grit and positive affect imagery ability significantly relating to anxiety negatively (with positive affect the strongest predictor), and negative affect significantly relating to anxiety positively.
Depressive Symptoms
There was a nonsignificant overall effect, F(2, 179) = 0.63, p = .535 accounting for 0.7% of the variance. However, the addition of the EIQ subscales in Step 2 led to a significant change to the overall model, F(6, 175) = 11.16, p < .001 which accounted for 28% of the variance. Positive affect was negatively associated with depressive symptoms.
Discussion
Results of Study 5 demonstrate the good factor structure of the EIQ in a third unique sample and replicate the Study 4 gender difference in relent imagery ability. Although there was no gender difference in grit imagery ability, the p value was approaching significance. Williams and Cumming (2011) demonstrated mastery imagery ability (similar content to grit imagery ability) to be significantly easier to generate by male samples. Consequently, future research should further examine whether there is a tendency for males to find it easier to image grit content and females to find it easier to image relent content.
Study 5 also demonstrates the associations between the EIQ and theoretically relevant constructs in the form of stress, stress mindset, and anxiety and depressive symptoms. In general, findings supported the hypotheses suggesting that the ability to image different content is relevant in accounting for variance in these variables in the directions expected but that positive affect imagery appears the strongest predictor (with the exception of grit being the strongest predictor of viewing stress more positively—particularly when considering the findings from Study 4 in which grit imagery was the strongest predictor of challenge appraisal tendencies). Contrary to the hypothesis, relent imagery ability did not predict any of the outcome variables. Importantly, the findings across both studies 4 and 5 highlight the unique contribution of each EIQ subscale and thus the importance of assessing these different types of imagery content.
General Discussion
The aim of the present research was to develop and validate the EIQ, as a comprehensive assessment of imagery ability regarding content of feelings/emotions and stressful/demanding situations. The EIQ was designed to differ from existing questionnaires by (a) assessing images of emotions and responding to demanding situations rather than the generic visual or movement images, (b) assessing content in a nonathlete population, and (c) simultaneously measuring positive and negative images to allow for the examination and direct comparisons of the same sort of imagery content in different directions.
Collectively, the studies supported a four-factor model which provided a very good fit to the data across multiple studies and a better fit to the data than competing two-factor models that were informed by Study 2 analyses and a unidimensional model. Analyses also demonstrated a difference in how easily these types of imagery content could be imagined and suggested there may also be gender differences in grit and relent content. However, future research needs to investigate this in more depth to fully determine whether this is the case.
Findings also demonstrated the validity of the EIQ in terms of its associations with theoretically meaningful constructs as well as how well it related to the SIAQ—a sport-specific questionnaire which measures similar imagery content in athletes. A summary of what the four EIQ subscales are related to across studies 4 and 5 is displayed in Table 9. Grit and positive affect imagery ability relate to adaptive constructs and are negatively associated with maladaptive constructs. By contrast, relent and negative affect imagery ability have negative associations with the positive constructs, and positive associations with negative constructs. Grit imagery ability appears to be more of a predictor of adaptive stress appraisals and viewing stress more facilitatively, while positive affect imagery ability appears more strongly associated with indicators of mental health (i.e., anxiety and depressive symptoms) as well as stress. Relent and negative affect imagery ability do not relate to as many constructs as their positive counterparts (i.e., grit and positive affect imagery ability), with negative affect imagery ability seeming to more strongly relate to variables associated with stress and stress appraisals, while relent only related to threat appraisal tendencies. Interestingly, grit imagery ability did not relate to threat appraisal tendencies, and it should be noted that while there were some inverse relationships between EIQ counterpart subscales correlating with the same variable (e.g., positive affect and negative affect imagery abilities were both associated in opposite directions with general anxiety), this was often not the case demonstrating the uniqueness of separately assessing positive and negative dimensions of similar types of imagery content.
Summary of Constructs That the EIQ Subscales Related to Across the Different Studies.
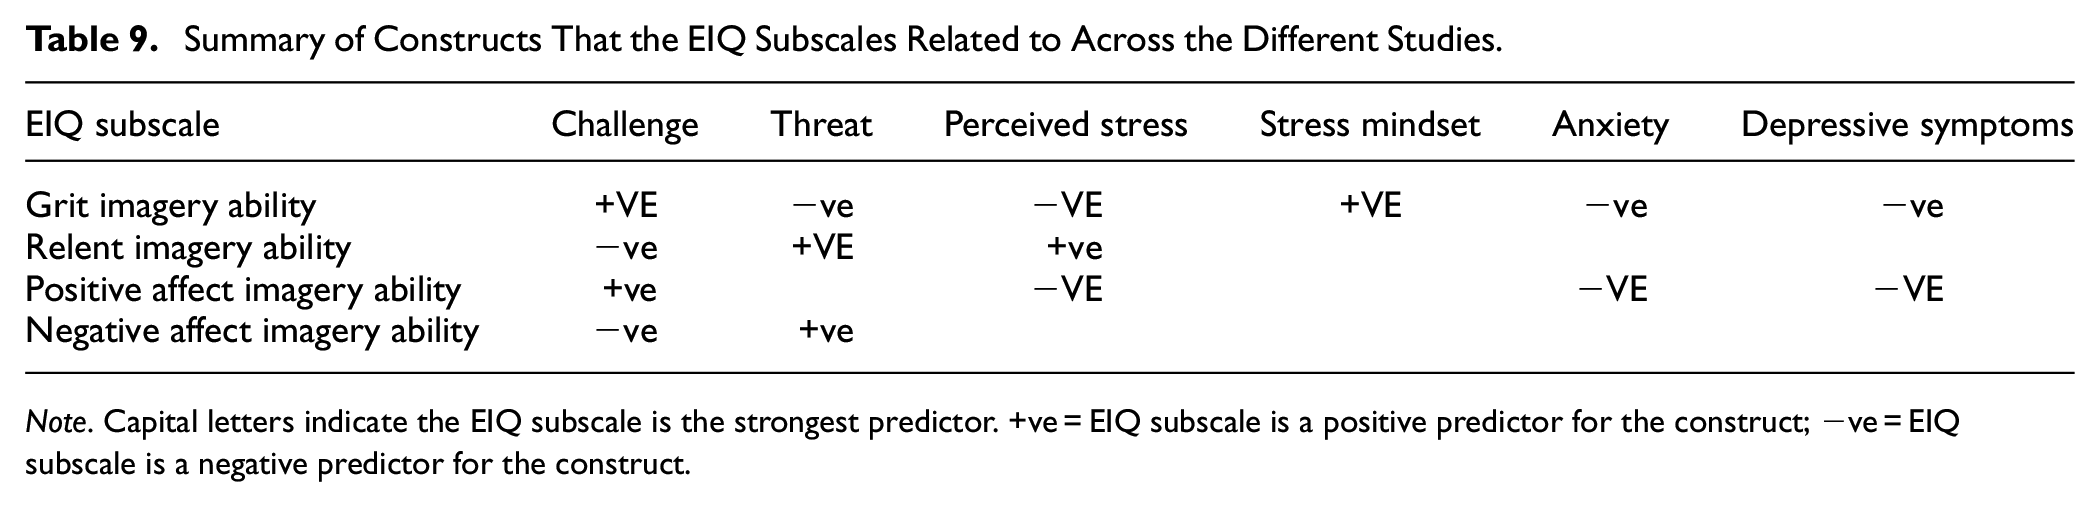
Note. Capital letters indicate the EIQ subscale is the strongest predictor. +ve = EIQ subscale is a positive predictor for the construct; −ve = EIQ subscale is a negative predictor for the construct.
The program of work suggests that the subscales relate differently to theoretically related criterion variables and emphasizes the importance of assessing negative imagery content that is typically overlooked in existing imagery ability questionnaires but is incredibly prevalent in the clinical settings (Stopa, 2021). Being able to assess this type of imagery content is the first step to understanding the effects that ease of imaging negative content can have of on mental health, wellbeing, and the use of imagery in clinical settings.
Despite the support for the EIQ, the program of work is not without limitations and further research is needed to continually develop the questionnaire’s validation. First, the EIQ does not assess other types of imagery ability beyond valance-based content and content associated with experiencing difficult situations, meaning it would not be an appropriate measure when interested in imagery content different to that assessed by the questionnaire that may also be used in imagery interventions to treat anxiety, worry, and depression. As previously mentioned, imagery plays an important role in the development, maintenance, and treatment of emotional disorders. The EIQ was thus developed with the intention of it being used in this particular area of imagery research and applied practice. Furthermore, the questionnaire only assesses ease of imagery despite imagery ability being a multidimensional construct with dimensions like vividness also reflecting imagery ability (Cumming & Williams, 2012). Although ease of imaging has been proposed to reflect the different aspects of the imagery process outlined by Kosslyn (1994), that is, generation/formation, maintenance, and transformation of images (Williams & Cumming, 2011), a different questionnaire may be more appropriate to use if vividness is the main dimension of interest rather that ease of imaging or imagery ability in general.
Despite demonstrating different types of validity in the present program of work, other types of validity are yet to be established using the EIQ. These include test re-test reliability, incremental validity, and predictive validity as well as further construct validity by comparing the EIQ to other imagery ability questionnaires. It is important that future research establish whether the EIQ is able to demonstrate these types of validity to ensure that it is appropriate for use during interventions (including interventions to improve imagery ability).
In addition to the aforementioned avenues of future research resulting from the emergence of the EIQ, studies can now examine the potential moderating effects of imagery ability, proposed by the revised applied model of deliberate imagery use (Cumming & Williams, 2012) in nonathletes due to the EIQ’s capacity to assess different types of imagery. The EIQ can also be used prior to imagery interventions involving EIQ-related content to gain an indication of participant’s baseline imagery ability and thus the likely benefits of an imagery intervention. This has potential benefits for clinical interventions which involve imagery components as part of treatment and rely on the assumption that participants have the ability to image content (e.g., Holmes et al., 2007, 2016; Morina et al., 2017; Pearson et al., 2013; Stopa, 2021). We propose that ease of imaging these different subscales is not a stable disposition, but one that can be improved though imagery practice or training (Cumming et al., 2017). As such, the EIQ could also be used to determine whether imagery training to increase grit and positive affect imagery ability, or whether training to rescript negative images can be more or less effective depending on the ease or difficulty of imaging negative affect and relent content.
In conclusion, the present investigation created and validated the EIQ, an imagery ability questionnaire that measures positive and negative content related to adverse situations and emotions (i.e., grit, relent, positive affect, and negative affect imagery ability) in nonathlete populations. Findings demonstrated a good four-factor model replicated in four data sets. Concurrent validity was shown through comparing the EIQ to the SIAQ, as well as other theoretically associated variables. Future work should continue to validate the EIQ through other means such as examining its predictive and incremental validity as well as its test–retest reliability. However, findings suggest use of the EIQ would be beneficial in intervention work using imagery to assist emotional disorders and coping with stress or adverse situations.
Supplemental Material
sj-docx-1-asm-10.1177_10731911241260233 – Supplemental material for Development and Validation of the Ease of Imagery Questionnaire
Supplemental material, sj-docx-1-asm-10.1177_10731911241260233 for Development and Validation of the Ease of Imagery Questionnaire by Sarah E. Williams, Thomas A. Fergus and Annie T. Ginty in Assessment
Footnotes
Declaration of Conflicting Interests
The author(s) declared no potential conflicts of interest with respect to the research, authorship, and/or publication of this article.
Funding
The author(s) received no financial support for the research, authorship, and/or publication of this article.
Supplemental Material
Supplemental material for this article is available online.