
Abstract
Alexithymia is defined as the inability of persons to describe their emotional states, to identify the feelings of others, and a utilitarian type of thinking. The most popular instrument to assess alexithymia is the Toronto Alexithymia Scale (TAS-20). Despite its widespread use, an ongoing controversy pertains to its internal structure. The TAS-20 was originally constructed to capture three different factors, but several studies suggested different factor solutions, including bifactor models and models with a method factor for the reversely keyed items. The present study examined the dimensionality of the TAS-20 using summary data of 88 samples from 62 studies (total N = 69,722) with meta-analytic structural equation modeling. We found support for the originally proposed three-dimensional solution, whereas more complex models produced inconsistent factor loadings. Because a major source of misfit stems from translated versions, the results are discussed with respect to generalizations across languages and cultural contexts.
Alexithymia—composed of the Greek a = lack, lexis = word, and thymos = mood or emotion—can be literally translated with the inability to read and express emotions. The term was coined by the psychotherapists Sifneos and Nemiah to summarize symptoms they noticed in patients with psychosomatic illnesses (Apfel & Sifneos, 1979; Nemiah & Sifneos, 1970; Sifneos, 1973). As suggested by the etymology, the authors were struck by the incapacity of many of their patients to express or describe their feelings or the emotional states of others. They also noticed that these patients exhibited a rather utilitarian type of thinking which links to another psychoanalytic concept, namely that of operatory thinking. “La pensée opératoire” (operatory thinking) was introduced by the French psychoanalysts Marty and M’Uzan (1963) to characterize a mundane, unimaginative, and utilitarian type of thought processing. Thus, the clinical picture of alexithymia combines two strands: the emotional deficits to describe, to recognize, and distinguish between feelings, and the cognitive inability to go beyond a utilitarian and pragmatic view. Alexithymia itself is not a psychiatric disorder that has been codified in international classification systems such as the DSM-5 or the ICD-10. Nonetheless, there are many psychiatric disorders overlapping with alexithymia. While the prevalence of alexithymia in the general population is about 10% (Franz et al., 2008; Honkalampi et al., 2000; Mattila et al., 2008), the prevalence is significantly elevated for several psychiatric disorders highlighting the importance of the construct: about 60% in anorexia nervosa and bulimia nervosa (Cochrane et al., 1993; Corcos et al., 2000), 27% up to 50% in major depressive disorder (Leweke et al., 2012), 34% in panic disorder (Cox et al., 1995), 50% in substance abusers (Taylor et al., 1990). Moreover, alexithymia is also associated with some personality disorders. For example, Spitzer et al. (2005) characterized high-alexithymic patients as cold, hostile, and socially avoidant. Not only overlaps with psychiatric diseases were reported but also links with a wide set of physical illnesses ranging from inflammatory bowel disease (30%, Iglesias-Rey et al., 2012) to Parkinson’s disease (21%, Costa et al., 2010). However, the cited prevalence rates are point estimates of individual studies with the typically small and selective samples (e.g., geographical, age distribution, etc.).
The construct of alexithymia is more strongly tied to a specific measurement instrument than almost any other—the Toronto Alexithymia Scale (TAS-20, Bagby et al., 1994), even though there are other instruments that have a similar scope such as the Bermond–Vorst Alexithymia Questionnaire (BVAQ, Vorst & Bermond, 2001) or the Perth Alexithymia Questionnaire (PAQ, Preece, Becerra, Robinson, Dandy, & Allan, 2018). As one of the first self-report measures for alexithymia, the TAS-20 has clearly contributed to the popularization of the construct worldwide. However, it has also often been criticized for its internal structure (e.g., Haviland & Reise, 1996; Kooiman et al., 2002), its reliability (e.g., Gignac et al., 2007), and validity (e.g., Leising et al., 2009; Marchesi et al., 2014). Despite these substantive criticisms, the TAS-20 is a popular measure which is used in many clinical contexts. A large number of studies was devoted to the question of the psychometric quality and the dimensionality of the questionnaire, resulting in a vivid cycle of proof and counterproof of a specific factor solution (e.g., Bagby et al., 2007; Gignac et al., 2007; Kooiman et al., 2002; Meganck et al., 2008). The present study aims to summarize the available findings meta-analytically and shed more light on potential sources of model misfit. To do so, we take a closer look at the measurement invariance of the TAS-20 across different language versions and the clinical status of patients and nonpatients.
The Toronto Alexithymia Scales
The initial version of the TAS consists of 26 items with an equal number of negatively and positively keyed items to control for acquiescence (Bagby et al., 1986; Taylor et al., 1985). Factor analysis yielded a four-factor solution for the TAS-26 describing (a) the ability to identify and distinguish between feelings and bodily sensations, (b) the ability to describe feelings, (c) daydreaming, and (d) external-oriented thinking (EOT). Subsequently, a shortened version was created, the TAS-R (Taylor et al., 1992) with 23 items and an intended two-dimensional structure. Almost at the same time, the authors proposed a slightly reduced version, the TAS-20 (Bagby et al., 1994), which had better psychometric properties than the other versions of the TAS series. By now, 25 years after its initial presentation, the TAS-20 is the most popular measure (Bagby et al., 2020). The scale was designed to assess the three factors: (a) difficulty identifying feelings (DIF), (b) difficulty describing feelings (DDF), and (c) EOT. However, in the long history of its application, alternative factor structures have been proposed for the TAS-20 that we will shortly review in the following. The models are sorted from simple to complex (see Figure 1).
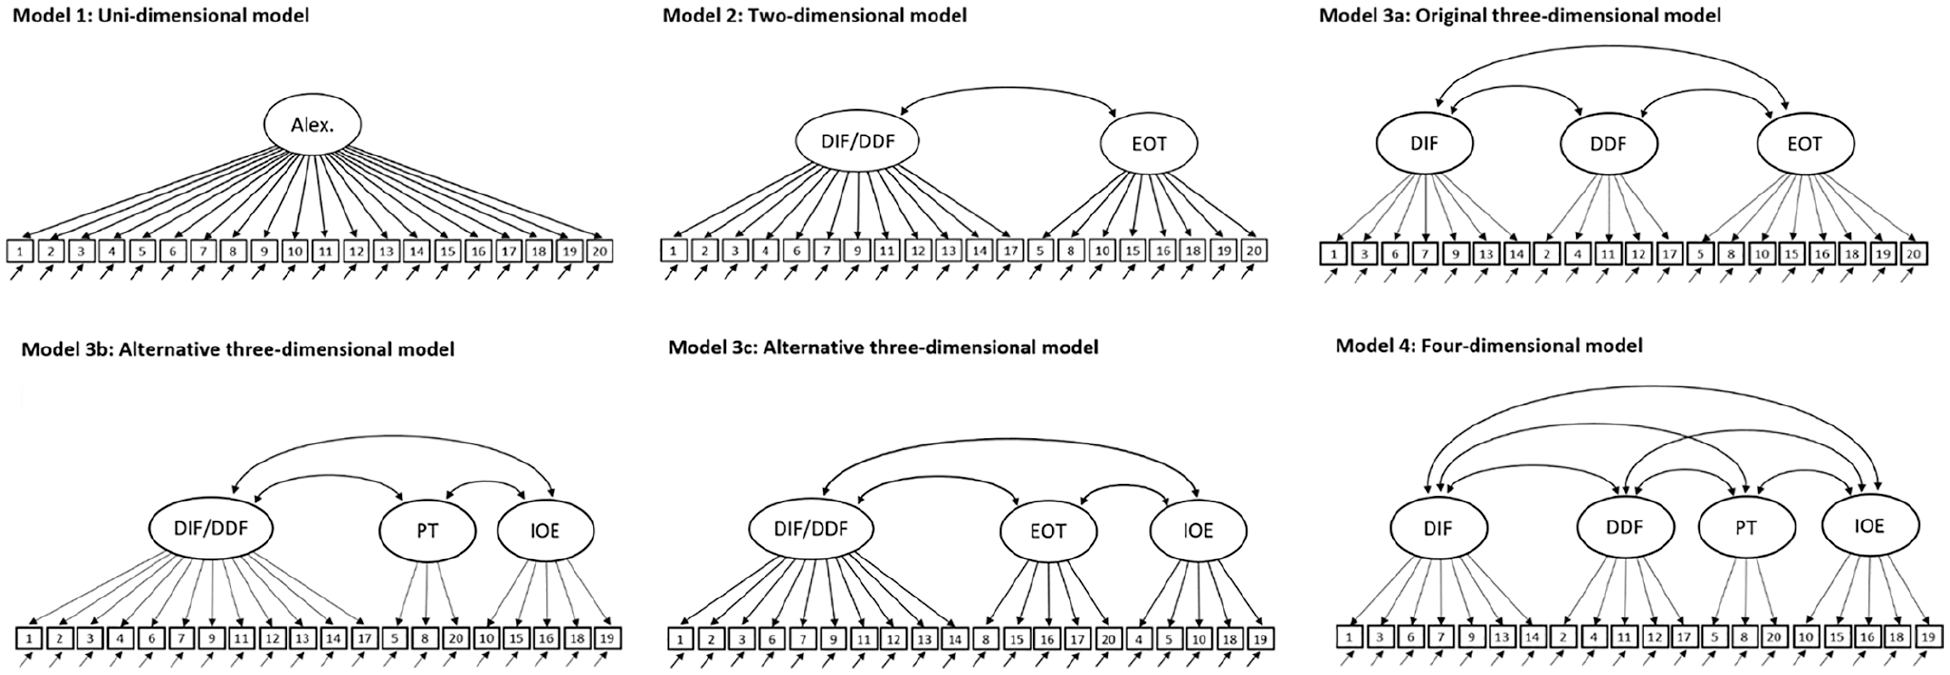
Competing measurement models for the TAS-20.
The unidimensional model is included as a point of comparison, but is neither theoretically nor empirically supported. Some researchers argued that the two factors of identifying and describing feelings collapse into a single factor (Erni et al., 1997; Kooiman et al., 2002; Loas et al., 1996) since both aspects are highly correlated and several items load significantly on both factors. This would result in a two-dimensional structure for the TAS-20 with a factor for difficulties in dealing with feelings (DIF/DDF) and EOT (Model 2). As a side note, this two-dimensional structure was also the basis of the TAS-R, which then developed into the TAS-20 (Taylor et al., 1992). However, a two-dimensional structure has mainly been found for translated versions in nonpatient samples (Erni et al., 1997; Loas et al., 1996), which might also point to a cultural or translation bias (van de Vijver & He, 2016).
The originally intended three-dimensional structure by Bagby et al. (1994; Model 3a) has been replicated in many studies (Besharat, 2007b; Joukamaa et al., 2001; Meganck et al., 2008; Parker et al., 2003; Parker et al., 2005), although the criteria used to evaluate model fit were sometimes inadequate (e.g., Bressi et al., 1996; Praceres et al., 2012; Seo et al., 2009). This also applies to a recently introduced informant version (Bagby et al., 2021) and many translated versions of the original TAS-20: In 2003, Taylor et al. (2003) conducted a narrative review of the 18 translated versions existing at that time (e.g., a German, Hindi, and Greek version) and concluded that there was “strong support for the generalizability of the three-factor structure of the scale” (p. 281). Since then, 10 more languages have been added (Bagby et al., 2020). Although most studies on the factor structure of the TAS-20 relied on student or healthy adult samples, there is ample evidence that the DIF-DDF-EOT structure can also be found in clinical samples around the world (e.g., Besharat, 2008b; El Abiddine et al., 2017; Loas et al., 2001), but there are exceptions (e.g., Thorberg et al., 2010). Throughout its long history, also the shortcomings of the three-dimensional solution were repeatedly mentioned, for example, the low factor saturation of the EOT factor (e.g., Gignac et al., 2007; Haviland & Reise, 1996).
Besides the originally three-dimensional model, two alternative three-dimensional models have been proposed. In one model (Model 3b), Müller et al. (2003) combined the two factors dealing with feelings (DIF/DDF) and split the EOT factor into two separate factors: Pragmatic thinking (PT) and the lack of (subjective significance or) importance of emotions (IOE). The PT factor captures an unimaginative and utilitarian type of thought processing, originally labeled “pensée opératoire” (Marty & M'Uzan, 1963). The IOE factor deals with “psychological mindedness,” which describes the capacity for self-examination, self-reflection, and introspection. EOT resembles other constructs such as “emotions to facilitate thought” (Mayer et al., 2003) or “emotional utilization” (Austin et al., 2004). In another three-dimensional model (Model 3c, Khosravani et al., 2019; Popp et al., 2008), the factors dealing with feelings still collapse into one, while the remaining items are divided into a core factor of EOT and a factor dealing with flattening of emotions. Even though the labeling of the factors is identical, the allocation of items to factors differs considerably in comparison with the original setup (for more information, see also Figure 1). In general, surprisingly little has been said in the literature about the content of these more nuanced EOT subfactors rendering the assignment mainly data-driven with the risk of capitalizing on chance.
The four-dimensional model (Model 4a; Müller et al., 2003) is a blend of the original and an alternative three-dimensional model (i.e., Model 3a and 3b), in which two factors each describe the handling of feelings (DIF and DDF) and EOT (PT and IOE). This model has received some support besides the original conceptualization (e.g., Craparo et al., 2015; Meganck et al., 2008; Zhu et al., 2003). Sample characteristics such as mean age (Müller et al., 2003), psychiatric status as well as different translations or cultural backgrounds (e.g., Preece, Becerra, Robinson, Dandy, & Allan, 2018) have been discussed as an attempt to explain the inconclusive results, especially for the three- versus the four-dimensional model, but such explanations are often post hoc attempts. Despite the plausible argument that the items map differently in clinical populations than in the general population, most studies showed no differences at all (e.g., Loas et al., 2001; Meganck et al., 2008), although measurement invariance testing in terms of a multigroup confirmatory factor analysis is sparse (for exceptions, see Meganck et al., 2008; Preece, Becerra, Robinson, Dandy, & Allan, 2018).
In several publications a bifactor model was used to describe the TAS-20 (Carnovale et al., 2021; Gignac et al., 2007; González-Arias et al., 2018; Reise et al., 2013; Tuliao et al., 2020; Yun et al., 2019). Besides a general factor that reflects the common variance of all items, specific factors are included to cover additional variance among item sets. The general and the specific factors are uncorrelated with each other. Bifactor models were initially developed in intelligence research (Holzinger & Swineford, 1939), but have recently experienced a renaissance as an important structural representation of multidimensionality beneath a unidimensional construct (Reise, 2012; Reise et al., 2010). In the present case, a general factor of alexithymia (Model 5) represents the target construct, while the nested factors describe specific facets such as EOT. The bifactor is a more flexible version of a high-order factor model in which the formerly first-order factors become the nested factors (Mulaik & Quartetti, 1997) by means of the Schmid–Leiman decomposition (Schmid & Leiman, 1957). The evidence for the appropriateness of the bifactor modeling is mixed, with some studies in favor (e.g., Carnovale et al., 2021; Gignac et al., 2007) and others against (e.g., Tuliao et al., 2020).
A quarter of the TAS-20 items is reversely keyed, that is, high endorsement indicates a low trait level (e.g., “I am able to describe my feelings easily”). To improve model fit, several authors (e.g., Gignac et al., 2007; Meganck et al., 2008; Preece, Becerra, Robinson, Dandy, & Allan, 2018; Tuliao et al., 2020; Watters et al., 2016) suggested specifying a method factor that in addition to the focal dimensions of alexithymia captures a conceptually distinct trait representing a respondent’s response consistency. And indeed, the addition of a method factor usually improved the model fit significantly (e.g., Preece, Becerra, Robinson, Dandy, & Allan, 2018). Such method effects for negatively keyed items are not specific for the TAS, but have repeatedly been reported for many self-report scales (e.g., Gnambs & Schroeders, 2020) and seem to capture a general test-taker’s response style (e.g., DiStefano & Motl, 2006). However, what complicates modeling as a pure method artifact in the case of TAS is that four of the five negatively keyed items load on the EOT factor. Bagby et al. (2007) suggested that the occasionally reported difficulties with this factor may be attributed to item formulation. But Preece, Becerra, Robinson, Dandy, and Allan (2018) showed that this reasoning may not be valid, because the factor loadings were higher on the method factor than on the supposed content factor.
The Present Study
To address the still ongoing controversy surrounding the structure of the TAS-20, we used meta-analytic structural equation modeling (MASEM; Cheung, 2005a, 2005b; Cheung & Cheung, 2016). MASEM is a two-stage approach: Initially, the correlation coefficients between the item scores are extracted from primary studies, which are subsequently meta-analytically combined into a pooled correlation matrix. Then, confirmatory factor models are fitted to the pooled correlation matrix. Using MASEM, the present research attempts to address three major research questions:
The first question deals with the optimal factor analytic representation of the TAS-20. Although the intended three-dimensional structure has been supported in previous research, it has also been pointed out that past research on the dimensionality of the TAS-20 “has arguably used liberal standards of model fit” (Gignac et al., 2007, p. 254). In addition, alternative factor structures were only in part systematically investigated (e.g., Preece, Becerra, Robinson, Dandy, & Allan, 2018). With some exceptions (e.g., Bagby et al., 1994), the examinations relied on selective and small samples. In contrast, MASEM provides the opportunity to combine and weight the mixed previous findings in the literature, so that more robust statements about the dimensionality of the TAS-20 can be made beyond a specific sample. The confirmatory approach of MASEM also provides the opportunity to empirically test the original conceptualization of the construct alexithymia. Once Kurt Lewin (1952, p. 169) aptly wrote “there is nothing more practical than a good theory.” Taking this bon mot seriously, the question of the dimensionality of the TAS-20 and the theoretical assumptions that led to its construction, also have implications for clinical practice and should promote further research. Either the intended structure is replicated, supporting the original conceptualization of the construct and strengthening the use of the TAS-20 as a standard instrument for the assessment of alexithymia. Or, in case the assumed dimensionality is not empirically supported, the measure has to be refined or, even more fundamentally, the theoretical conceptualization of alexithymia must be revised.
A related question is whether the psychometric quality of the measurement instrument can be improved by introducing additional method factors such as an orthogonal method factor for the reversely coded items. Is the ambiguous status of the EOT factor (i.e., split into two factors and low factor saturation in general) related to the unbalanced distribution of reversely coded items per factor? The psychometric aspects are also significant from a practical point of view because the correct modeling reflects on how to best derive person estimates that enable a valid clinical assessment (see also Reise et al., 2013). The magnitude of factor correlations can also indicate if it is appropriate to rely on a sum score for the complete alexithymia scale.
Finally, we examine measurement invariance across potential sources of heterogeneity in the meta-analytic results. Since the TAS-20 has been often studied in nonclinical samples, the question arises whether the factor structure between patients and nonpatients varies. Early on, questions arose about the comparability of the instrument depending on the psychiatric status. For example, Haviland and Reise (1996) reported that a three-dimensional model fitted best in a psychiatric and a student sample, but the allocation of items to factors largely differed resulting in different interpretations of the factors. With respect to measurement invariance of the TAS-20 across translations, a narrative review of 19 studies concluded that there was “strong support for the generalizability of the three-factor structure of the scale” across languages and cultures (Taylor et al., 2003, p. 281). However, only fit indices concerning the three-factor structure were compared without systematically studying alternative models. Thus, we study bias at the item level that might be introduced to the measurement by adapting the measure to other languages and cultures.
Method
Meta-Analytic Data Base and Coding
The search for primary studies reporting on the factor structure of the TAS-20 included major scientific databases (PubMed, PsycArticles, PsycINFO, and PSYNDEX), data repositories of the open science framework (OSF), and Google Scholar. In December 2020, we identified 7,739 potentially relevant journal articles and data archives using the Boolean expression (TAS-20 OR “Toronto Alexithymia Scale”) AND (“factor analysis” OR “factor structure” OR “principal component analysis” OR “item analysis”). Additional studies were derived from the references of all identified articles (“rolling snowball method”). After reviewing the titles, abstracts, and, subsequently, tables of these manuscripts, we made a full-text review of 157 studies. We retained all studies that met the following criteria: (a) In the study the original (or a translated version) of the TAS-20 was administered (i.e., all studies that used the TAS-26 or TAS-23 were excluded, despite an overlap in items; informant reports were also not considered), (b) the publication (or data) was published since the initial publication by Parker et al. (1993) 1 , and (c) the necessary item-level statistics were available including the loading pattern from an exploratory (or confirmatory) factor analysis, the full covariance (or correlation) matrix, or raw data. If oblique factor rotations were used, we only considered studies that also reported the respective factor correlations. In case the raw data of a study was available, we calculated the respective covariance matrix. Moreover, we excluded studies that reported the results of a factor analysis that was jointly conducted with items of another measure besides the TAS-20. This literature search and screening process resulted in 62 studies with 88 samples, which could be included in our meta-analysis (see Figure 2, for an overview).
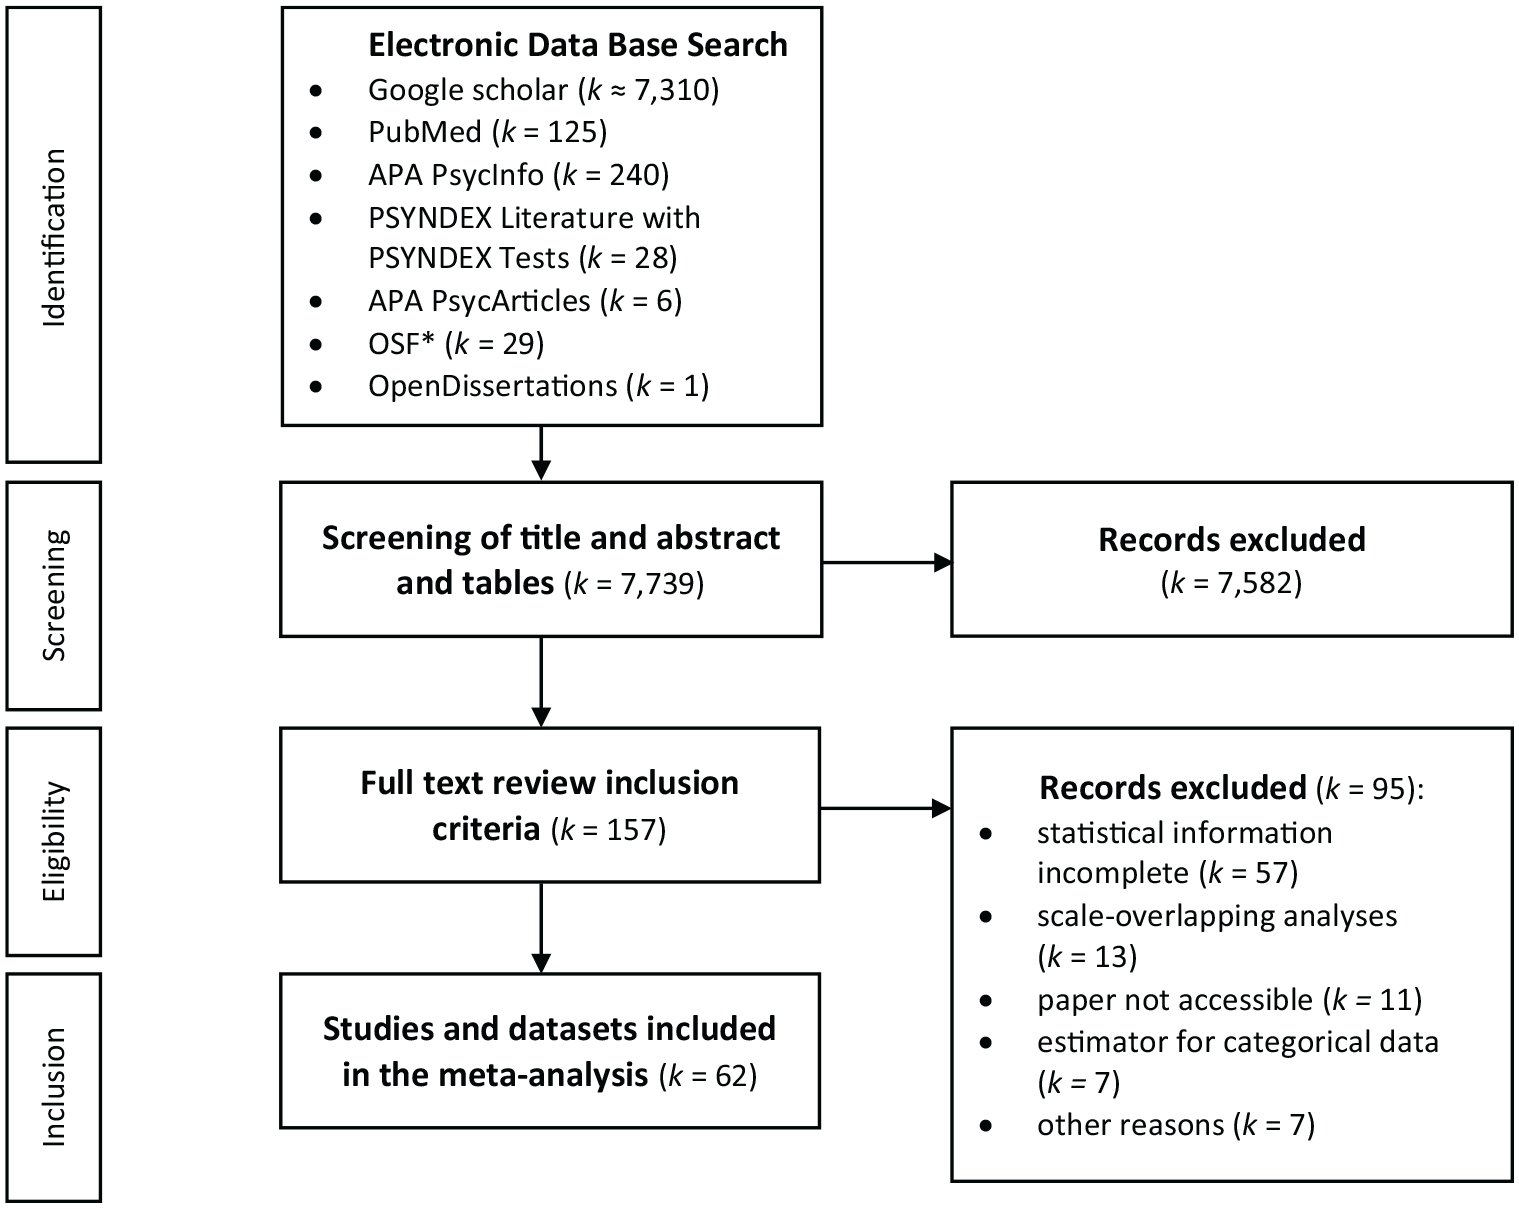
Overview of the Literature Search Process.
We defined all relevant information to be extracted from each publication accompanied with relevant coding guidelines (e.g., response format) in a coding protocol, which is accessible in the online supplement. The focal information pertained to factor loading patterns and correlation matrices of the 20 items included in the TAS-20. If different factor solutions for one and the same sample were available, we used the factor loading pattern with the highest number of factors. In addition, descriptive information was collected on the sample (e.g., sample size, country, mean age, percentage of female participants), the publication (e.g., publication year), and the reported factor analysis (e.g., factor analytic method, type of rotation). All studies were coded by the first author. To evaluate the coding process three-quarters of the studies were independently coded a second time by the second author. Intercoder agreement was quantified using Krippendorff’s alpha (Krippendorff, 2013), which indicate good agreement for values larger than .80. Overall the intercoder agreement was excellent with values for study characteristics ≥.90 and for the factor analytic results of the primary studies of .98.
MASEM Procedure
We examined the factor structure of the TAS-20 with MASEM, which is the integration of two techniques with a long-standing tradition, but with limited exchange between both disciplines—meta-analysis and structural equation modeling (Cheung, 2013; Cheung & Chan, 2009; Jak, 2015). In the first step of MASEM, the item-level correlation matrices were pooled using a fixed-effects meta-analysis, 2 because simply taking a pooled correlation matrix as input for a structural equation model is inaccurate (see Cheung & Chan, 2005a, for a full account). In more detail, we used the zero-order Pearson product-moment correlations between the items of the TAS-20 as effect size measures (for a graphical representation of the correlation matrix of all correlation matrices, see online supplement, Figure OS 1). Three studies provided the raw data in an online repository. Most studies, however, reported the factor pattern matrices from exploratory (27 samples in 25 studies) or confirmatory factor analysis (58 samples in 35 studies). Following Gnambs and Staufenbiel (2016), we calculated the model-implied item-level correlations based on the reported factor pattern matrices. Few studies neglected to report the full factor loading pattern and excluded small loadings falling below .40. In this case, a value of zero was imputed for the missing factor loadings, because Monte Carlo simulations indicated that this approach results in unbiased estimates of meta-analytic factor patterns (Gnambs & Staufenbiel, 2016).
In the second step of MASEM, the derived pooled correlation matrix was subjected to factor analytic models. We first report the results of an exploratory factor analysis (EFA). Following the recommendations of Auerswald and Moshagen (2019), we used several criteria to decide on the number of factors to retain, including Velicer’s (1976) minimum average partial (MAP) test, Horn’s (1965) parallel analysis, Bayesian information criteria (BIC), and sequential χ2 model tests. Moreover, competing measurement models were tested using confirmatory factor analysis with a weighted least square estimator using the asymptotic variance–covariance matrix of the pooled correlations from the first step as weights (Cheung & Chan, 2005a). In line with conventional standards (see Schermelleh-Engel et al., 2003), we used the following cutoff criteria: Comparative fit index (CFI) ≥ .95, root mean square error of approximation (RMSEA) ≤ .08, and a standardized root mean square residual (SRMR) ≤ .10 were interpreted as “acceptable” and models with CFI ≥ .97, RMSEA ≤ .05, and SRMR ≤ .05 as “good” fit.
Software and Open Practices
The exploratory factor analyses were conducted using the psych package version 2.0.12 (Revelle, 2020). Confirmatory factor analyses and pooling correlations were done with the R package metaSEM (version 1.2.5; Cheung, 2020), which relies on OpenMx (version 2.18.1, Neale et al., 2016). To promote transparency and reproducibility of our analyses, all coded data and analyses scripts are provided in an online repository at https://osf.io/uxtks/.
Results
Study Characteristics
The meta-analysis included 88 samples nested in 62 studies that were published between 1994 and 2020. Median sample size was Mdn = 327 participants (total N = 69,722; Min = 99; Max = 12,706) with approximately 54.4% women and a reported mean age of 29.2 years (SD = 10.0). Because the TAS-20 has been translated in many different languages (Bagby et al., 2020), the present meta-analysis included data from 25 different countries, with most samples coming from Canada (20.5%), the United States (10.2%), Australia, Germany, and Iran (each 6.8%). The most frequently used translated versions (with parentheses giving the number of samples) were in French (8), German (7), Farsi (6), Portuguese (5), and Japanese (5), for which measurement invariance to the original English version (34) will be considered in more detail. The complete list of languages covered in this meta-analysis also includes Turkish (4), Spanish (4), Korean (3), Dutch (3), Italian (2), Finnish (2), Chinese (2) 3 , Swedish (1), Hindi (1), and Arabic (1). Three-quarters of the samples were nonclinical (k = 66), consisting of mainly undergraduate university students. Twenty samples were clinical-psychiatric samples of a wide spectrum (e.g., somatoform disorder, anxiety, substance use disorders). The characteristics of all samples are given in the coding sheet in the online repository.
Exploratory Factor Analyses
The different criteria that can be used to determine the number of factors in EFA (Auerswald & Moshagen, 2019; Ruscio & Roche, 2012) came to rather different conclusions: The MAP procedure suggested two factors, Horn’s parallel analysis four factors, the sample-size adjusted BIC achieved a minimum with five factors, and the sequential χ² model test recommended extracting six factors. This heterogeneity may indicate that these approaches were not designed for such large sample sizes, that is, depending on the criterion even negligible improvements of consecutive factor solutions were considered significant. Instead of presenting a single factor solution, we offer the results of bass-ackwards analyses (Goldberg, 2006) to better understand the unfolding of the hierarchical structure of the TAS-20 (see Figure 3). This method has been mostly applied in personality research (e.g., Wright et al., 2012) and involves the estimation of a series of orthogonal principal component analyses with an increasing number of components. Please note that only orthogonal rotations produce interpretable between-level factor score correlations, which can inform about the structure of the TAS-20 at different levels of abstraction. The one-component solution explained only 26% of the total variance, and seven items had a factor loading below .30, indicating distinct facets of alexithymia. The first important distinction concerned dealing with feelings (DIF/DDF) and thinking style (EOT). At the third level, the EOT component was split up into positively and negatively keyed items. Only at the last level given in Figure 3, the broad DIF/DDF component is separated into DIFs and DDFs. In summary, three central findings can be extracted from the bass-ackwards analyses: (a) alexithymia is a heterogeneous, multifaceted construct, (b) the EOT facet breaks down into equal parts of positively and negatively keyed items which is not paralleled by a content-based distinction, and (c) the two facets DIF/DDF are substantially related and might even collapse.
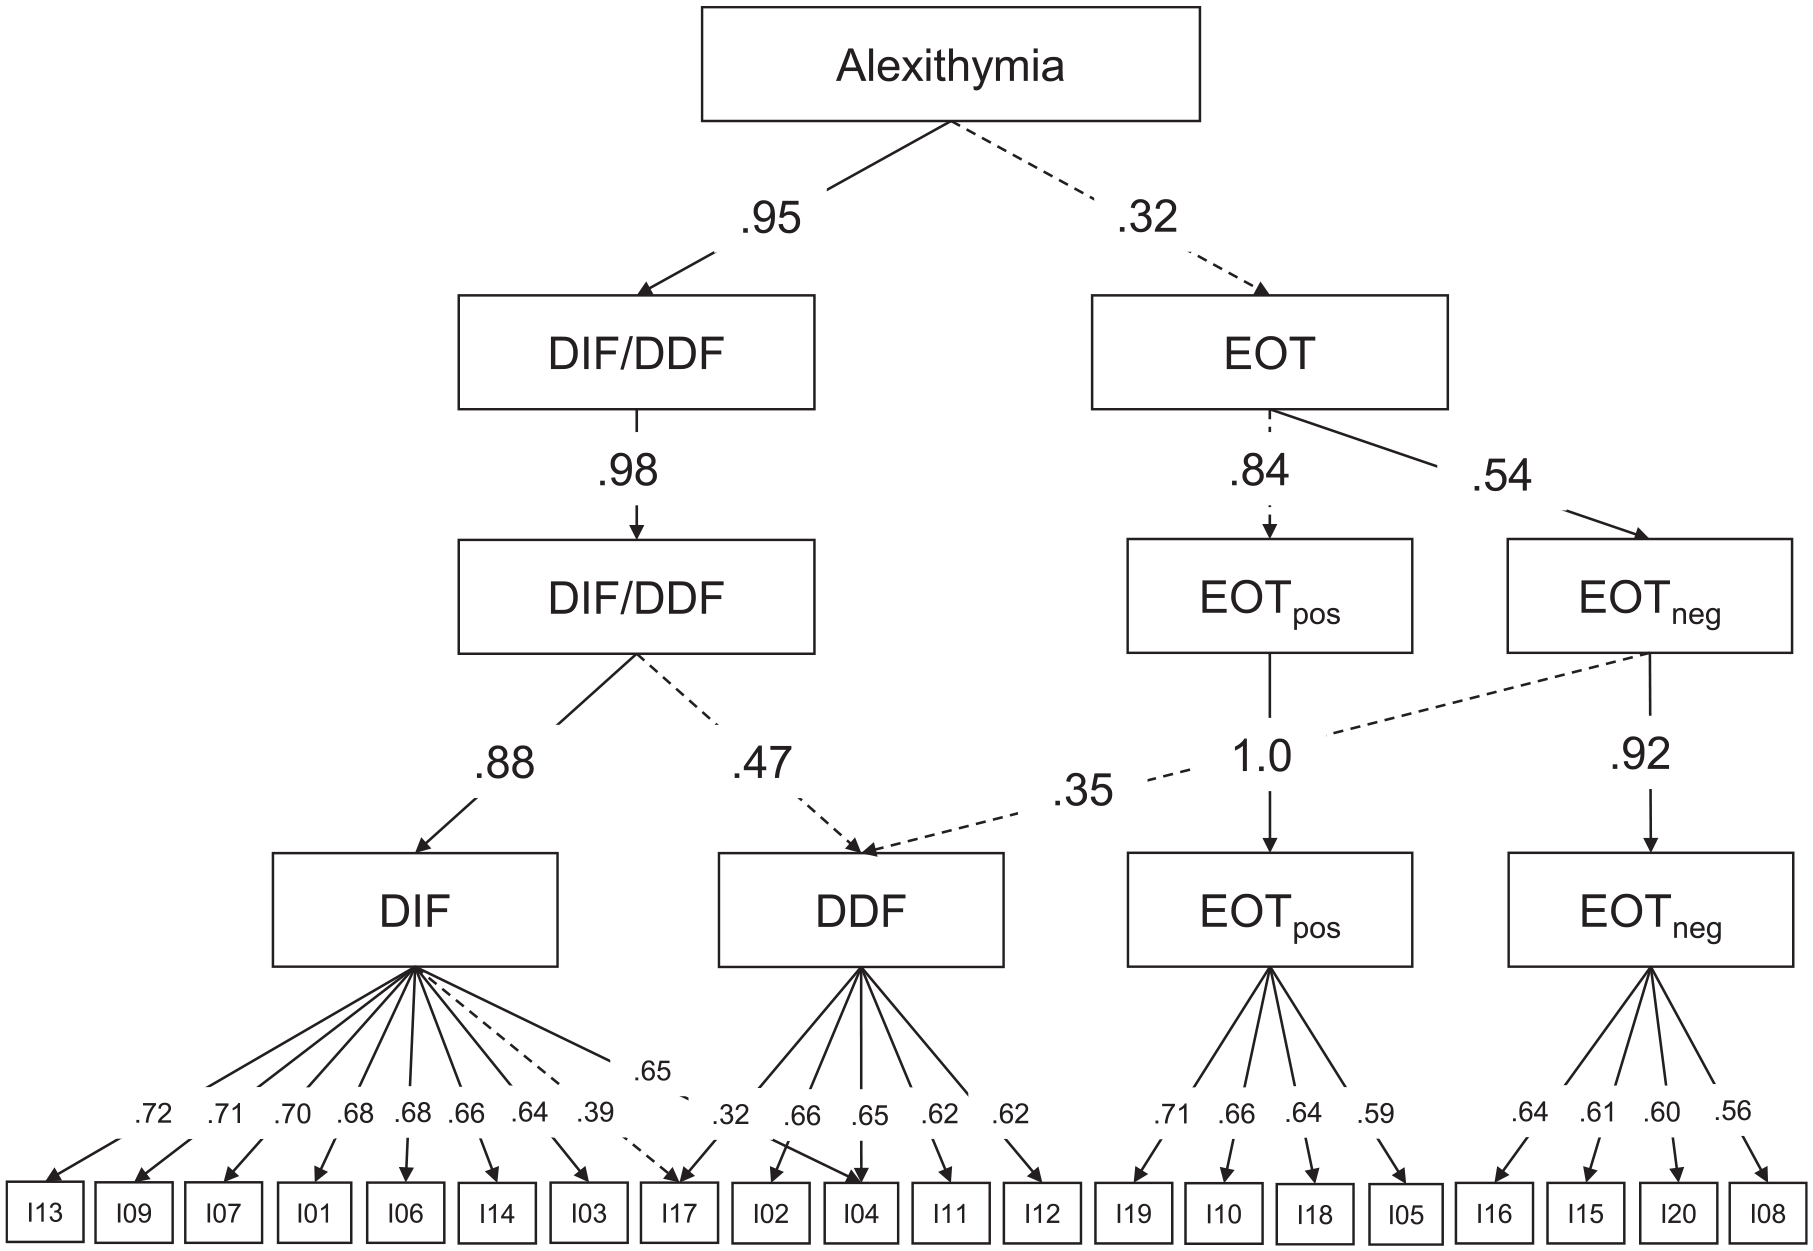
Bass-ackward analyses of the pooled correlation matrix.
Confirmatory Factor Analyses
To compare the different theoretical ideas concerning the structure of the TAS-20, we estimated nine measurement models (model fits are given in Table 1, all parameter estimates are provided in the online supplement, Table OS 1). The confirmatory factor analyses showed that the original three-dimensional model proposed by Parker et al. (1993) and the four-dimensional model which has also received substantial support in the literature (e.g., Gignac et al., 2007; Meganck et al., 2008) fitted the data best, although the CFI was below the threshold of .95. The difference between the two models is that the factor for EOT is split into the two facets PT and IOE. Comparing both models, there was strong evidence for keeping the original model, because it is more parsimonious and the correlation between EOT facets was very high (r = .94), which is in line with previous research (Meganck et al., 2008). The correlation between the factors of the three-dimensional solution was highest between DDF and DIF (r = .77), and moderate for the correlations with the EOT factor (rDDF/EOT = .47 and rDIF/EOT = .32). The reliability estimates (i.e., ω according to McDonald, 1999) were ωDIF = .84, ωDDF = .75, and ωEOT = .62. The split of the EOT factor was not accompanied by an improvement in reliability due to the small size of the item sets (ωIOE = .56 and ωPT = .31). All other measurement models were not sufficiently supported by the empirical data. This also applied to the bifactor model. Although the model fit indices indicated good fit, the pattern of factor loadings was problematic with many low factor loadings on the general factor, close-to-zero factor loadings on the specific DDF# factor, 4 and larger loadings on the EOT# factor than on the general factor. Because simulation studies showed that low factor loadings invalidate traditional cutoffs used to evaluate model fit (Heene et al., 2011), the bifactor model does not adequately capture the dimensionality of the TAS-20. Such anomalous results of bifactor models are not uncommon and have led to the proposal of alternative bifactor representations with a reference factor (Eid et al., 2017). However, analyses with DDF as a reference factor did not rectify the problem of several low factor loadings (see Model 5b in Table OS 1 in the online supplement).
Fit Statistics for Different Confirmatory Factor Models of the TAS-20.
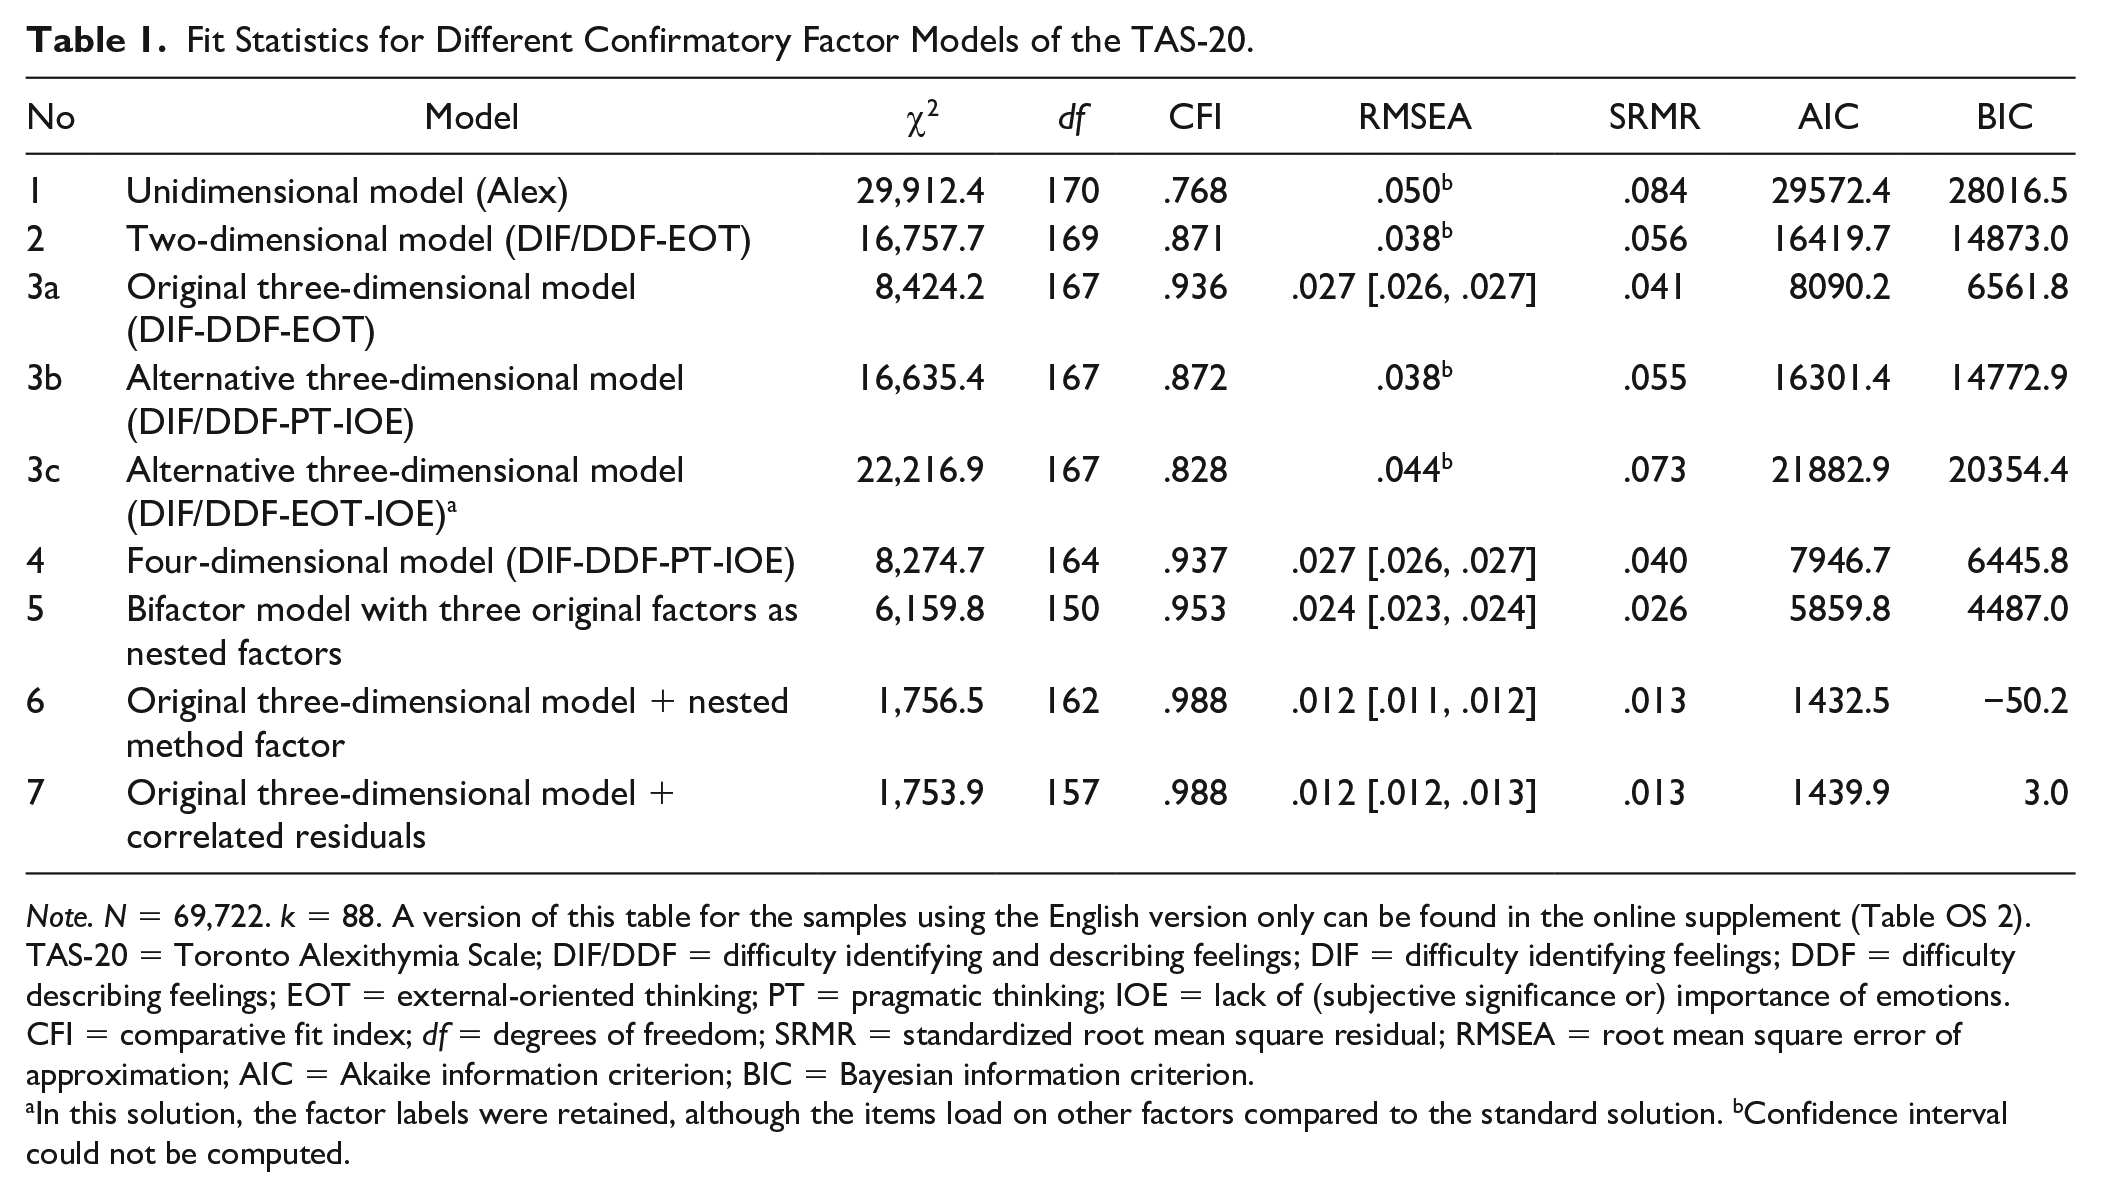
Note. N = 69,722. k = 88. A version of this table for the samples using the English version only can be found in the online supplement (Table OS 2). TAS-20 = Toronto Alexithymia Scale; DIF/DDF = difficulty identifying and describing feelings; DIF = difficulty identifying feelings; DDF = difficulty describing feelings; EOT = external-oriented thinking; PT = pragmatic thinking; IOE = lack of (subjective significance or) importance of emotions. CFI = comparative fit index; df = degrees of freedom; SRMR = standardized root mean square residual; RMSEA = root mean square error of approximation; AIC = Akaike information criterion; BIC = Bayesian information criterion.
In this solution, the factor labels were retained, although the items load on other factors compared to the standard solution. bConfidence interval could not be computed.
The TAS-20 includes a total of five negatively keyed items, of which four load on the EOT factor. A model that—in addition to the basic three-dimensional structure—introduced a nested method factor that captures that method-specific variance associated with the reverse item wording yielded a significant improvement in model fit (see Table 1). In the psychometric literature on the TAS-20, it has been reported that such a method factor model might be superior to other models (Meganck et al., 2008; Preece et al., 2021; for a more critical evaluation, see Gignac et al., 2007). However, taking a closer look at the loading pattern, we noticed that all negatively keyed EOT items loaded higher on their method factor than on the actual content factor. This pattern is due to the fact that half of the EOT items are negatively keyed, so that a clear instantiation of the factor is lacking. Differently put, the factor that was designed as a method factor also captured content variance, which blurs a clear separation between both sources of variance. As a last model, we estimated a model that included the three facets of alexithymia as well as residual correlations between all negatively keyed items. Such a model is also known as correlated trait correlated uniqueness model (Marsh & Grayson, 1995) and fitted the data well in terms of CFI and RMSEA (see Table 1). Residual correlations varied in the typical low range between .08 and .26 (Mdn = .16). However, even with this type of modeling, the factor loadings of the negatively keyed items on the EOT factor were rather small. Taken together, the results of the confirmatory factor models showed that the originally proposed three-factor structure provided the most consistent representation of the TAS-20 in terms of model fit, factor loading pattern, and factor correlations.
Measurement Invariance Testing
The TAS-20 has been translated into more than two dozen different languages including Arabic, Hebrew, and Mandarin (for an overview, see Bagby et al., 2020; Parker et al., 2003). In this meta-analysis, data from 15 languages (besides English) were included. In retrospect, it is striking that many of the alternative measurement models were proposed for other language versions, raising the question of whether systematic bias is introduced through translation or a different cultural context. To address this question, we estimated a multigroup MASEM for six language groups (Cheung & Chan, 2005b; Jak & Cheung, 2018). We included all languages for which at least five samples were available: English (34), French (8), German (7), Farsi (6), Portuguese (5), and Japanese (5). While studies administering the French or Farsi versions of the TAS-20 each used the same translation, most non-English language versions were based on different translations: For Portuguese and Japanese two different translations were available and in the German samples even three slightly different translations were administered—as far as this can be deduced from the available information and references. For most studies, however, the exact wording of the items was not available.
Table 2 shows the model fit of the original three-dimensional model for all language versions (ordered by the number of samples included). With a CFI close to .95 the English version (k = 34 samples) yielded a significantly better fit than analyses including all samples. In terms of model fit, the Farsi and the Portuguese version had an excellent fit, while all other language versions exhibited considerable misfit (see Table 2). Especially, the German version was not in line with the theoretical assumptions. Figure 4 shows the difference in the factor loadings between the original three-dimensional model for the English version (values in the first row) and its translated counterparts. Larger factor loadings in translated versions were erratic and rare, except for Item 5 (“I prefer to analyze problems rather than just describe them.”) that performed better in most of the translated versions, M(Δλ5) = .14. Smaller factor loadings were more common and for some translations substantial, especially when considering the absolute level of the factor loadings. These differences were most pronounced for Item 12 (“People tell me to describe my feelings more.” M(Δλ12) = −.11). Across the language versions, the mean absolute change in factor loadings was mainly small (see also second last column in Table 2). Taken together and bearing in mind the small number of samples included in the calculations, the original English and the translated Farsi and Portuguese versions yielded satisfactory results in terms of model fit. In contrast, the French, German, and Japanese versions deviated considerably from the English version. This finding is in line with Fukunishi et al. (1997), who reported on low factor correlations of the EOT factor for the Japanese version (see also ωEOT in Table 2). For German, there were at least three slightly different versions which might have contributed to the fact that for the German translations in particular alternative factor models have been proposed (Franz et al., 2001; Koch et al., 2015; Müller et al., 2003; Popp et al., 2008). For the French version, a previous study reported on strict measurement invariance across languages (Watters et al., 2016). But, the overall fit even of the configural model was unsatisfactory and, moreover, the invariance testing procedure was not correctly specified (see also Schroeders & Gnambs, 2020).
Comparison of Model Fit, Reliability Estimates, and Factor Loadings Across Languages.
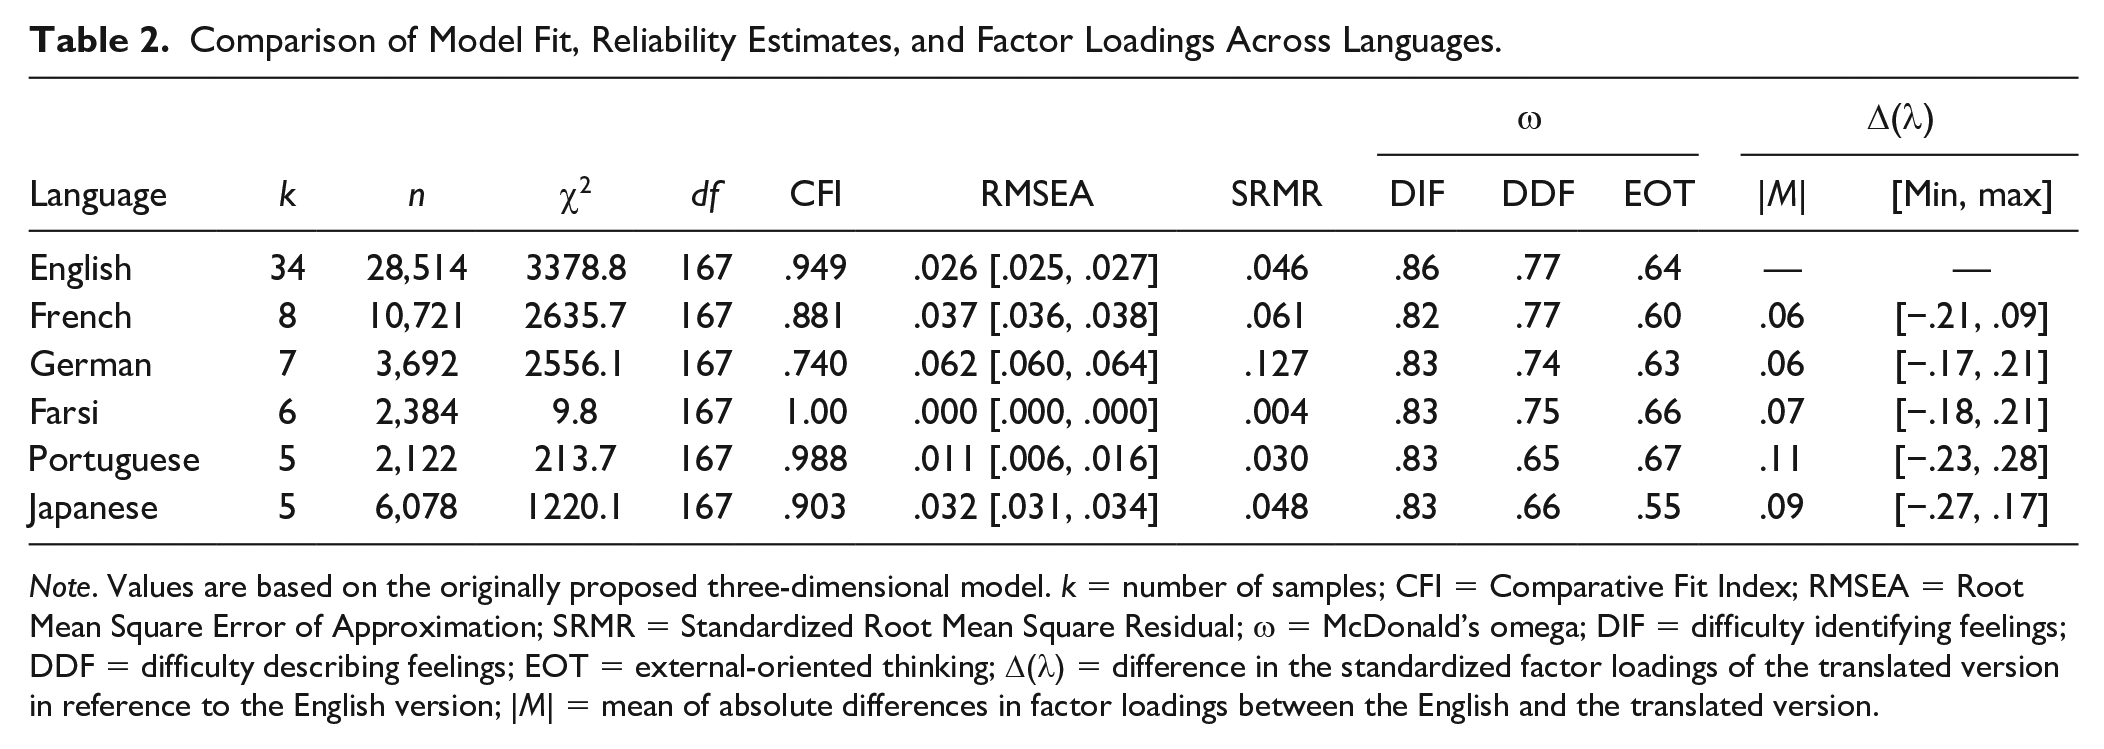
Note. Values are based on the originally proposed three-dimensional model. k = number of samples; CFI = Comparative Fit Index; RMSEA = Root Mean Square Error of Approximation; SRMR = Standardized Root Mean Square Residual; ω = McDonald’s omega; DIF = difficulty identifying feelings; DDF = difficulty describing feelings; EOT = external-oriented thinking; Δ(λ) = difference in the standardized factor loadings of the translated version in reference to the English version; |M| = mean of absolute differences in factor loadings between the English and the translated version.
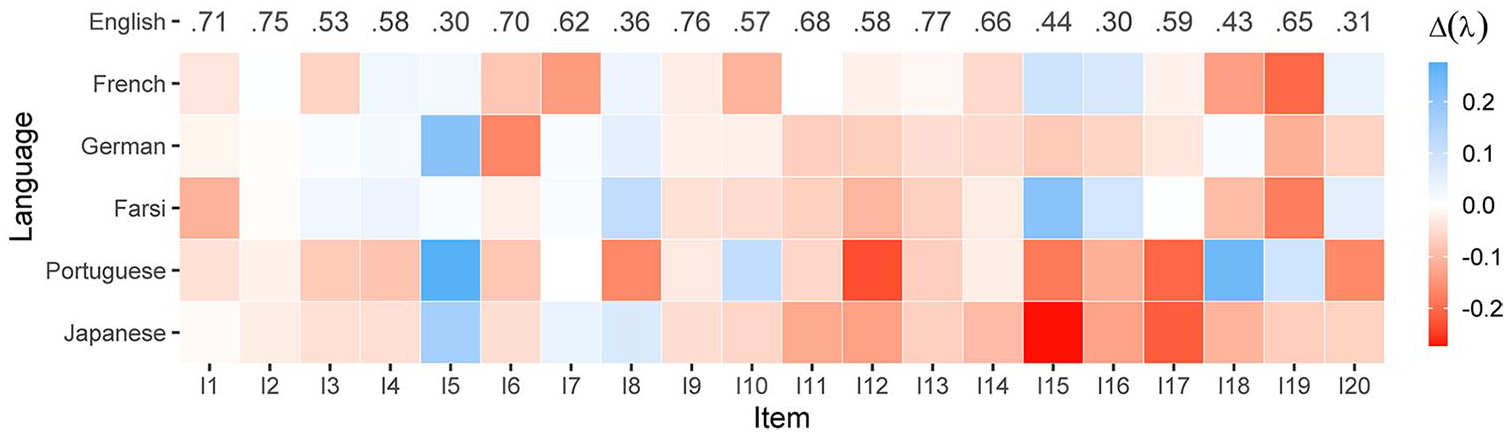
Differences in factor loadings between the English and five translated versions.
We also report the measurement invariance testing across psychiatric status. Because language or culture has a clear influence on the dimensional structure of the TAS-20, we constrained our analytical sample to the subset that used the English version (k = 34). Model fit was satisfactory in the nonpsychiatric sample (k = 29, n = 27,453, χ2 = 3,368.8, df = 167, CFI = .948, RMSEA = .026, SRMR = .048) and excellent in the patient sample (k = 5, n = 1,061, χ2 = 88.0, df = 167, CFI = 1.00, RMSEA = .000, SRMR = .026). A comparison of the factor loadings between patients and nonpatients showed mainly small differences (for all parameter estimates, see Table OS 3 in the online supplement)—except for Item 10, which belongs to the factor EOT (“Being in touch with my feelings is essential,” M(Δλ10) = .22 in favor of the clinical sample).
Discussion
Given the vast research literature on the dimensionality of TAS-20 and the alternative models that have been proposed, the present meta-analysis attempted to give an evidence-based verdict on the internal structure of the TAS-20: In line with its theoretical ideas (Bagby et al., 1994, 2020; Taylor & Bagby, 2020), the original three-dimensional structure describes the available data best. In contrast to the “liberal standards of model fit” (Gignac et al., 2007, p. 254) that have been used previously, at least for the English version meta-analytic evidence pointed to a good model fit for the original representation. This can also be seen as strong support for the original theory-driven conceptualization of the TAS-20. The alternative solutions that have been discussed try to substantiate an empirically found factor structure. On the one hand, these models proposed collapsing the factors that describe the handling of feelings and, on the other hand, splitting the more heterogeneous EOT factor, did not provide substantial improvements. Such post hoc adjustments might lead to a better model fit in a specific data set, but these solutions are seldom stable across different studies and samples. With this in mind, the theory-informed and confirmed three-dimensional structure of the TAS-20 is preferable over others. The results of the bass-ackwards analysis indicated that these alternative solutions blend into each other at different levels of granularity. Thus, the seemingly competing models for the dimensionality of the TAS-20 found in individual studies are better understood from a hierarchical perspective. Since the median of the samples’ sizes included in the present manuscript was 327 such diverging factor solutions might simply occur by chance because factor loadings tend to be highly unstable in smaller samples (e.g., N < 500; Hirschfeld et al., 2014). Moreover, factor solutions might also depend on sample characteristics such as age, educational level, or psychiatric disorder. In particular, the usefulness of the negatively keyed items was questioned in clinical samples. Kojima et al. (2001) speculated that the splitting between positively and negatively keyed items within the EOT is due to the more complex wording of the items and the lower mental flexibility of the alexithymic patients. And Ryder et al. (2018) pointed out that the EOT items, in comparison with the remaining items, emphasize interests and preferences rather than deficits. In this context, it is also noteworthy that all four negatively keyed EOT items require a decision between two evaluation objects.
For the more advanced models that try to tap method-specific variance, the results were more surprising. The models in which systematic method variance arising from the negatively keyed items were addressed lead to problematic factor loadings. This notion held for the nested factor model with a factor that is orthogonal to the trait factor as well as for the correlated-trait-correlated-uniqueness model. Thus, the intended separation between method and trait variance could not be achieved, which highlights two design flaws that have been frequently addressed (Gignac et al., 2007; Reise et al., 2013) and that prevent a more adequate modeling: First, half of the EOT items are negatively keyed, thus lacking a prototypical instantiation. Second, four of the five negatively keyed items belong to one and the same factor which confounds method-related and content-related variance. Therefore, some studies rephrased the negatively into positively keyed items, however, without arriving at a clearer factor solution (e.g., Maggini & Raballo, 2004). Also, the bifactor model which assumes a general factor of alexithymia and uncorrelated specific factors for the facets was problematic resulting in several low factor loadings. This corroborates recent modeling attempts which also resulted in low or even negative factor loadings (González-Arias et al., 2018; Tuliao et al., 2020). We agree with Reise et al. (2013, p. 138) that fitting a highly restricted multidimensional model such as the bifactor model for the TAS-20 “seems a tedious exercise.” From a practical point of view, the three-dimensional structure with clearly separable factors indicate that the subscale scores provide a more adequate picture of alexithymia than a general score. Whether this superiority in model fit also translates into visible, clinical consequence has to be subject of further clinical research. The total scale score is more reliable since it is based on more items, but it is assumed that the subscale scores might have added value (cf. Sekely et al., 2018). If a more fine-grained feedback really offers an increment (e.g., detecting an improvement of specific symptoms in the course of a treatment), is a question, that cannot solely be answered based on measurement models.
The subsequent measurement invariance tests showed that part of the overall model misfit of the three-dimensional solution stemmed from translated versions. It should be noted that the confirmatory way of testing the comparability across languages, is much stricter than Tucker’s congruence coefficient (Lorenzo-Seva & ten Berge, 2006), which is a simpler descriptive gauging the similarity of correlation matrices. It is somewhat ironic that one of the strengths of the instrument, that is, the global spread of the TAS-20, is also one of its weaknesses, since the translated versions seem to contribute to biases in the dimensional structure. Different types of bias in cross-cultural assessment might be responsible for these translation biases (van de Vijver & Tanzer, 2004). For example, item bias (often expressed as differential item functioning) might occur if a poor translation causes a shift in the items’ content or if culture-specific interpretations of the item content exist (Chen, 2008). This issue could be tackled with proper translation and adaption techniques (Geisinger & McCormick, 2012). A more serious problem for measuring alexithymia across cultures might be construct bias, that is, differences across cultures in the construct itself. For example, Kirmayer (1987) argued that alexithymia is often understood as an intrapsychic process or deficit, but that this emphasis might obscure the impact of the social and cultural context. Thus, cultural display rules affect the readiness or intensity with which more collectivistic cultures such as the Japanese show their feelings openly and social norms shape what is considered appropriate behavior (Fukunishi et al., 1997; Matsumoto et al., 2008). In this context, it is plausible that Item 15, “I prefer talking to people about their daily activities rather than their feelings,” is heavily affected by the sociocultural context. As Ryder et al. (2018, p. 41) pointed out, the EOT items that emphasize interests and preferences rather than deficits, might “reflect a cognitive style rooted in cultural values about emotion.” In retrospect, one has to admit that alexithymia as assessed by the TAS-20 has “evolved from the clinical observation made on populations in North America and Western Europe” (Fukunishi et al., 1997, p. 797). Thus, in other cultural contexts alexithymia might not manifest in the same manner. With respect to measurement invariance in patient versus nonpatient samples, our meta-analytic results are reassuring. Model fit in the clinical samples excelled the one in the nonclinical samples. But, it should be critically noted that these estimates were based on a comparatively small and heterogeneous sample.
Limitations and Future Directions
Some limitations of the present meta-analysis have to be taken into account: First, the recovery of population factors in individual studies can be impeded by sampling error (MacCallum et al., 2001) or highly skewed response distributions (with many people reporting no symptoms; Gaskin et al., 2017). Although pooling results across diverse samples should provide more robust inferences on the population factor structure, we were unable to systematically examine the distributions of the included studies. However, comparisons between clinical and nonclinical samples showed highly comparable measurement models for the TAS-20 and, thus, indicated robust results across heterogeneous populations. Second, the factor analyses relied on sample statistics that, for the most part, were reproduced from reported loading structures. Compared with other MASEMs of psychological measurement instruments such as Rosenberg’s Self-Esteem Scale (Gnambs et al., 2018) or the short version of the General Health Questionnaire (Gnambs & Staufenbiel, 2018), for the TAS-20 only few studies provided the raw data to compute these matrices, probably because in clinical settings legal restrictions or ethical considerations prevent data sharing. Therefore, we could not compare the stability of the factor structure across different data sources. Although simulation research (Gnambs & Staufenbiel, 2016) and empirical comparisons using other instruments demonstrated the validity of the adopted MASEM approach, future studies are encouraged to cross-validate the presented findings with independent raw data, preferably, from large-scale, representative samples. Moreover, Community-Augmented Meta-Analyses (Burgard et al., 2021), which combine an open repository for meta-analytic data with meta-analytic analysis tools, might be an effective way to circumvent data sharing issues and develop a continually updating database providing up-to-date information on the measurement properties of the TAS-20.
In addition to the findings reported in this article, the MASEM results might serve as a starting point for future research and further refinement of the TAS-20. For example, a 20-item questionnaire might be brief, but still too extensive for large-scale studies that rely on strongly abbreviated versions. The data at hand (i.e., the weighted correlation matrix) might allow compiling a short version of the TAS-20 (see also Williams & Gotham, 2021). Analyzing the meta-analytic results with modern item selection algorithms such as Ant Colony Optimization (Schroeders et al., 2016) several psychometric criteria could be considered simultaneously. For example, an abbreviated version with a sound measurement model and reliable factors could be derived that also approximate the relations to covariates or ensure measurement invariance across cultures (see also Jankowsky et al., 2020). The focus of the present meta-analysis was on the internal structure of the TAS-20. It would be worthwhile to extend the analysis with an additional meta-analytic investigation studying the relation of the TAS-20 to relevant constructs (e.g., mentalizing, empathy), thus, to place the measure into a larger nomological network.
Alexithymia is and likely will be an influential construct in clinical and nonclinical research and practice. The prevalent measure of alexithymia, the TAS-20, has previously attracted various psychometric criticisms. In the present meta-analysis, we examined the factorial structure across diverse samples and translations. Overall, these analyses corroborated the hypothesized three-factor structure representing DIF, DDF, and EOT. However, weaknesses in the construction of various translated versions of the TAS-20 might impede cross-cultural research on alexithymia. Although the further development of the TAS series (Bagby et al., 2020; Taylor et al., 2020) seems to reconnect to the original clinical observations and theoretical ideas by including the reduced fantasizing as a component of the “imaginal process” (for an opposing opinion, see Preece, Becerra, Robinson, et al., 2020), we believe that the TAS-20 is an important milestone, which will continue to serve as a reference in the assessment of alexithymia.
Supplemental Material
sj-pdf-1-asm-10.1177_10731911211033894 – Supplemental material for The Structure of the Toronto Alexithymia Scale (TAS-20): A Meta-Analytic Confirmatory Factor Analysis
Supplemental material, sj-pdf-1-asm-10.1177_10731911211033894 for The Structure of the Toronto Alexithymia Scale (TAS-20): A Meta-Analytic Confirmatory Factor Analysis by Ulrich Schroeders, Fiona Kubera and Timo Gnambs in Assessment
Footnotes
Acknowledgements
We confirm that the work conforms to Standard 8 of the American Psychological Association’s Ethical Principles of Psychologists and Code of Conduct. We thank Mike Cheung for providing feedback on the analyses.
Declaration of Conflicting Interests
The author(s) declared no potential conflicts of interest with respect to the research, authorship, and/or publication of this article.
Funding
The author(s) received no financial support for the research, authorship, and/or publication of this article.
Supplemental Material
Supplemental material for this article is available online.
Notes
References
Supplementary Material
Please find the following supplemental material available below.
For Open Access articles published under a Creative Commons License, all supplemental material carries the same license as the article it is associated with.
For non-Open Access articles published, all supplemental material carries a non-exclusive license, and permission requests for re-use of supplemental material or any part of supplemental material shall be sent directly to the copyright owner as specified in the copyright notice associated with the article.