
Abstract
Trucking fleets often need to install additional displays and consoles in vehicles to interface with the driver. These devices may be used for fleet management, assistance with logistics, or connecting to business applications. However, if these devices are installed without consideration of the drivers, the users may become distracted or frustrated with the system. Therefore, a human factors engineering (HFE) approach to the installation of additional console(s) reduces the likelihood of rework, distractions, and driver inconvenience. Model-based systems engineering (MBSE) approach utilizing best practices for HFE design is presented in this paper. The results of the effort are captured with a prototype assembly bracket used in the production version of the heavy vehicle. The plan-do-study-act (PDSA) model-based human factors systems engineering methodology demonstrates efficiencies in the design and implementation of the display system. This method proved effective as new mounts were fitted in a preproduction electric vehicle before they were released in production.
Keywords
Introduction
Within the commercial on-highway transportation industry, drivers are responsible for delivering goods and providing services that are crucial to supporting modern economies. If drivers have too many distractions and diversions while operating a heavy vehicle, they can lose focus on public roadways. The user interfaces for a driver should coordinate with the heavy vehicle cab interior. Conversely, the interfaces should encourage or maintain safe driving. Research performed by Dingus et al. (2016), indicates that the riskiest driver behavior involves observable distractions, including the use of secondary devices. Inattention caused by attempting additional tasks while driving degrades performance and leads to crashes (Engström et al., 2013).
Commercial vehicle operations are a heavily regulated industry. One such regulation is the electronic logging device (ELD) mandate intended to track the driver’s hours of service. Often service providers sell ELDs that include additional functionality to help commercial carriers with navigation and other operations. Since these devices are after-market additions, fleets and owners are responsible for vehicle interface installations and mounts (Federal Motor Carrier Safety Administration [FMCSA], 2018).
This paper is focused on an electric medium duty, class 7, box truck—a Freightliner eM2 as shown in Figure 1, the Gamber Johnson Zirkona eM2 Mount, and Samsung Tab Active 3 tablet. The mounting device for the ELD tablet interface requires analysis to ensure the design meets HFE requirements. Circumstances such as long hours, weather conditions, vibration, noises, glare, and night driving can result in distractions for the user. Driver interfaces should be mounted in locations that reduce distraction with minimal interference to vehicle controls (Miller & Boyle, 2019). The design of an ELD mount will be explored using human factor engineering (HFE) and an implementation of systems engineering (SE) foundational concepts. The case study was based on a tight production schedule of four months.
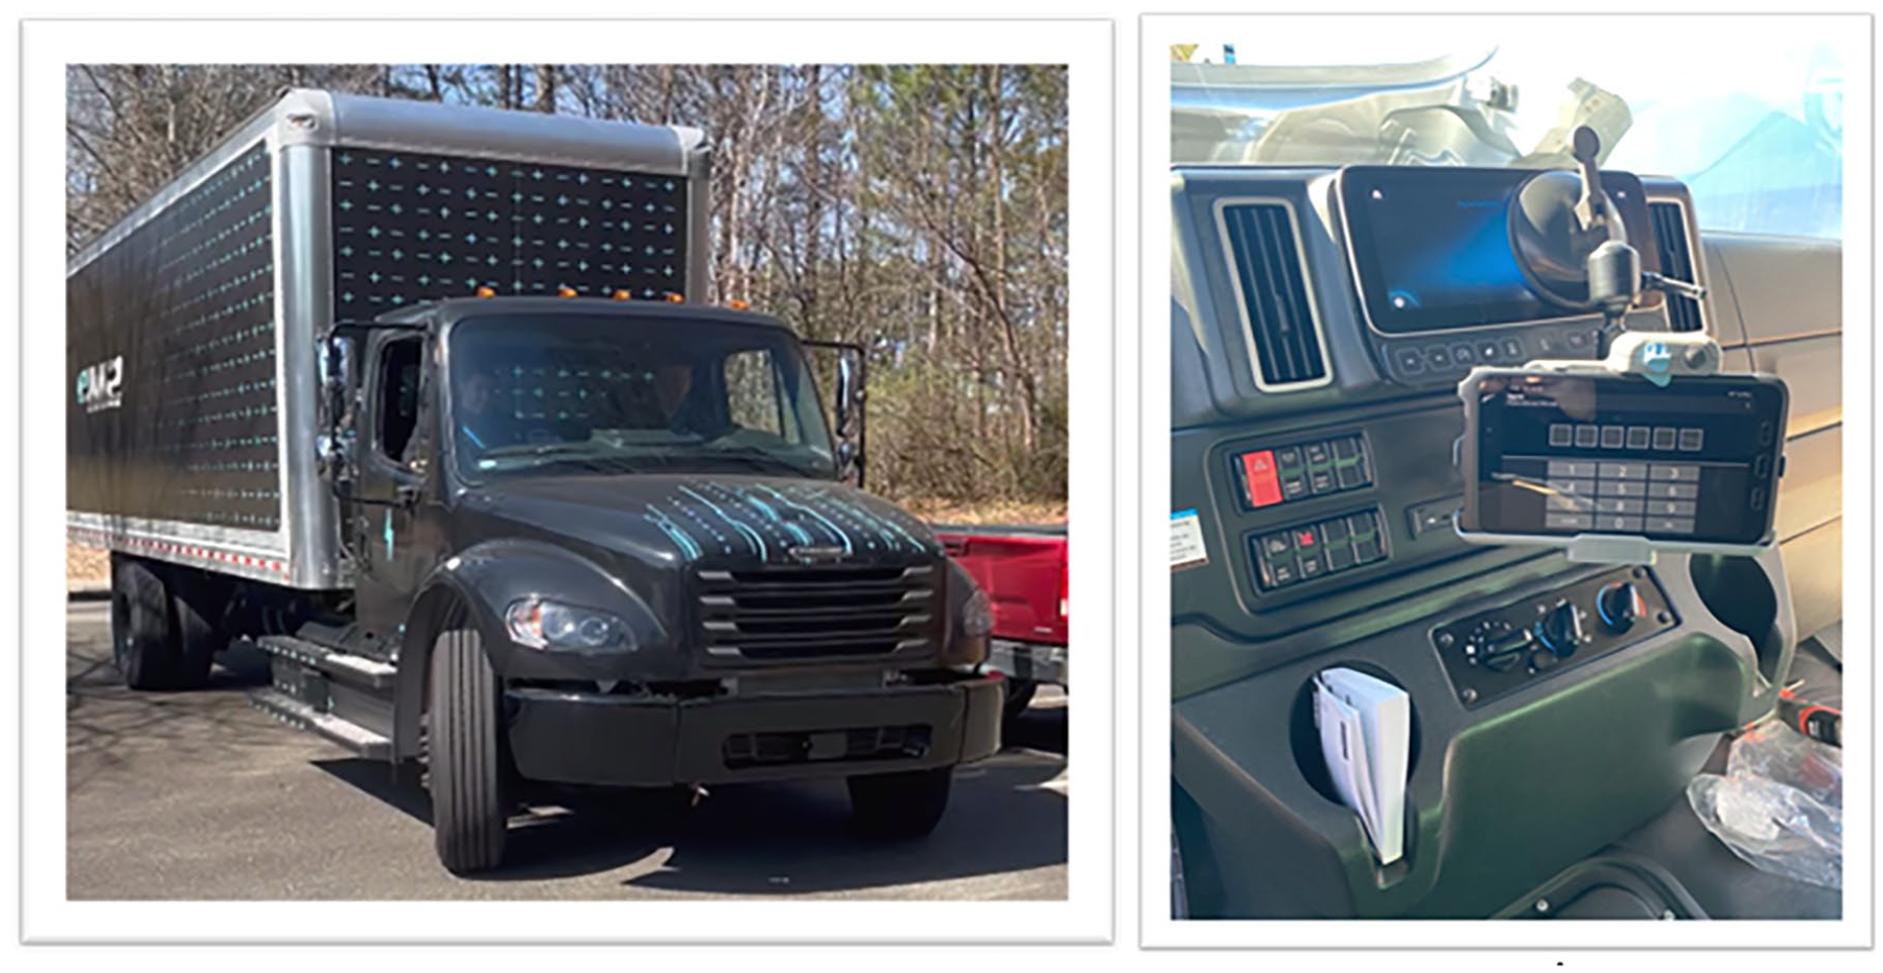
Example truck system under consideration: Freightliner eM2 truck (left) and center console (right).
The pre-production box truck had limited availability, as it was used for concurrent studies, and it was not solely focused on mount design. The mount prototypes were produced at a factory at a different locality from the pre-production box truck, which created logistical constraints and required travel. Long distance partnerships require continuous communication and coordination. To address a highly time constrained design, several prototype iterations were required (Moen & Norman, 2009).
This effort proposes a novel approach of systems engineering (SE) processes that address the human factors (HF) requirements and constraints associated with ELD mounts in truck cabs. Key SE activities such as requirements definition, refining use cases of the system, and verifying calculated results against functional requirements will be performed within a model-based systems engineering (MBSE) environment as defined by INCOSE Systems Engineering Vision 2020 (2007). Rapid exploration of alternatives is enabled with digital representation of systems (INCOSE Systems Engineering Vision 2035, 2021).
Needs and System Requirements
This design stems from the HFE considerations of the driver, fleet manager, original equipment manufacturer (OEM), installer, maintainer, and the public. Table 1 shows a subset of stakeholder needs gathered through interviews and working groups of drivers and industry professionals. The focus of this research is the driver interaction with existing vehicle controls and the addition of an ELD tablet.
Explored Stakeholder Needs.
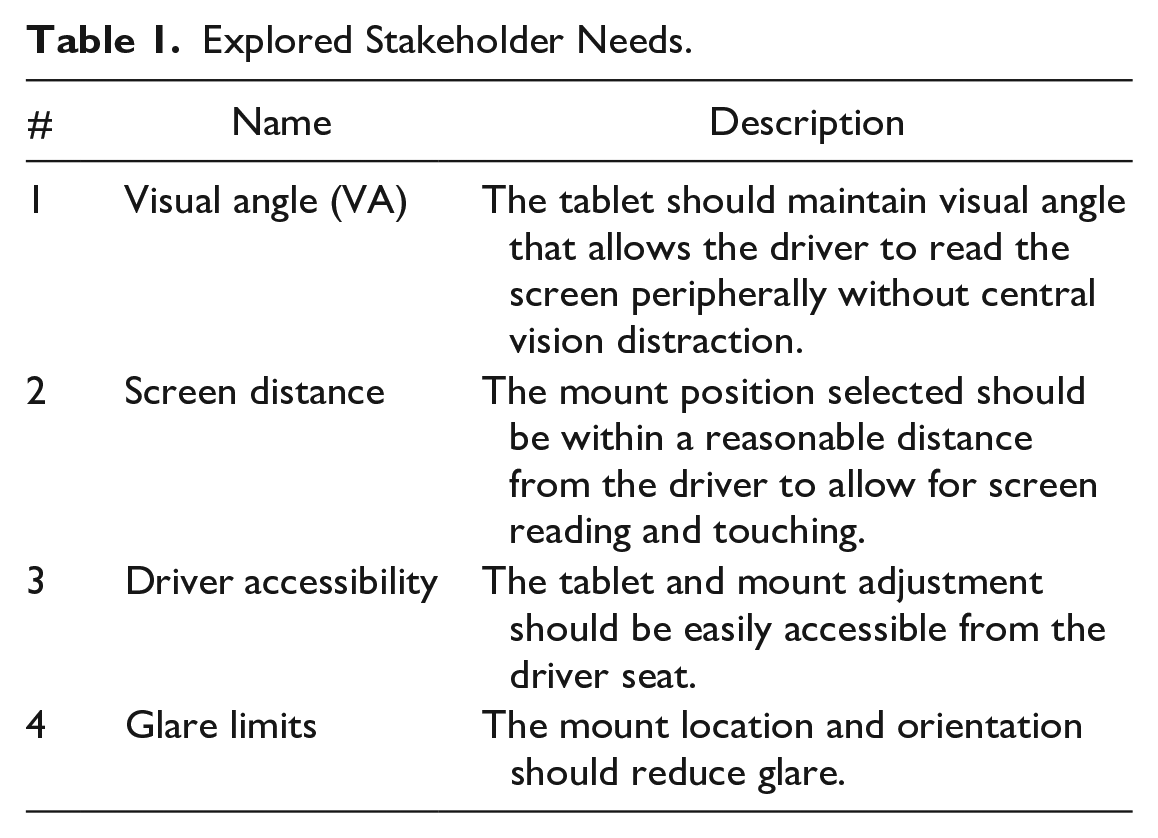
Figure 2 depicts ELD tablet value properties that will satisfy design requirements derived from stakeholder needs shown in Table 1.
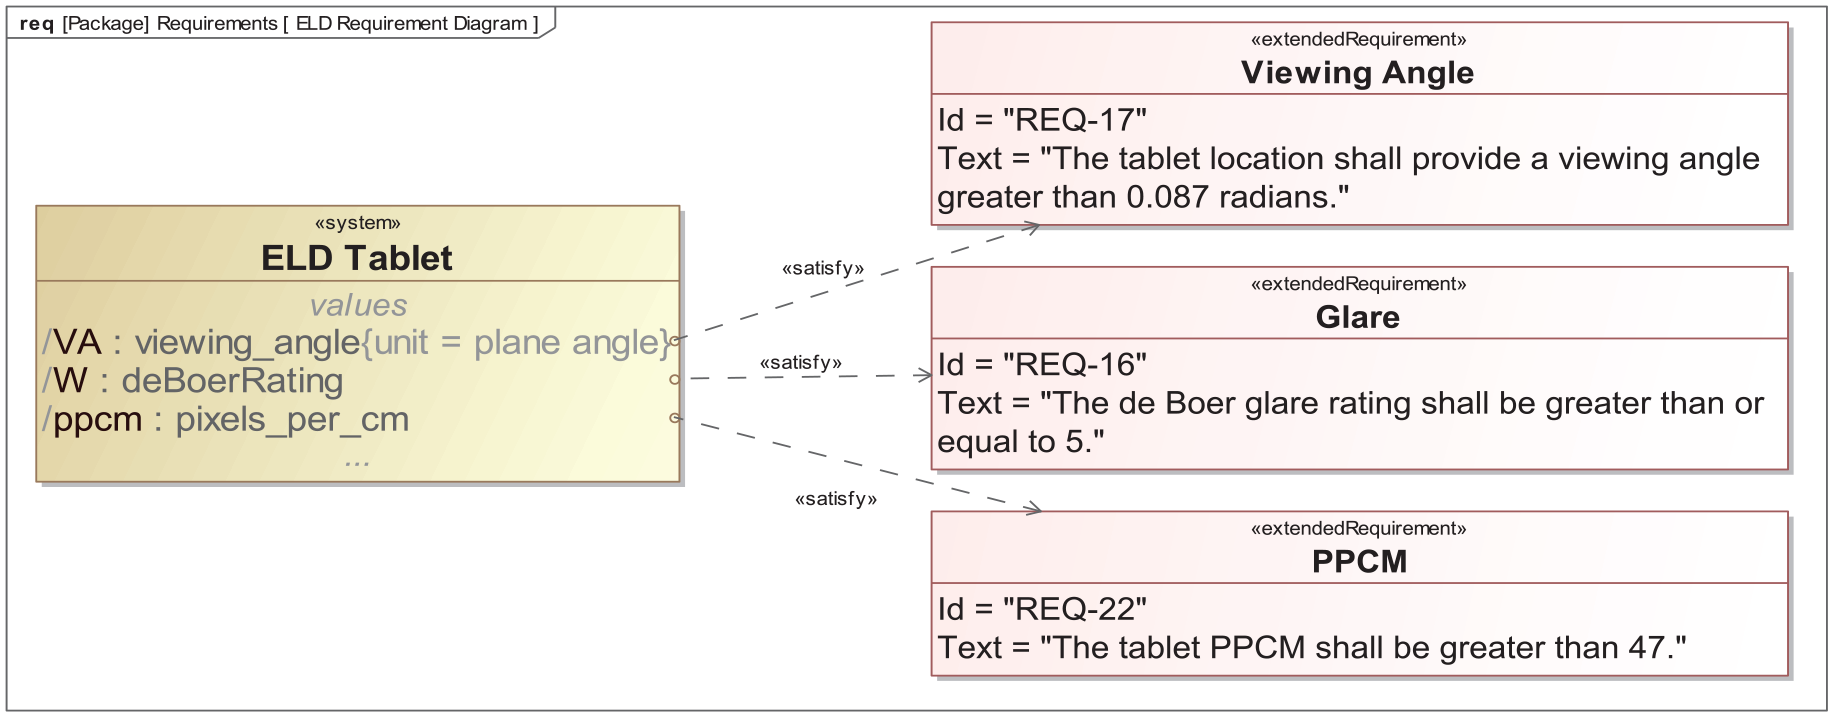
ELD tablet value properties that satisfy requirements.
System of Interest
The system of interest (SoI) is the ELD tablet shown as part of the Cab block in Figure 3. The composition of the ELD Tablet system shows the Mount subsystem as another level of abstraction. Components in Figure 3 describe parts of the subsystems. Parameters regarding the Screen component are addressed in this paper and can be optimized with the Mount location.
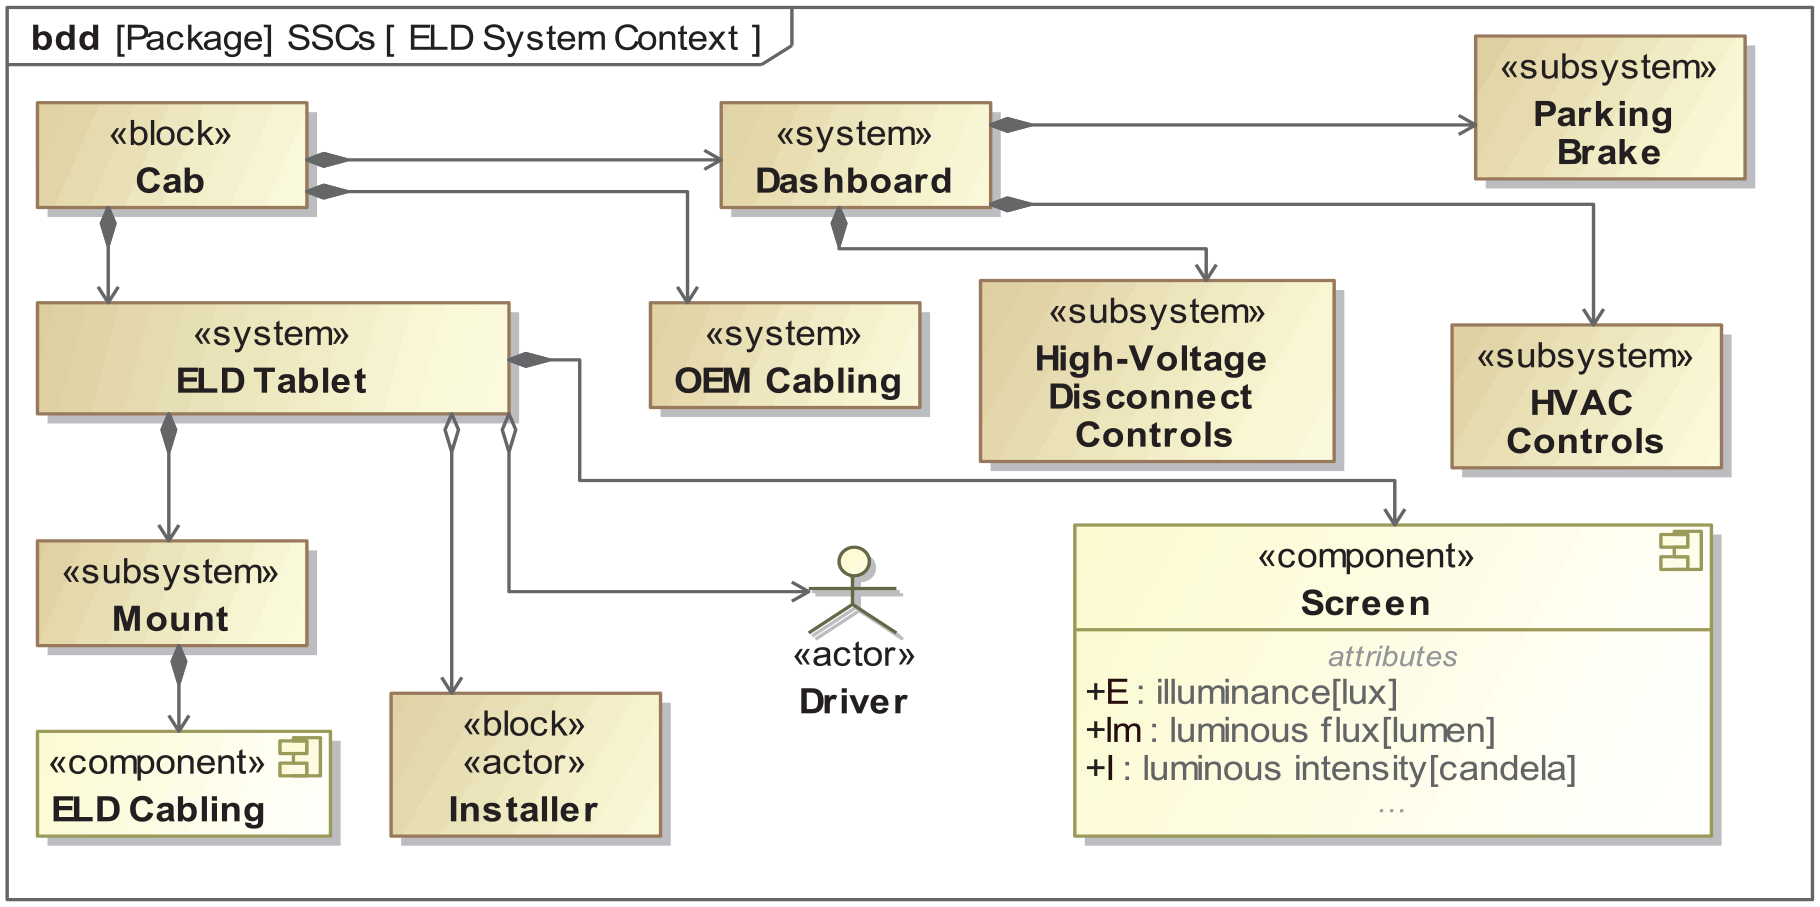
ELD tablet system decomposition.
The content diagram in Figure 4 organizes the model by the core MBSE pillars of requirements, structure, behavior, and parametrics (Friedenthal et al., 2015). This view enables stakeholders to quickly locate, explore, and contribute to design iterations.
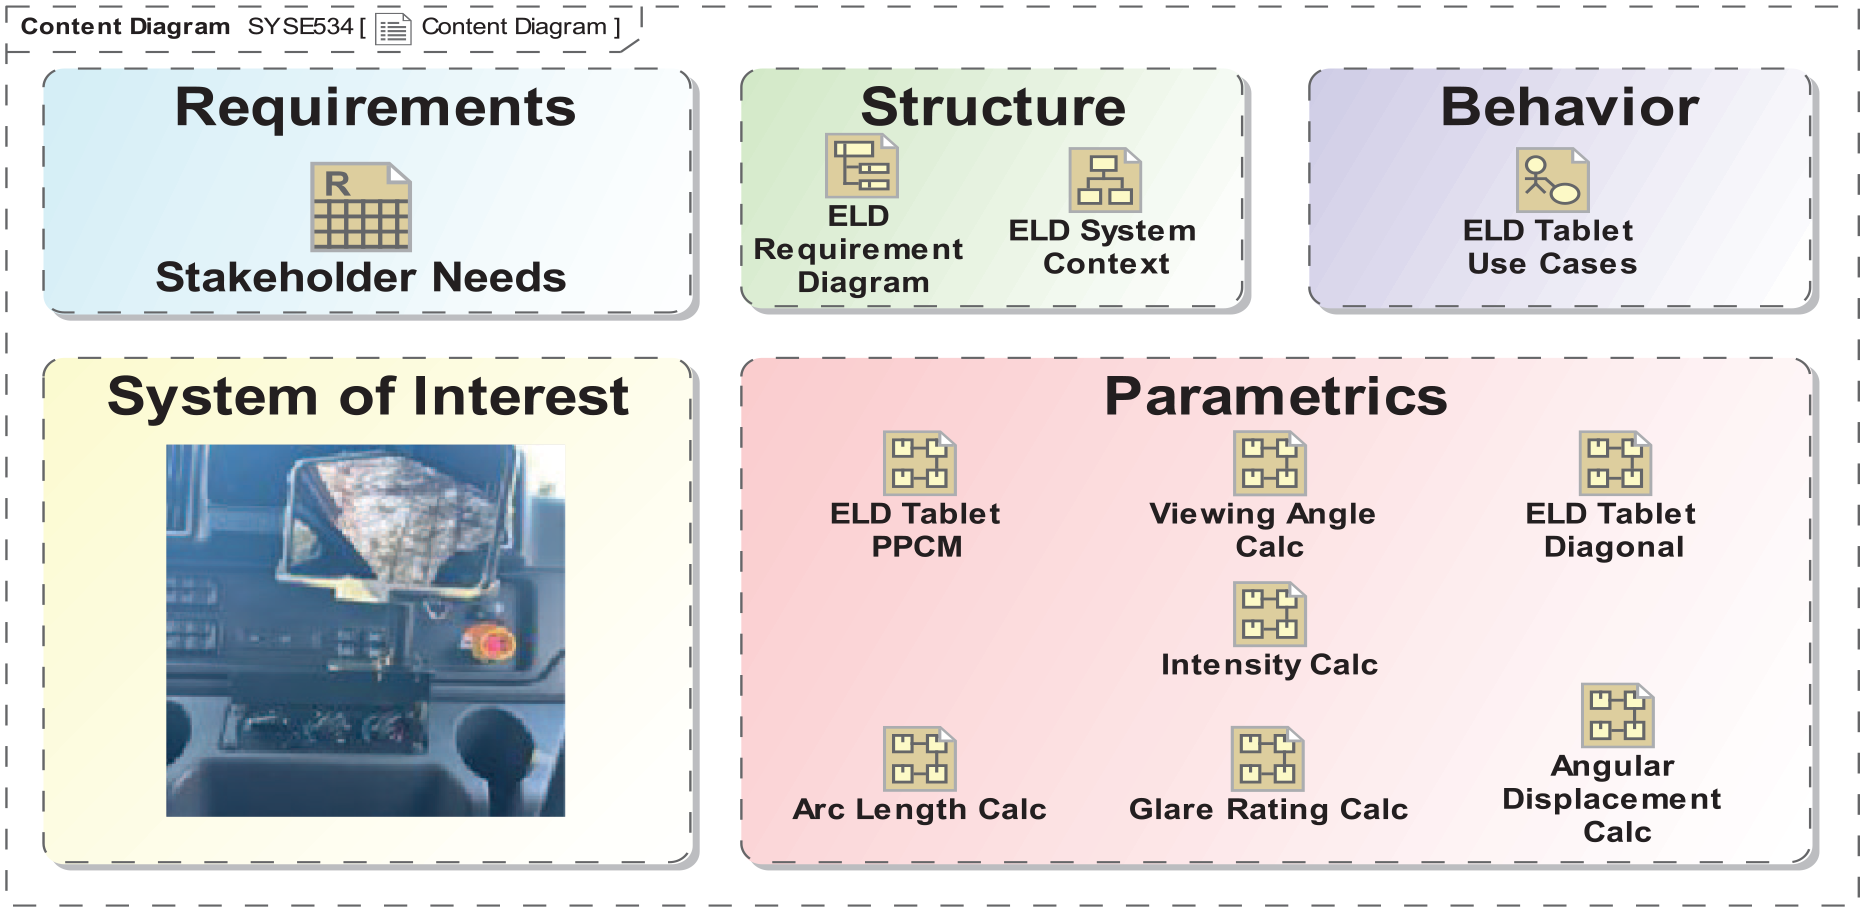
Content diagram for the ELD tablet model.
Use Cases
Figure 5 depicts the ELD tablet base use cases of Drive Vehicle, Interact with ELD, and Install Mount. The associations created between the Driver and Installer entities and use cases identify actor participation. The Read Tablet Screen, Touch Tablet Screen, and Adjust Mount use cases are included in the execution of the Interact with ELD base use case. This means that each time Interact with ELD is invoked, the included behaviors are performed.
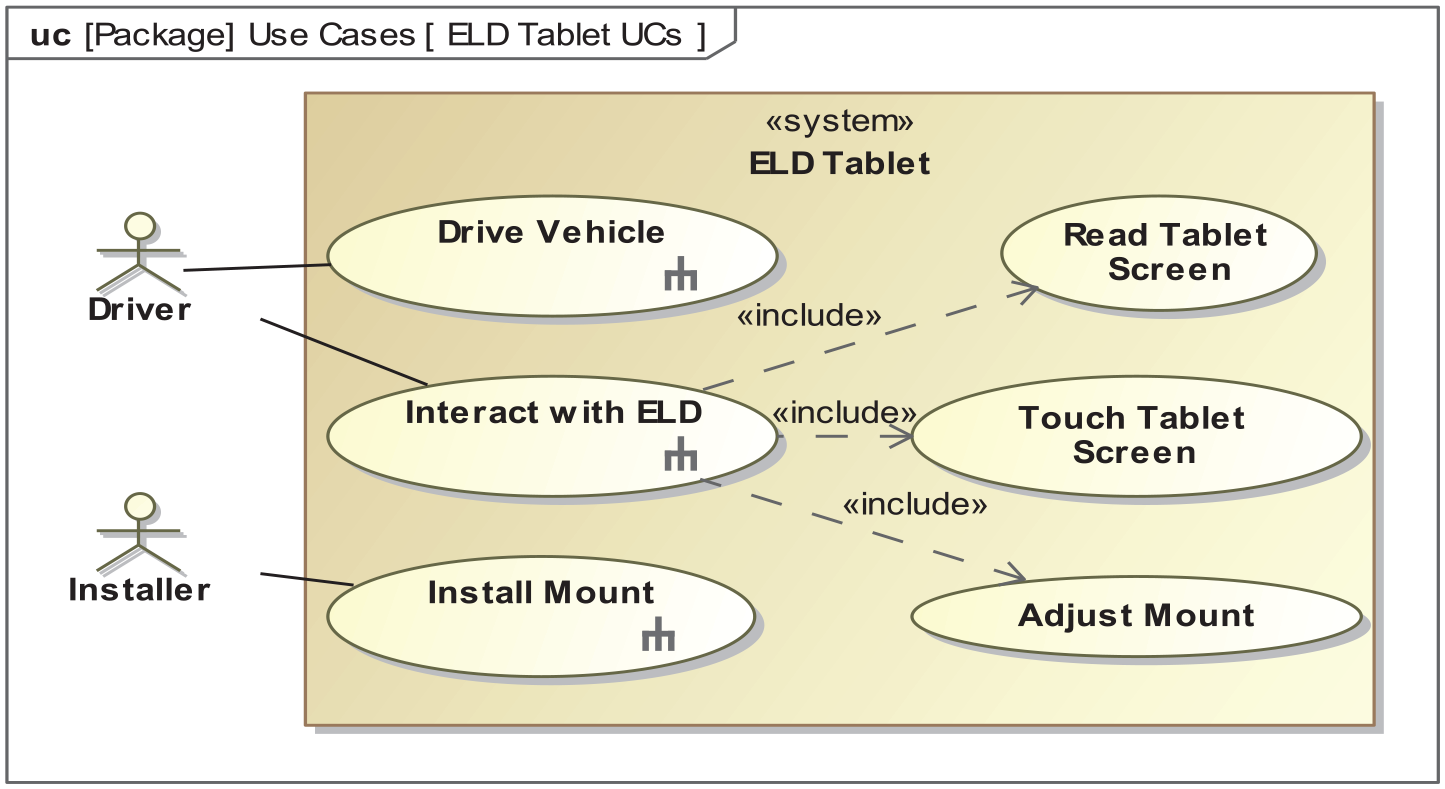
ELD tablet use cases.
System Parameters and Calculations
Executable Systems Modeling Language (SysML) parametric diagrams were created to understand how changes to input variable(s) impact the output value(s). The approach demonstrated by the system design leverages the quantitative results from the following analyses. Tying these results to calculated parameters verifies the proposed solution will meet HFE requirements.
The tablet screen display is 5.0” by 8.0”, or 12.7 by 20.3 cm. Figure 6 uses screen height (h) and width (w) to calculate a screen diagonal of approximately 24 cm and a screen area (A) of 0.0258 m2, or 258 cm2.
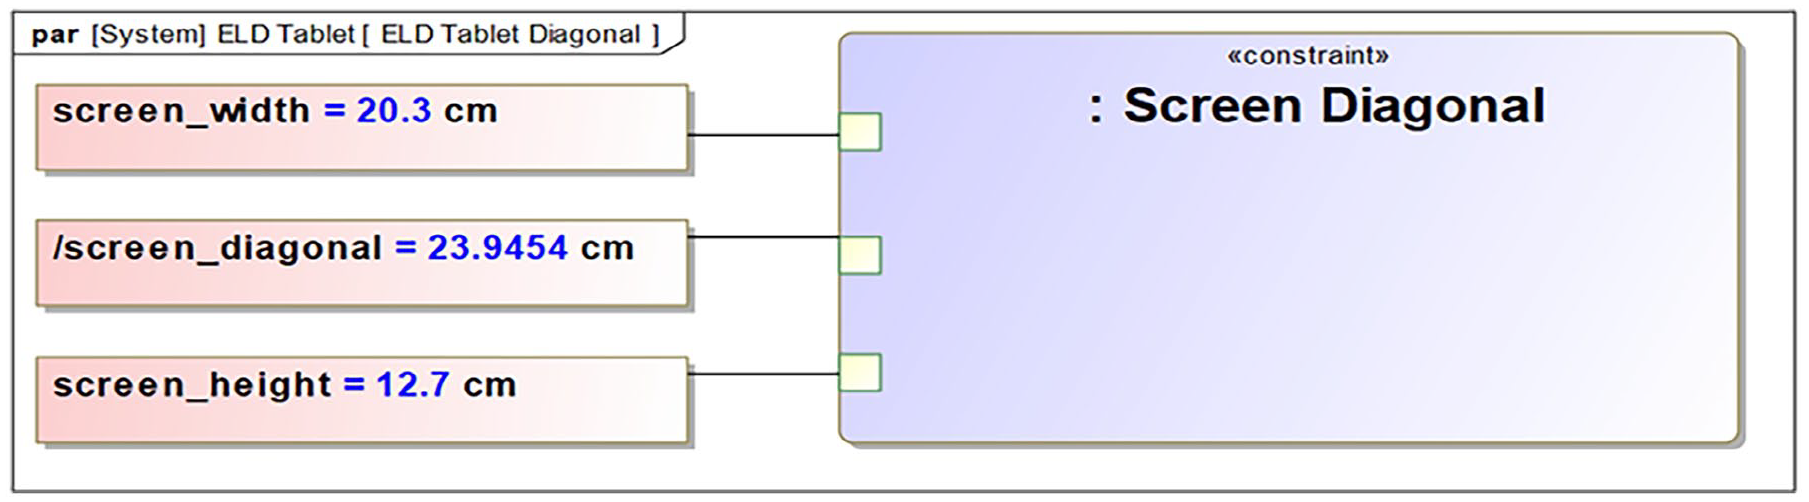
ELD tablet screen diagonal.
To evaluate acceptability of potential eye strain of the viewer, the screen resolution is stated by pixels per centimeter (PPCM). The display resolution for the tablet is 1920 by 1,200 pixels. Based on the calculated screen diagonal of 24 cm, the resolution was found to be 95 PPCM, exceeding the minimum threshold for ultra-high resolution of 47 PPCM as calculated by equations (1) and (2) and shown in Figure 7.


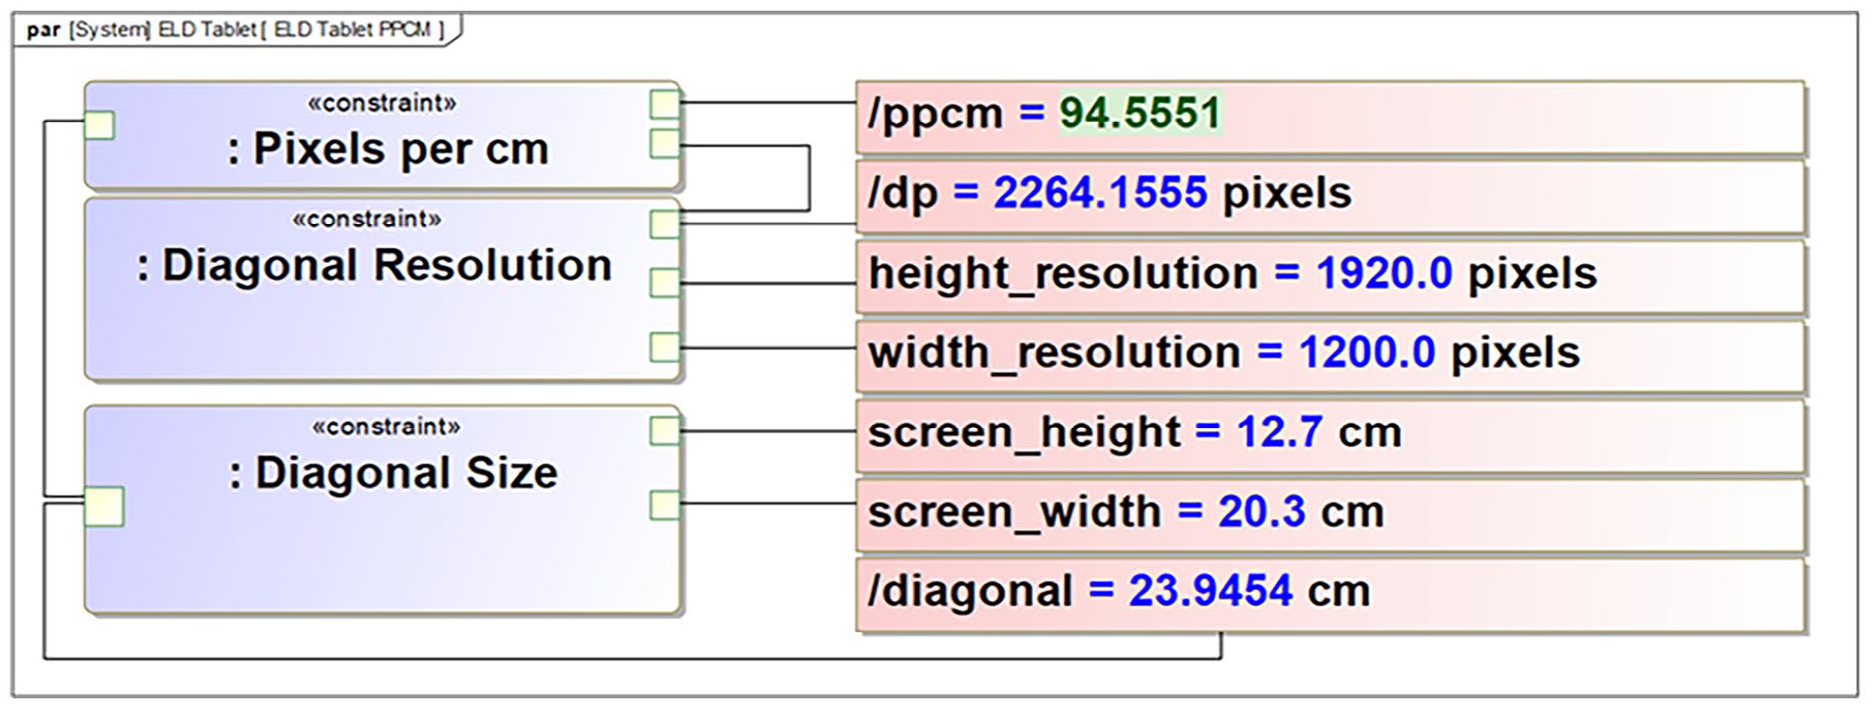
ELD tablet resolution calculation.
PDSA Methodology
The tablet screen met PPCM requirements. Not all aspects of the mount met design requirements in the analysis of prototype. The iterative cycle for design improvement uses the plan-do-study-act (PDSA) methodology. This methodology is based on Deming’s Wheel as interpreted by Moen and Norman (2009). In the planning state of the iteration, there are several parametric models designed. The do step is satisfied by building a study step was completed by reviewing the results and evaluating the prototype. The act concludes the iteration when the prototypes design parameters are enhanced and updated requirements are refactored. At this point, the initial iteration is complete. The PDSA cycle repeats for a new iteration if the initial design parameters do not meet requirements derived from stakeholder needs (Moen & Norman, 2009).
Visual Angle Calculation
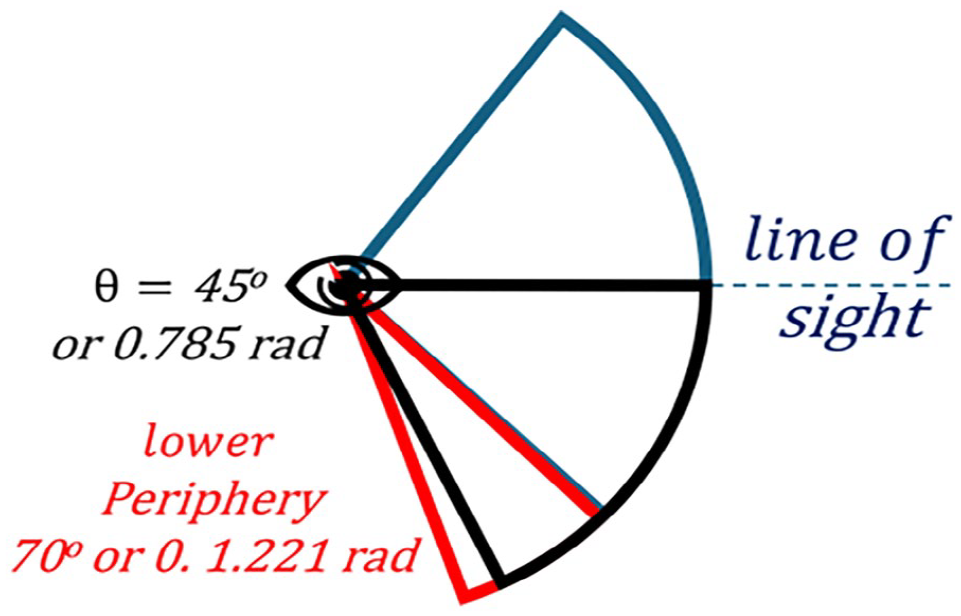
The position and orientation of the screen display affect the driver’s visual angle (VA), distance to the tablet, and glare rating. The lower periphery of driver line of sight was chosen to maintain the best field of view (FOV) for the driver when attention is directed toward the tablet as shown in Figure 8.
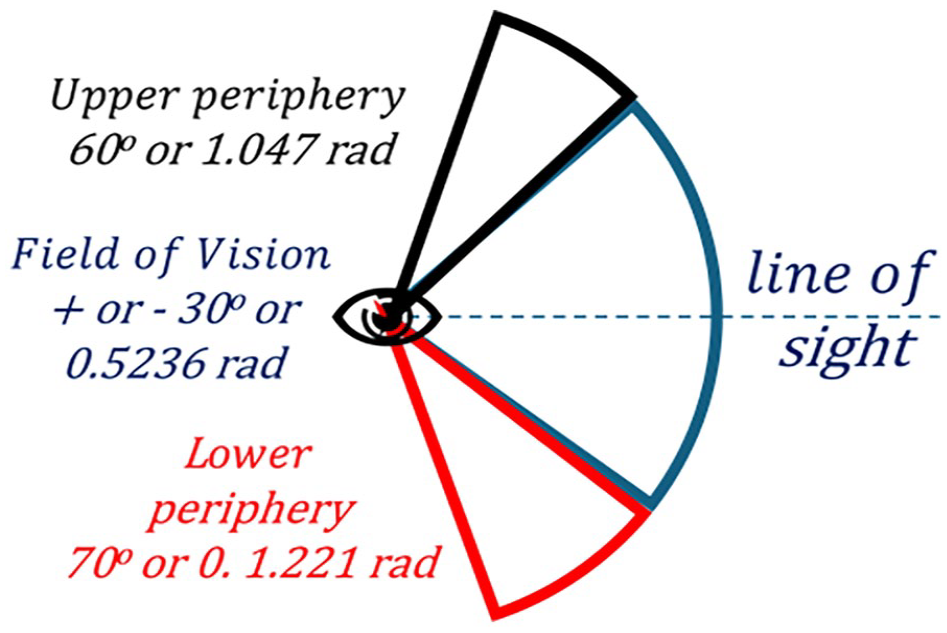
Peripheral vision categories based on angles derived from Williams and Boyne (2010).
ELD Tablet Mount Design Alternatives
When the ELD tablet is properly oriented at a reasonable distance, the HFE requirements are satisfied as shown in Figure 9.
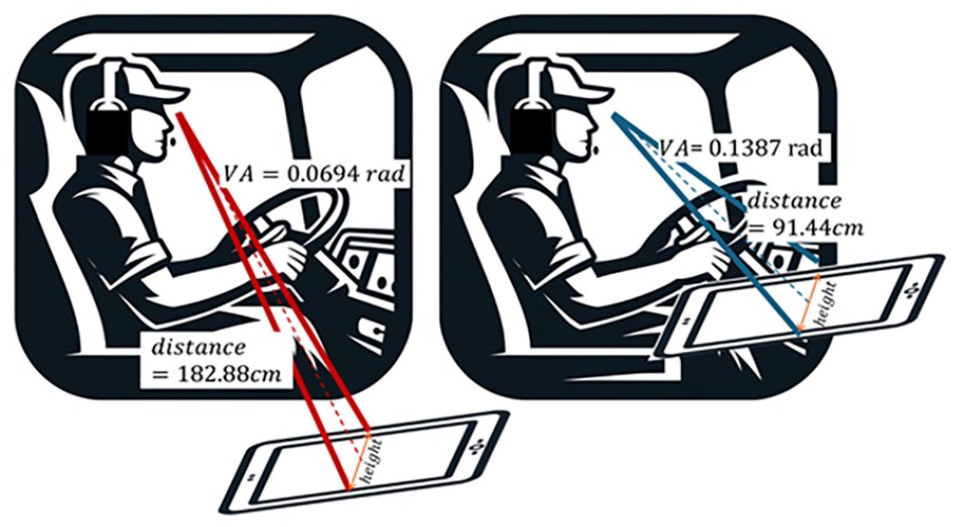
Visual angle for initial and adjusted ELD tablet locations.
The initial screen distance between the driver and the ELD tablet was measured to be 72”, or 182.88 cm, which results in a VA of 0.0694 radians, or approximately 4 degrees, calculated by equation (3) and shown in Figure 10.

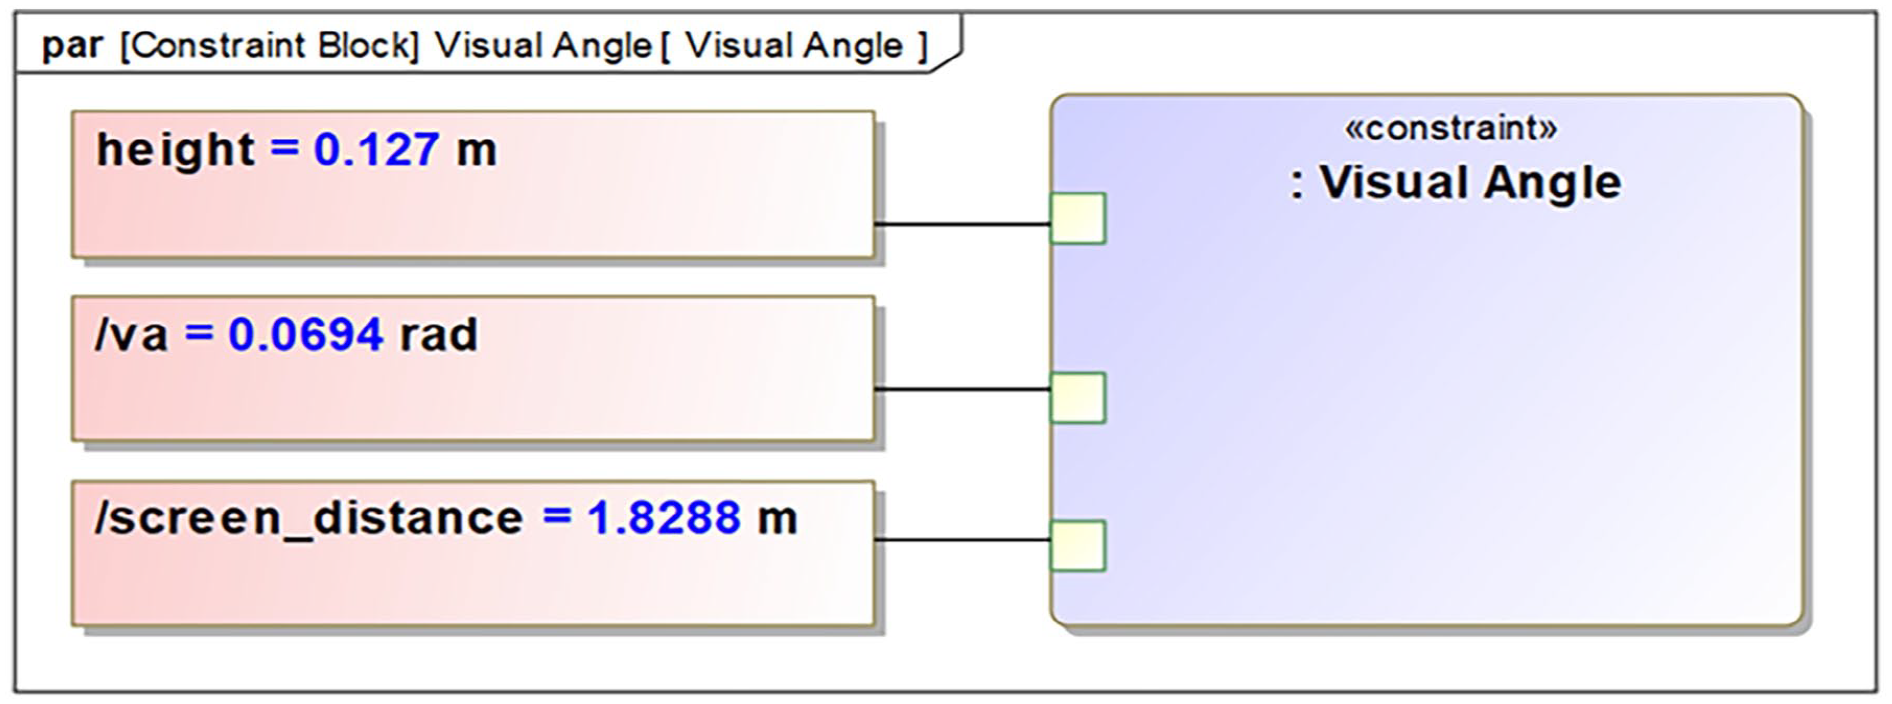
Visual angle based on initial ELD mount location.
When re-positioning the ELD tablet in the vehicle cab, a screen distance of 36”, or 91.44 cm, between the tablet and the driver resulted in a visual angle of 0.1387 radians, or approximately 8 degrees, calculated by equation (3). The adjusted location of the tablet satisfies the design constraint of 0.087 radians or 5 degrees illustrated in Figure 11.
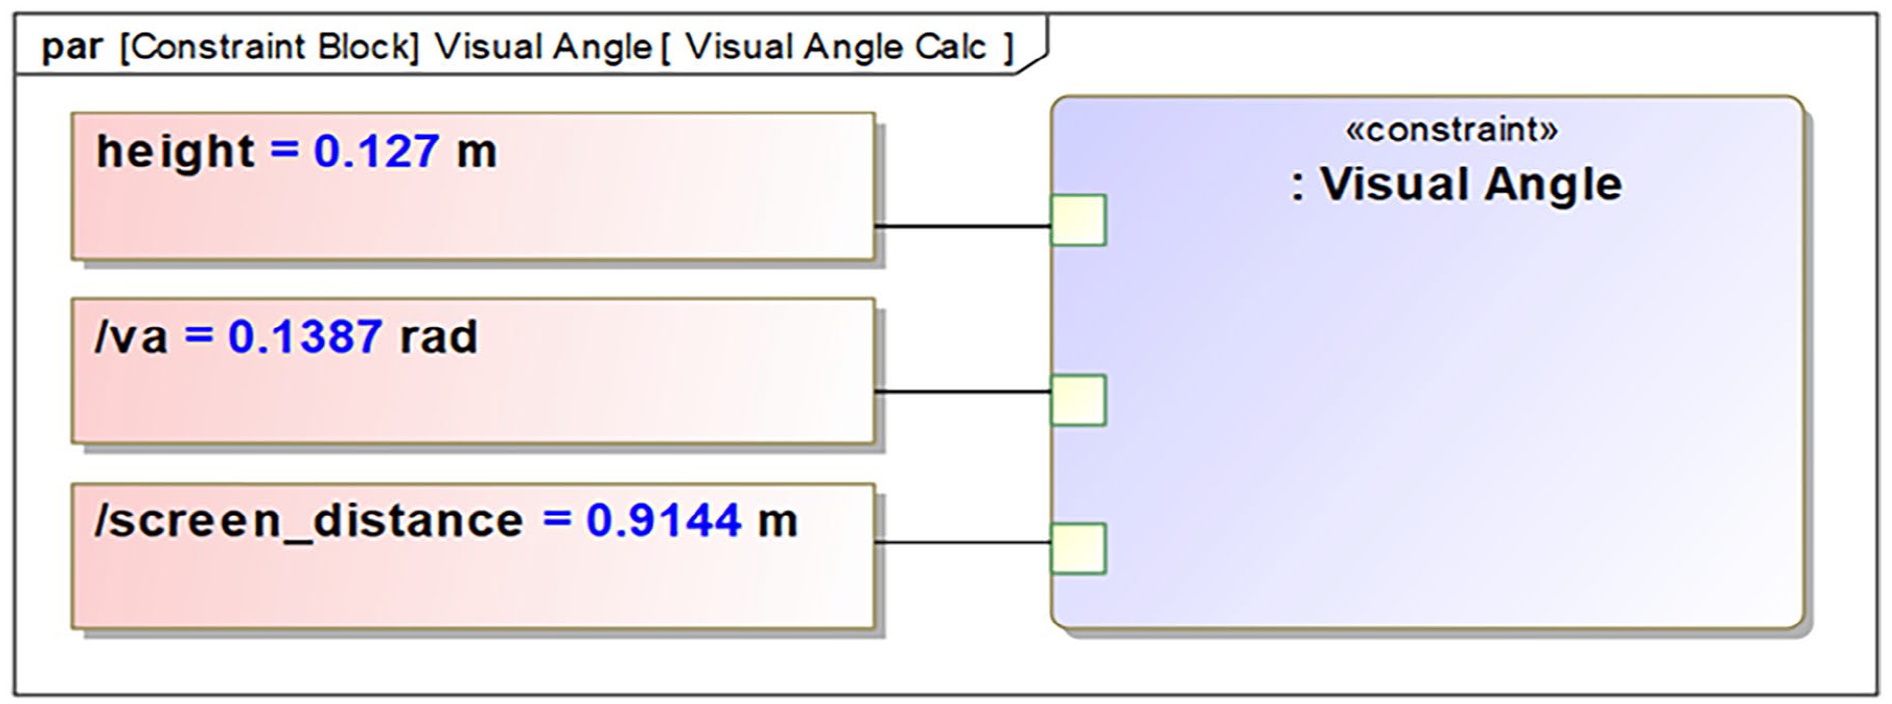
Visual angle calculation based on adjusted mount location.
Light measurements.
Eld Tablet Mount Design Options
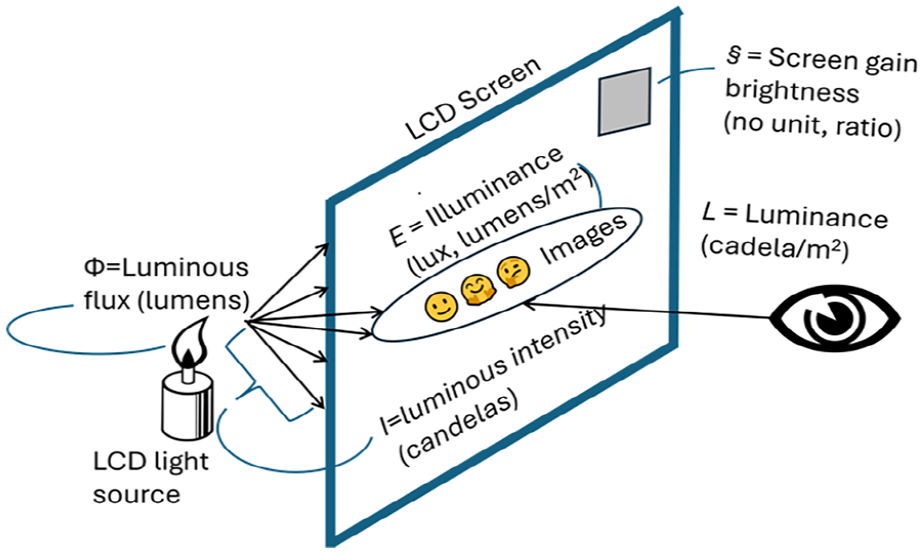
Understanding the screen flux, luminance, intensity, illuminance, and gain will help create context and relate the VA relative to line of sight to the de Boer’s rating. The luminous flux (Φ) of the tablet screen is 12.384 lumens as calculated by equation (4).

Luminance (L) is equivalent to viewability (nits). Based on the viewability of 480 nits given in the ELD tablet specification, L = 480 cd/m2. The luminous intensity (I) was found to be 12.384 candela (cd) using equation (5). Lumminance (L) is calculated on the parametric diagram in Figure 13.

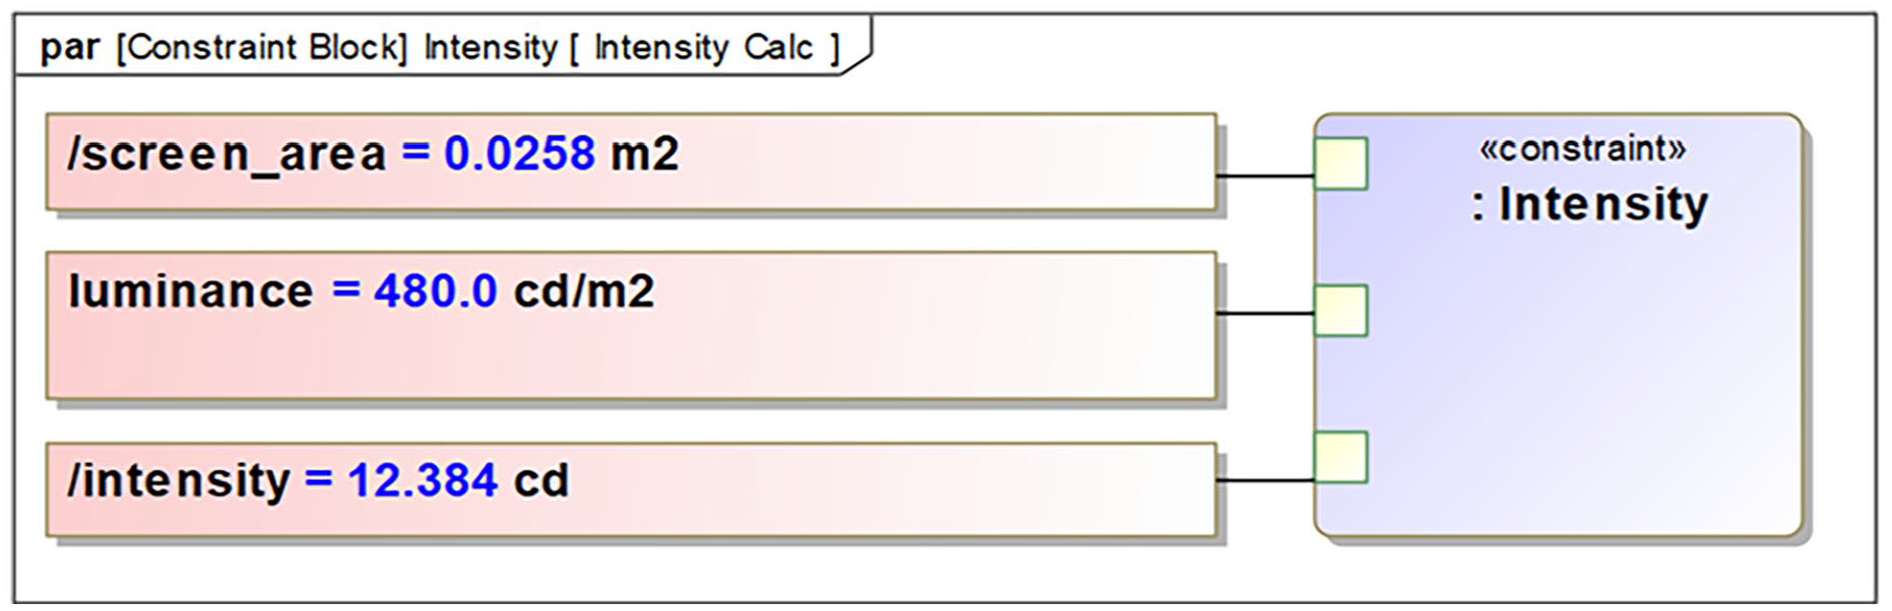
Light intensity calculation.
When the screen gain (§) in equation (6) is equal to one (1) because the distance between the light source and the tablet screen is negligible, illuminance (E) is considered equal to the luminance (L) based on equation (13). For the tablet studied, the when the illuminance is 700 cd/m2 when gain (§) equals 1, normal operating gain (§) is set to 0.686 or E = 480 cd/m2. Operational gain (§) is assumed to be one (1) when illuminance is 480 cd/m2. If the screen intensity is insufficient when illuminance is 480 cd/m2, the brightness setting can be adjusted.

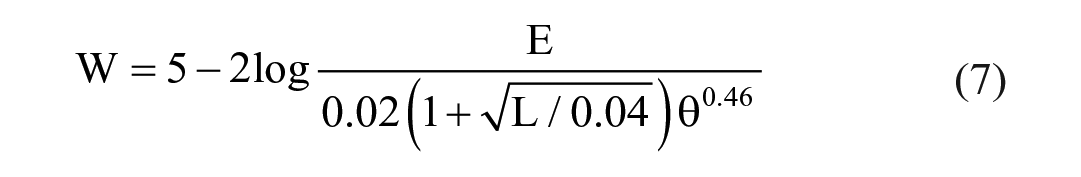
The de Boer glare ratings (W) shown in equation (7) map to qualitative values that describe the level of eye discomfort experienced when viewing oncoming headlights and streetlight intensity at night demonstrated in Figure 14 (Jin et al., 2011). Equation (7), developed by Schmidt-Clausen and Bindels (1974), is based on the de Boer scale (De Boer & van Heemskerck Veeckens, 1955) and used to quantify glare based on visual responses. The equation was used to quantify discomfort of bright headlights and streetlights at night.
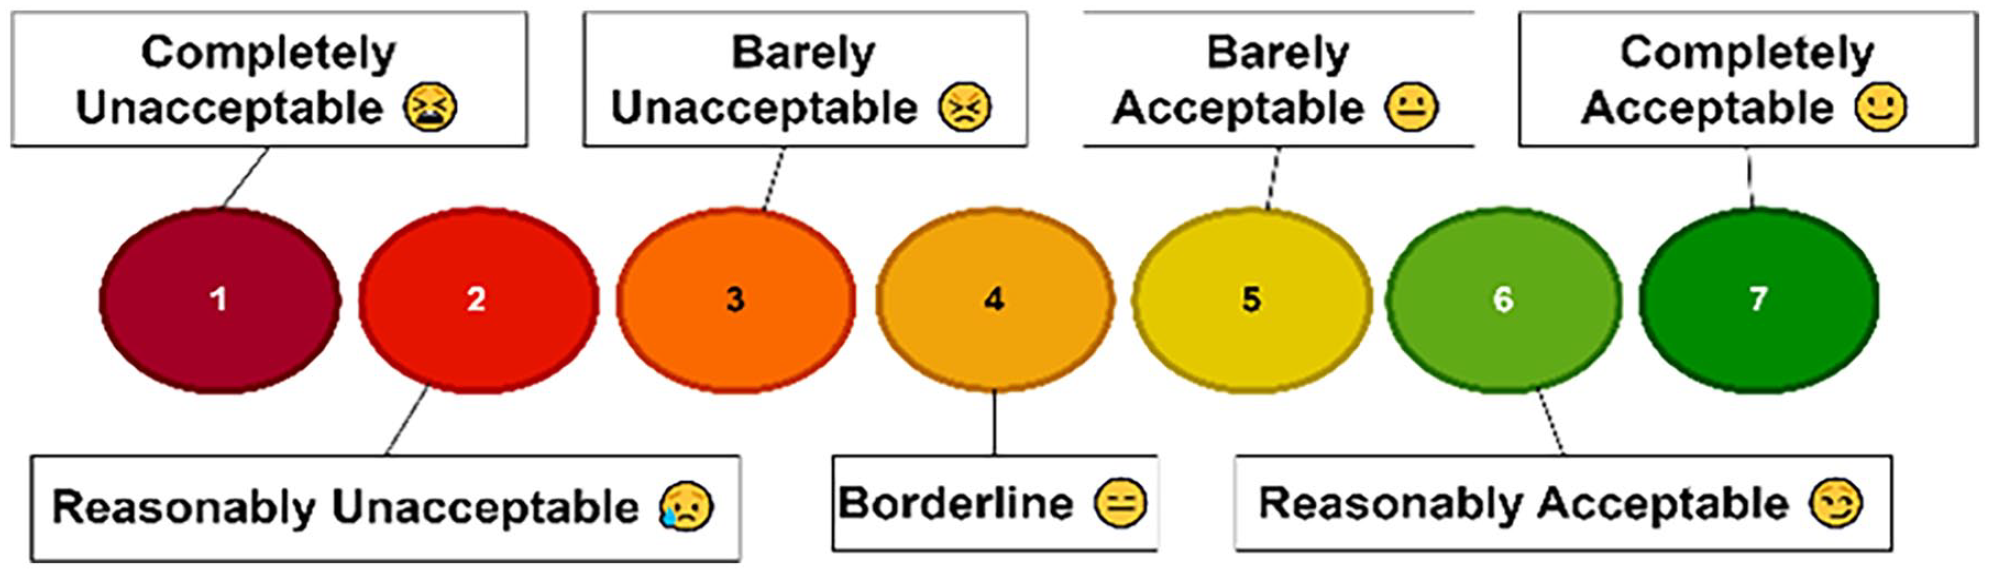
A rendering of the de Boer Scale as conceptualized in (Ste-Croix et al., 2010).
The equation is grounded to the fifth rating (5)–Barely Acceptable. The purpose of this grounding is that lights need to be as bright as possible without blinding the oncoming driver with glare. The scale is logarithmic so for every base ten (10) order of magnitude illuminance (E) is greater than luminance (L) inversely reduced by of periphery (θ), reference in Figure 15, relatively, the equation reduces glare and increases the rating quantification. The increased de Boer’s scale tends toward rating seven (7)–Completely Acceptable (Bullough, 2003).
Defining angular displacement (θ) for de Boer’s rating relative to line of sight derived from Williams and Boyne (2010).
To adapt de Boers rating for a Liquid Crystal Display (LCD) screen the propagation angle (Ψ) must be understood. The relationship between the illuminance (Es) of the screen and the illuminance of the tablet light source (Et) is described in equation (8).

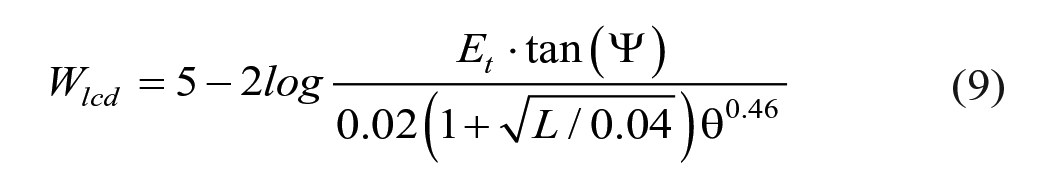
Assuming propagation angle (Ψ) as shown in Figure 16 is 0.0174 rad or one (1) degree, a glare rating can be determined by equation (9).
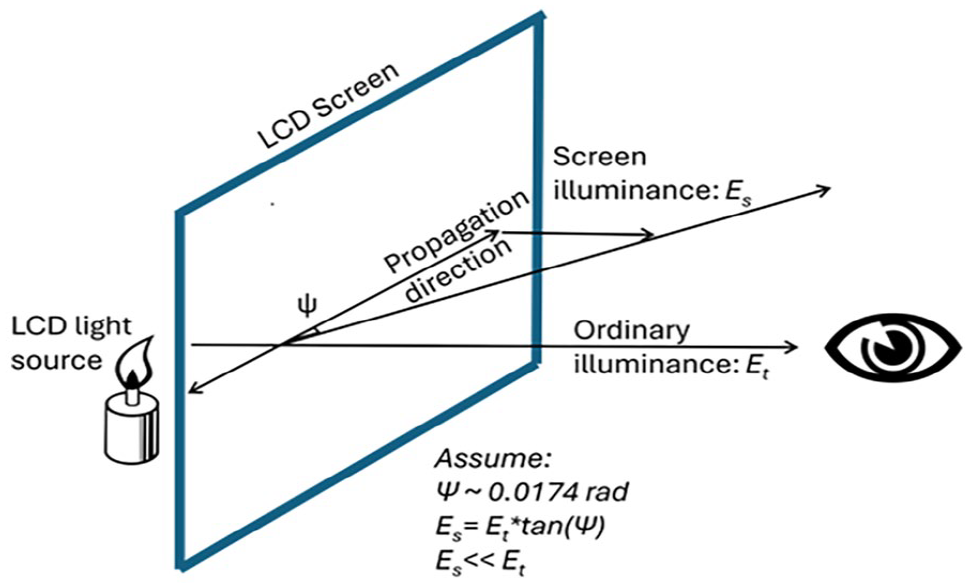
A rendering of the illustration of propagation direction and angle (Ψ) as represented in de Boer (2011).
Adjusting de Boer’s rating for an LCD screen results in equation (9) as a direct derivation from equation (8). Understanding that LCD screens do not propagate light directly toward the user allows adjustment of the de Boer’s rating. This adjusted rating maintains the light measurement system using LCD screen understanding (den Boer, 2011). This calculation is demonstrated in Figure 17 through a MBSE parametric diagram.
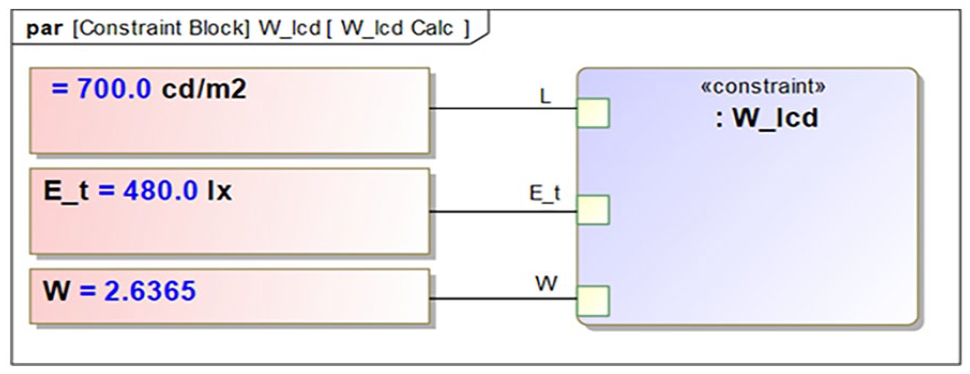
Glare rating calculation for initial ELD location.
The use case for the initial screen distance and orientation provided a Wlcd of 2.637 or reasonably unacceptable. The final adjustment yields a Wlcd of 5.273 of barely acceptable and meets the minimum glare explored stakeholder need shown in Figure 18 .
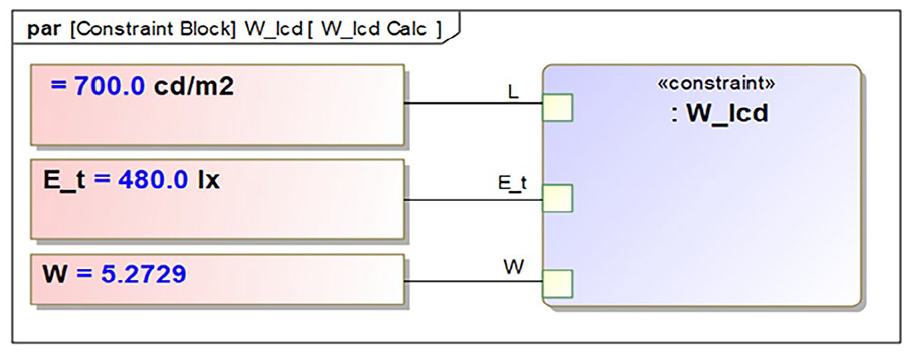
Glare rating calculation for adjusted ELD location.
Design Iterations
The Zirkona platform above the HVAC controls was shortened in two successive iterations to increase accessibility. The platform used a gusset to the far-right edge to reduce vibration and increase strength. Rounded edges reduced interference with controls. Elastomeric pads were sandwiched between the molding of the truck and the back of the mount to reduce vibration and mitigate noise potential. The adjustment lever was orientated to the outside of rod stays for adjustment simplicity.
Future Research
Future research should consider natural lighting of the operating environment (day/night), all tests were completed during the day. Surveys completed by drivers will provide valuable feedback for new requirements and suggest design enhancements going forward. A demand for more production units will allow for more build cycles and design enhancements.
Conclusion
A human factors engineering approach combined with model-based systems engineering led to driver centric designs for an electronic logging device mount in a heavy truck. During this process, it was discovered that the de Boers rating scale needed to be updated to account for LCD technology. This new equation, the so-called Rudder rating, gives human factors engineers methods to quantify discomfort from LCD displays. The paper demonstrates how to complete this task using both analytical and MBSE models using the updated rating scale. Overall, the project was successful and the prototype for the ELD mount was advanced to production.
Footnotes
Acknowledgements
Monica, Garrett, Carolina, and Cale Bumgarner for supporting the drafting process. Eric Kopp, Chris Kelley, Randy Bohman, Chad Sullivan, Kyler Pope, Jeff Collins, Terry Belue, Andy Allen, Aaron Kuhn, Chris Harrell, Nick Thompson, and Jim Raynor for supporting mount ideas and prototyping the mount. Additionally, Ben Gardiner held the authors accountable for standards and volume.
Declaration of Conflicting Interests
The author(s) declared no potential conflicts of interest with respect to the research, authorship, and/or publication of this article.
Funding
The author(s) received no financial support for the research, authorship, and/or publication of this article.