
Abstract
Microreactors for generating electricity in remote areas, such as mining sites, offer the potential for autonomous nuclear reactors, enabling self-sufficient mitigation measures. Remote operation allows experienced teams to oversee and manage operations from a command center, which may be located in a geographically distinct location. Using digital twins, real-time simulations of the reactor alongside its actual instrumentation and control system parameters, as certifiers has been proposed to ensure data accuracy. By comparing signals from the actual reactor with predictions from the digital twin models, data certification can be achieved. The details of this system are beyond the scope of this paper and can be found elsewhere. This research addresses the fundamental hypothesis of whether an operator can interpret three distinct data sources of the same system to successfully identify discrepancies and its root cause.
Introduction
With growing emphasis on clean energy production, generation IV reactor designs are emerging to replace existing reactors and potentially expand the nuclear portfolio.
The International Atomic Energy Agency reports that 32 countries generate an average of 22.7% of their power from nuclear sources, with France and the United States accounting for 64.8% and 18.6%, respectively (International Atomic Energy Agency, 2023). Generation IV reactor designs provide nearly autonomous operations with anticipatory maintenance (Owusu et al., 2018). These designs are typically smaller than previous reactors, including small modular reactors (SMRs), microreactors, SMRs are rated to operate at a maximum of 300 MWe and microreactors operate up to 50 MWe. These smaller reactors allow sites to be more configurable and, in the case of microreactors, even easily transportable. Microreactors could provide a safe, reliable, and carbon free energy source for defense, research, or commercial applications and even deliver process heat for commercial processes in geographically isolated areas.
Training and staffing an operating crew in these geographically isolated areas to operate a single microreactor would be exorbitantly expensive, not to mention potential personnel moves in tandem with transportable moving them when the microreactor is relocated. With the safety improvements in generation IV reactors leading to minimal operator intervention, the operation of multiple microreactors remotely is a possibility. Remote operations of a nuclear reactor would require a robust communications network along with a method to verify the accuracy of the data presented to the operator. One such method is the use of digital twins to provide a real-time simulation of the reactor. This leads to three data streams that would be compared in a digital twin-based certification system (DTCS) to ensure the accuracy of the data presented to the operator (Stevens et al., 2023). Figure 1 contains a graphic that shows the proposed flow path for the DTCS. The data on all three data streams is useful for operator diagnosis and therefore should be available to the operator, but tripling the amount of information available in the control room is not the solution either.
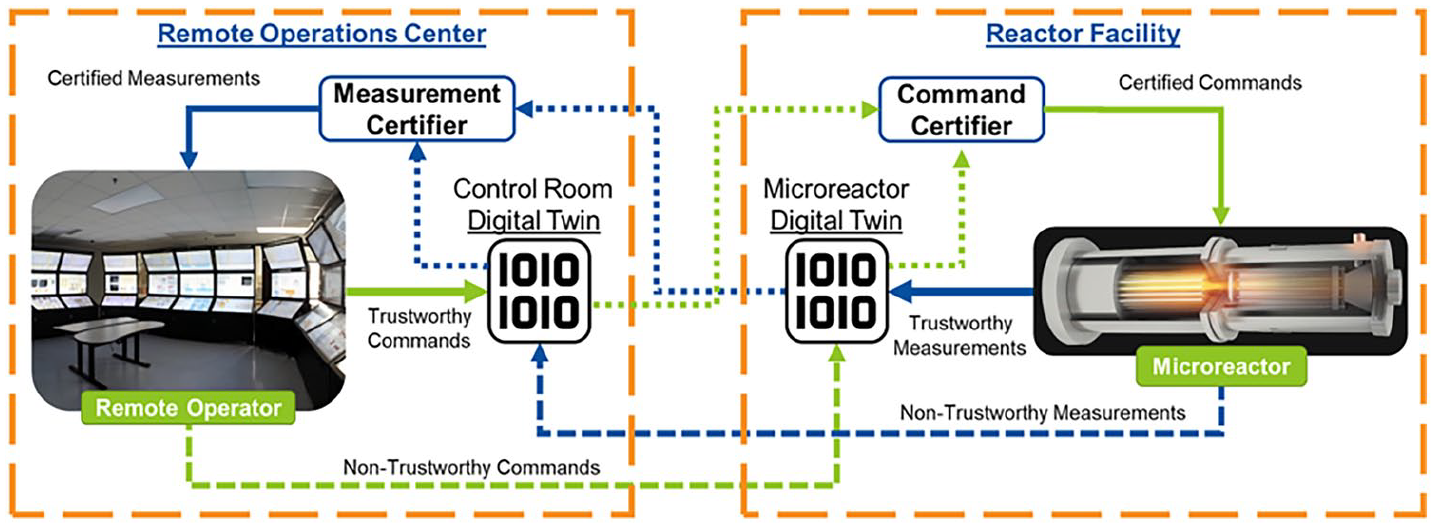
Digital twin certification system.
Displaying pertinent information within the challenging context of a large and complicated system data is not new in nuclear process control. Most notably, Three-Mile Island had vital information relevant to a component failure, or casualty, on a panel hidden from the operators for large portions of the casualty. The operator task now requires the additional task of source monitoring and verifying the authenticity of three reactor models to identify communication, sensor, and physical component failures. Extreme care must be taken to present this information without overwhelming the operator. To avoid overwhelming the operator, the DTCS is utilized to trigger a simple and detailed view of the information presented to the operator. The simplified view only displays the information on the selected data stream, whereas the detailed view displays extra information to allow the operator to rapidly diagnose the cause.
To develop and evaluate the concept of remote operations with digital twins certifying data feeds, a protype human-machine interface (HMI) was developed for Single Primary Heat Extraction and Removal Emulator (SPHERE), a test bed developed by Idaho National Laboratory and other laboratories for heat pipe performance and instrumentation research. It has been used as a non-nuclear test bed supporting microreactor research, which makes it ideal as a stand-in for a microreactor in the remote operations project (Qin et al., 2022). Development was done in C# within the .NET framework. .XAML files were utilized within Windows Presentation Foundation to generate the HMI. An application was made to facilitate data transfer between LabView and the HMI.
Human-Machine Interface Prototype
Human factors has recently undergone a resurgence in utility interest due to ongoing efforts to modernize control rooms, such as the turbine control systems outlined in NUREG-0711 (Boring et al., 2015). These updated nuclear process control HMIs are built to specifications drafted by one of a few architect and engineering firms that have established safety track records. Although the updated HMIs undergo significant quality and assurance evaluations to ensure the control logic is sound, human factors issues can readily be encountered in older digital system modifications. Some of the general established human factors’ standards that are used as a reference in these designs can be found in NUREG-0700, which served as the guiding philosophy for the prototype HMI seen in Figure 2.
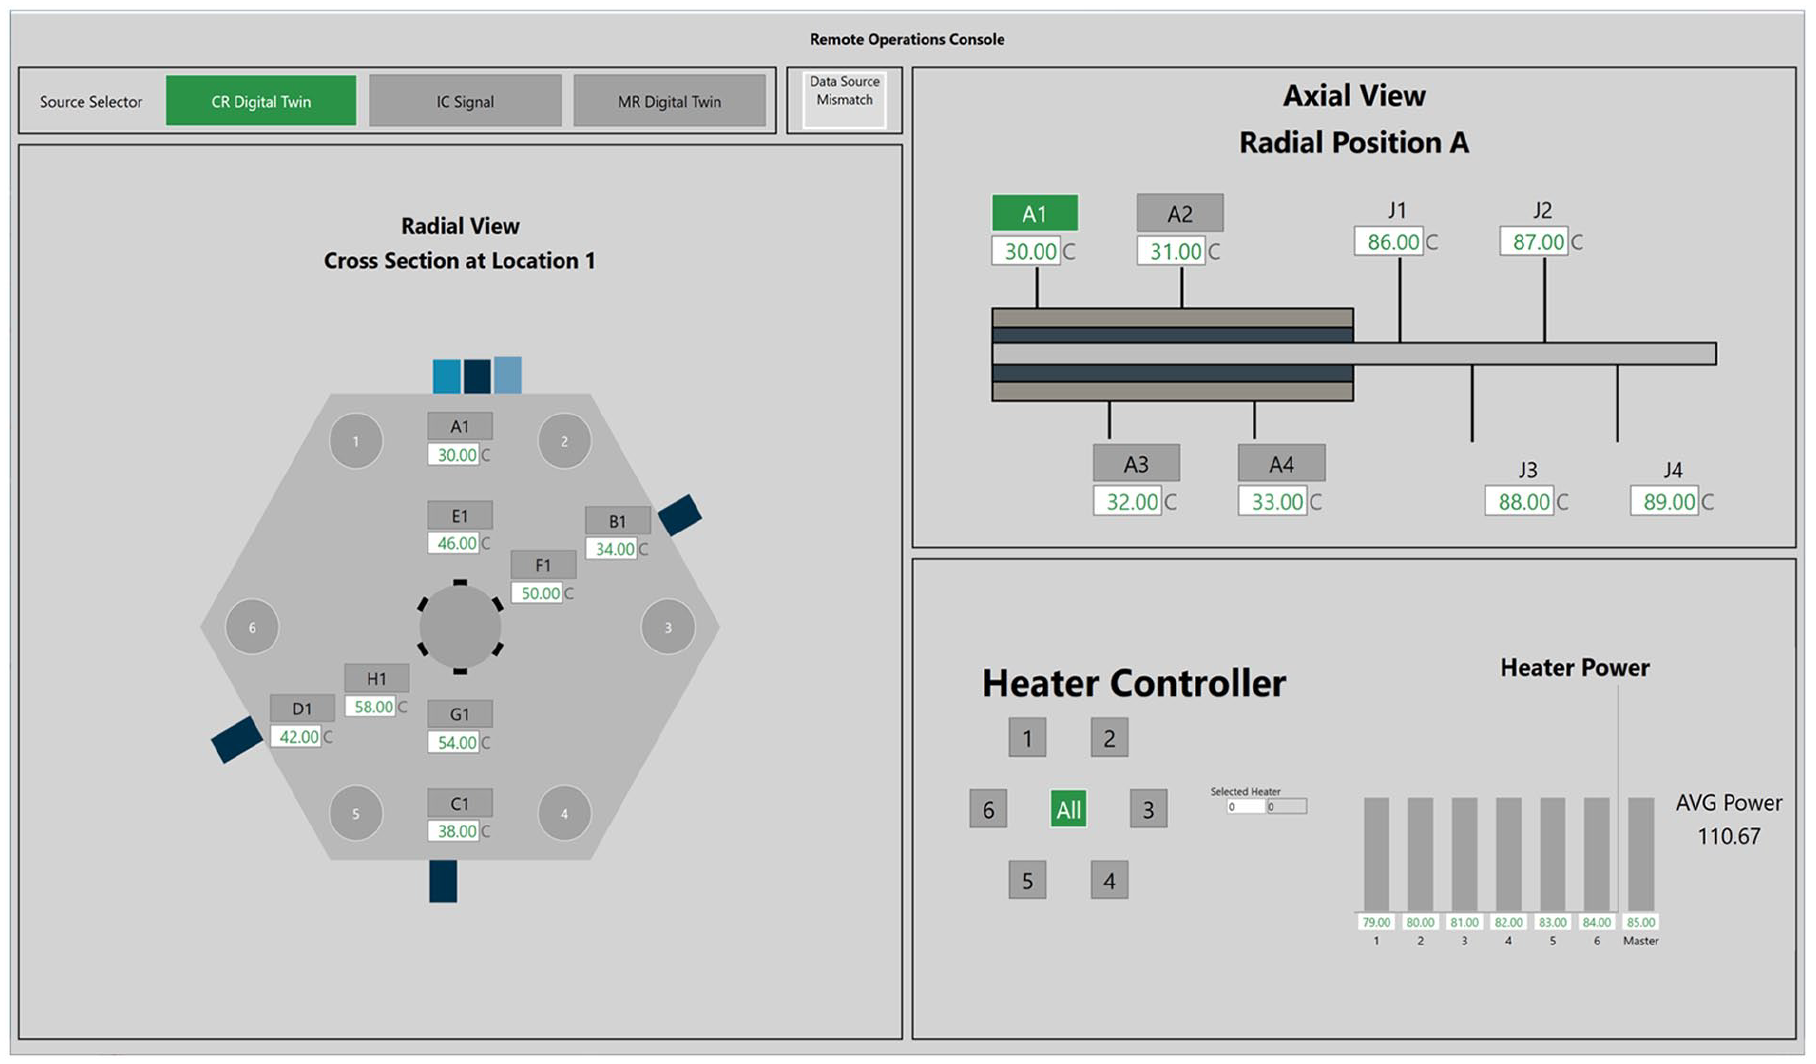
SPHERE HMI prototype.
A multitude of the principles were utilized when designing the screen; however, two design principles can be highlighted specifically from Orientation Features of the Display Selection and Navigation section, section 2.5.1.1 (Ohara, 2020). The first principle to highlight is Organization of the Display Network, which calls for the display to reflect logic that should be obvious and readily understood by the user. The prototype HMI achieves this similarly to the example in the “additional information” section of 2.5.1.1-1 of NUREG-0700, maintaining information of different radial slices and different channels in the same locations as the views are cycled by the operator.
The second principle to highlight is Perceptual Landmarks (Ohara, 2020). By mimicking the layout of SPHERE on the HMI, the operator should have enhanced wayfinding. It should also promote increased understanding of the plant since the temperatures are in the same relative location as they are in the plant.
This simplistic heat pipe system did not merit a formal specification process and official documentation. Instead, the developers observed the system operation, including a custom-built LabView controller HMI. The system operator was questioned to determine which parameters should be included on the display. This informal specification resulted in a total of over 42 parameters that should be included in the graphical user interface. Once this basic set of elements was identified, the grouping of these and their representation was identified. Based off this initial review, there are four main regions of the display: axial view, radial view, data source selector, and controller. Every system and its associated process is unique in this respect, though there are common principles, such as functionality grouping in which common elements are proximally arranged at a location to convey their distinct and common functionality. Instrumentation and control (I&C) schemes consider the minimally viable set of elements required to monitor and control a process at a given operating condition, often a steady-state full production configuration. HMI design must similarly identify the minimal I&C configuration to minimize cost while maximizing process insight and in turn allowing for the appropriate resolution and manipulation points for effective process manipulations component failure mitigative responses.
The I&C for this test platform was specified using this scheme to support a test engineer to execute and monitor heater manipulations for targeted setpoints. A custom LabView controller was developed to provide a basic experimental HMI. The authors reviewed this HMI since it contained a comprehensive set of I&C points. The HMI development focused on exploring how to present multiple sources of data and perform diagnostics across different groupings of this data. In this system, there are two logical groupings of instruments: the radial and axial sets of thermocouples.
Radial View
The radial view overlays the data from the thermocouples on a top-down view of a simplified SPHERE diagram with their locations representative of their relative location in the actual system to orient the operator as seen in Figure 3. Along with the temperature read by the thermocouples, a placard identifies the thermocouple while also acting as a button for the instrument view control. This is flanked by a dynamic spar that will be described later in the axial view section.
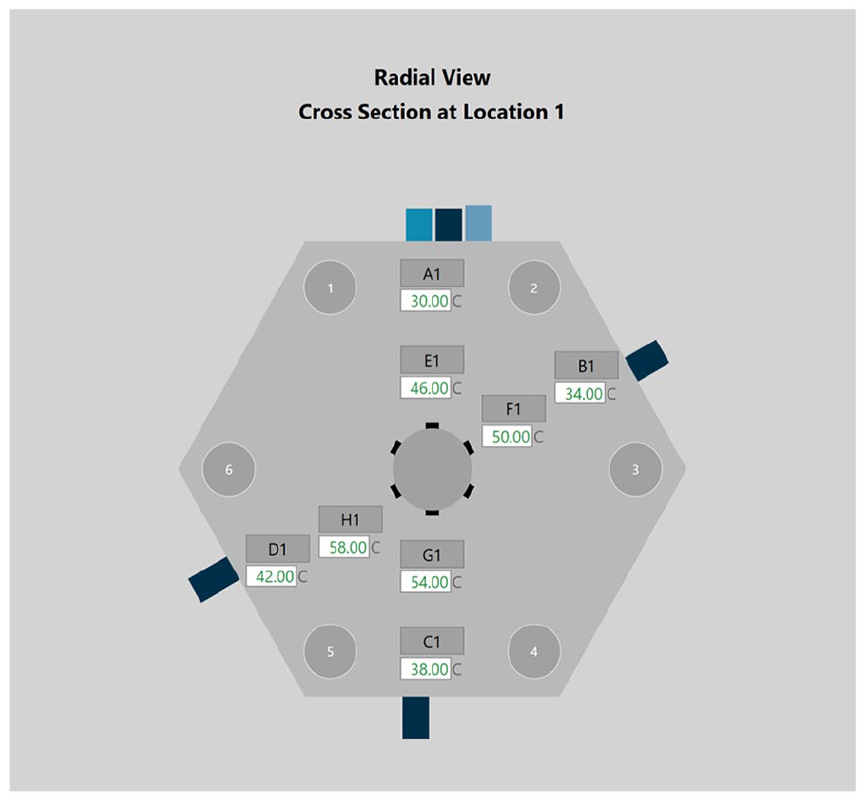
Top-down view of SPHERE.
Instrument View Control
There is a lot of data to display on the SPHERE system, including 36 thermocouples, all of which are duplicated for the two digital twins. To minimize the clutter on the display, a decision was made that convolutes the control process. The radial level is selected in the axial view section, and the axial region is chosen on the radial screen. This would likely require training for operators to become familiar with the control schema but allows for the number of displayed temperatures to decrease from 68 to 16.
With this control schema, it is also important to ensure the operator is always aware of what views are currently selected. This is achieved with dynamic titles that update with the selected positions as well as conspicuously colored buttons that highlight the selected position.
Axial View
The axial view provides displays the thermocouple data for the selected element as described in the Instrument View Control Section above. In SPHERE, there are four distinct thermocouples for each element and four common thermocouples for the system, as seen in Figure 4. The positions in the HMI are representative of the thermocouple positions in SPHERE to aid the operator in locating possible hot spots.
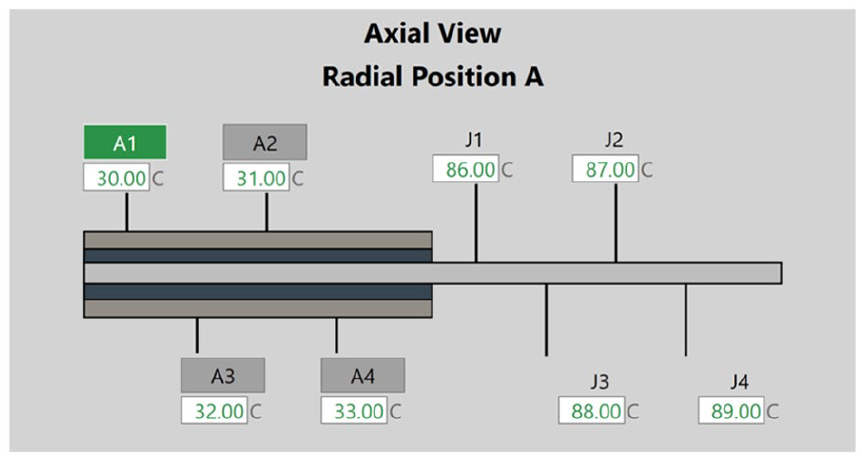
Side view of a single SPHERE element.
Control Display
To fully test the remote operations of SPHERE, the HMI had to accommodate sending and receiving commands, so a simple method of setting heater element power was developed. A heater, or all, is selected via the toggle buttons that are oriented to aid the operators understand which element is receiving the order. The white box takes the user entry, and the grayed-out box displays the elements heating elements current power setpoint.
Data Source Selection
Given the presence of three simultaneous data streams, the operator must remain cognizant of which one is currently displayed on the HMI. To assist the operator, the source selector toggle button is conspicuously colored at the top of the screen, allowing the operator to view the other data streams while remaining aware of the selected data source. The Data Source Selector is shown in Figure 5 with the control room digital twin data stream selected.
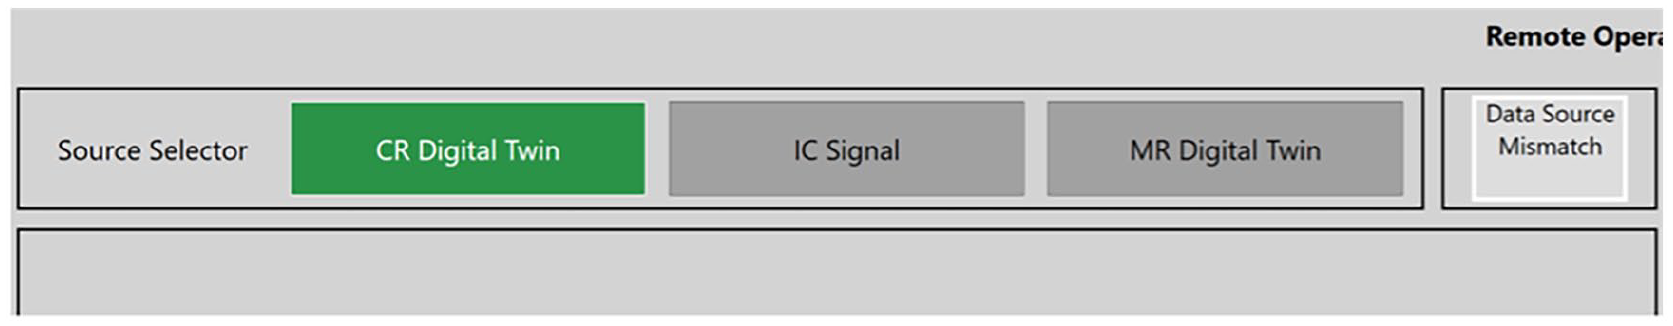
Data source selector intended to saliently convey the currently displayed data source.
Certification Functionality
Data Source Mismatch Alarm
Since it could be difficult to notice the radar plot change, an audible alarm was provided to alert the operator. There are plans to improve this alarm with on-screen alerts for the operator. This includes highlighting diverging data with a red box to bring the operator’s attention to the item. Another idea is to have the Data Source selection button of the stream that differs from the other two to flash.
Dynamic Spar
An element within the HMI, which we refer to as the “radar plot,” consists of four subelements that are tied to thermocouples. The height of each line is represented via the relative height of each subelement on the HMI. The radar plot has a simple and detailed view mode, depending on the output of the DTCS. When the data is certified, only the data from the reactor is represented by the radar plot since all the sources should match. When the data fails certification, all three data sources will be displayed simultaneously, allowing for the rapid identification of the diverging input.
Discussion
This HMI was designed for SPHERE and therefore is much simpler than what would be required for operating a reactor. In a real reactor, there would be several more systems that would need to be displayed to accurately represent its state. However, the design principles of minimizing clutter, representing the three data streams individually if the DTCS certifies the data, and the presence of a data source mismatch alarm should be carried forward in HMIs designed for a reactor.
An example of applying these principles to adapt an existing screen would be adapting the heating power bar plot, useful in the SPHERE implementation, to a nuclear instrument (NI) plot. For this example, let’s assume a reactor has three NIs with two channels. This results in six channels that could be displayed, minimizing the changes to the existing screen for this example. Figure 6 portrays how the NI plot would adapt the design ideas of the radar plot to aid the operator to rapidly identify that the digital twins and live data stream have diverged, while an example of what the figure would look like with the data certified by the DTCS can be seen next to the heater controller in Figure 2.
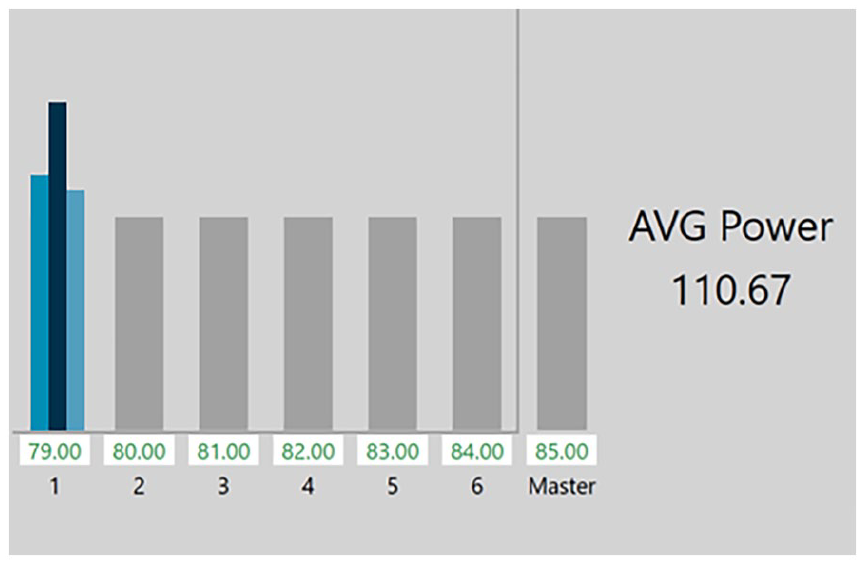
NI plot when channel one fails data certification.
There are many more items that would need to be designed or adapted from the SPHERE HMI. However, the design principles should be followed to the maximum extent possible to aid the operator.
Conclusion
It is important to note that this design has not been tested by individuals outside of the design team itself. Although a member of the design team has operational experience, it is possible that some items aren’t clear to someone who wasn’t involved in the HMI’s design. This will change in the future as the project matures and more people are given the opportunity to operate the system and provide feedback. Soon, the HMI will be tested during SPHERE operation, which will also provide valuable insight.
Although the HMI has not yet been used to operate, there are some elements that need to be retained in future iterations that incorporate digital twins. The first, and most obvious thing, is a method to ensure the operator is constantly informed on the source of the data currently on display. The current iteration achieves this via conspicuously colored buttons to indicate what is selected in conjunction with dynamic titles. Secondly, a method to rapidly compare the different data sources to aid the operator make a swift diagnosis if there is an issue. This is achieved by displaying data that is not certified by the DTCS, which simultaneously minimizes information irrelevant to the operator while allowing the rapid comparison of data between the data sources. Lastly, the presence of a data source divergence alarm to audibly and visually alert the operator to data verification failure. When the DTCS does not certify the data, an alarm will sound to alert the operator.
NuScale in 2020 received permission from the Nuclear Regulatory Commission (NRC) to follow the NuScale-specific minimum licensed operator staffing requirements in lieu of 10 CFR 50.54 m (NRC, 2020). The NuScale minimum staffing requirement calls for one senior reactor operator and two reactor operators to operate a fleet of 12 SMRs (Rad, 2020). This is relevant due to the possibility of multiple microreactors in separate geographic locations being operated from a single control room. This possibility is why minimizing the on-screen clutter was implemented as a design principle. It is still unclear if this HMI could scale to allow operating multiple reactors simultaneously. It is also possible that microreactors of different designs or ratings could be operated.
The presence of digital twins hardens the system to communication issues, such as cyberattacks, but introduces the challenging task to interpret three separate data streams. As communication is a critical requirement for remote operations, providing information assurance with this approach improves the viability of the remote operations of microreactors and in turn accelerates their deployment. This HMI was designed for operating an experimental test bed but serves as a proof of concept for actual microreactor systems. The need for these more sophisticated methods of monitoring systems remotely is necessary to achieve reduced and more efficient staffing comprised of a centralized operations center overseeing a fleet of distributed microreactors. Developing rapid issue detection and diagnoses becomes increasingly important as the scale of the reactor fleet increases and operators must contend with numerous physical, sensor, and communication issues. Concern over cyberattacks lead to duplication of data streams which require solutions such as what has been presented here, though other approaches are welcomed. This paper is meant to serve as a first step toward the remote operation of nuclear reactors.
Footnotes
Acknowledgements
This work of authorship was prepared as an account of work sponsored by Idaho National Laboratory (under Contract DE-AC07-05ID14517), an agency of the U.S. Government. Neither the U.S. Government, nor any agency thereof, nor any of their employees makes any warranty, express or implied, or assumes any legal liability or responsibility for the accuracy, completeness, or usefulness of any information, apparatus, product, or process disclosed, or represents that its use would not infringe privately owned rights.
Declaration of Conflicting Interests
The author(s) declared no potential conflicts of interest with respect to the research, authorship, and/or publication of this article.
Funding
The author(s) received no financial support for the research, authorship, and/or publication of this article.