
Abstract
Objective
The objective of this study was to estimate trust from conversations using both lexical and acoustic data.
Background
As NASA moves to long-duration space exploration operations, the increasing need for cooperation between humans and virtual agents requires real-time trust estimation by virtual agents. Measuring trust through conversation is a novel and unintrusive approach.
Method
A 2 (reliability) × 2 (cycles) × 3 (events) within-subject study with habitat system maintenance was designed to elicit various levels of trust in a conversational agent. Participants had trust-related conversations with the conversational agent at the end of each decision-making task. To estimate trust, subjective trust ratings were predicted using machine learning models trained on three types of conversational features (i.e., lexical, acoustic, and combined). After training, model explanation was performed using variable importance and partial dependence plots.
Results
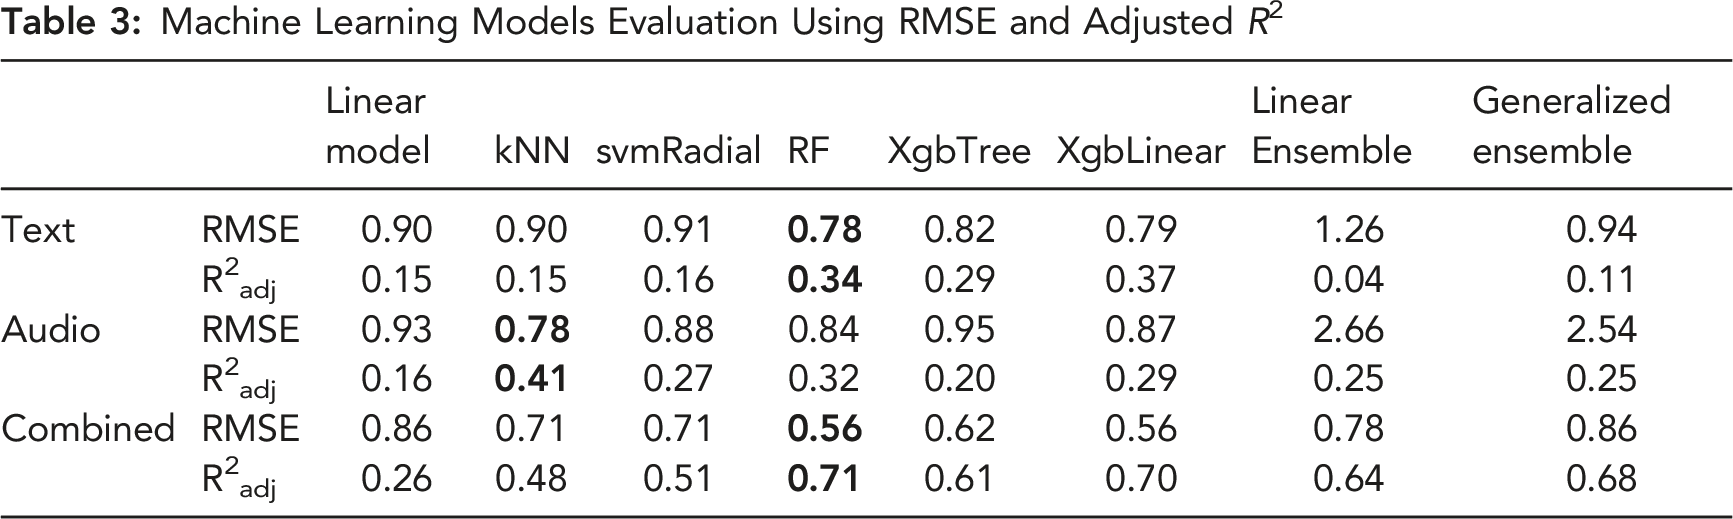
Results showed that a random forest algorithm, trained using the combined lexical and acoustic features, predicted trust in the conversational agent most accurately
Conclusion
Precise trust estimation from conversation requires lexical cues and acoustic cues.
Application
These results showed the possibility of using conversational data to measure trust, and potentially other dynamic mental states, unobtrusively and dynamically.
Keywords
Introduction
As the National Aeronautics and Space Administration (NASA) moves to long-duration space missions, longer time delays in communication between crews and ground control will require more cooperation between the humans and the onboard virtual agent (Chiou and Lee, 2016, 2021; Johnson et al., 2014; Trafton et al., 2006). In this human-autonomy team (HAT), trust, defined as “the attitude that an agent will help achieve an individual’s goals in a situation characterized by uncertainty and vulnerability” (Lee and See, 2004, p. 54), plays an essential role and affects various team processes including information sharing, decision-making, and ultimately team success (Endsley et al., 2021; Krausman et al., 2022). To better manage the HAT, it is important to first measure trust unobtrusively and dynamically.
Three main types of measurements have been developed to capture trust: subjective, behavioral, and physiological (Kohn et al., 2021). For subjective trust measurements, people self-report their feeling and attitudes by answering survey items. While self-reported trust is most frequently used and often treated as the gold standard, it is unable to satisfy the need for unobtrusively monitoring trust dynamics, especially in time-pressured, risky situations, such as space missions or autonomous driving (Li et al., 2020; Yang et al., 2021). Behavioral measurements can unobtrusively estimate trust through interactions with the automated system, which can be passive (reliance) or active (compliance). Although behavioral measurements allow a minimal disruption and a higher sampling rate than self-report, the metrics are often task-specific and hard to generalize. Physiological measurements capture biological responses ranging from heart rate changes to eye gaze tracking to neural activation. They present a great opportunity for real-time trust estimation (Azevedo-Sa et al., 2021). However, collecting high-quality physiological data (e.g., electroencephalogram and skin conductance responses) often requires specialized and intrusive hardware (e.g., electrodes on the scalp or hands), which is challenging to implement in real-world applications. One rich, but often neglected, source of data for measuring is team communication. With the increasing level of interdependency in HAT, there is an increase in information exchange between human and AI teammate, which can reflect team cognition and processes (Cooke et al., 2013). In conversations, people may change what they say and how they say it based on their trust of their AI teammate. According to previous theoretical research by Lee and See, trust is mainly an affective process (Lee and See, 2004). However, current measurements, such as subjective ratings, do not adequately reflect this affective aspect of trust, which is a major limitation when compared to conversational measurements. In this paper, we demonstrated that measuring trust from conversations provides a promising yet under-explored approach. We took the first step in this direction by predicting and validating trust based on structured conversations with a conversational agent that supported a complex decision task. Additionally, we identified the important conversational features for trust prediction. Our findings provided theoretical implications for developing conversational measurement of trust and adaptive conversational strategy of a trustworthy AI teammate.
Background
Measuring Trust via Communication
Although communication plays a vital role in driving HAT success, measuring trust via communication is still a new approach. Communication can manifest conscious and subconscious mental states. Trust, which reflects both analytic and affective processes, can be analyzed and measured via communication (Lee and See, 2004). Prior literature on HAT usually uses communication patterns such as communication rates and flows to predict trust (Bromiley and Cummings, 1995). Limited research has been focusing on communication content for trust measurement. Although the most explicit way of expressing and sensing trust is via words that directly pertain to trust (e.g., I trust you), it is unnatural and rare for people to express a direct attitude in a performance-based task. Thus, we should elicit and infer people’s trust via processing and analyzing signals exhibited by individuals in conversations (Vinciarelli et al., 2009). To do so, we need to first elicit utterances by designing trust-relevant situations with appropriate conversational prompts. Our prior work developed a trust lexicon and a general framework on how to design appropriate conversational prompts (Alsaid et al., 2022; Li et al., 2020). Once we elicit trust-relevant conversations, we can process and analyze the conversational cues to estimate people’s trust. According to the well-known phrase, “It’s not only what you say, but also how you say it.”, both the words and how they are said should convey trust. Therefore, in this paper, we consider not only lexical cues (e.g., words used), but also acoustic cues (e.g., pitch, formants) (Elkins and Derrick, 2013; Johnson et al., 2014).
Lexical Indicators of Trust
Lexical features in the conversation contain rich information including the length of the utterances (e.g., word count), word choices, and sentiment (Spitzley et al., 2022). The most frequent and simple measure is word count. Prior literature has shown that there is a positive correlation between word count and perceived trustworthiness in online dating profiles and lending load requests (Larrimore et al., 2011; Toma and Hancock, 2012). Based on the uncertainty reduction theory, the more information is provided, the less uncertainty, and the higher the perceived trustworthiness (Beller et al., 2013; Kramer, 1999). Yet, little is known for whether this correlation holds true with the lexical features of trustor’s communication (i.e., higher trust, less words). For the sentiment in the conversations, prior research has shown that verbal positivity is positively correlated with perceived trustworthiness of organizational leaders (Norman et al., 2010). Additionally, people also found the positive association between positive sentiment in trustors’ word responses (e.g., excited, interested) and affective trust when interacting with a conversational robot (Hildebrand and Bergner, 2021). Because benevolence is one of the core elements of trust (Mayer et al., 1995), it is expected that people would express positive affect when they trust their AI teammates.
Acoustic Indicators of Trust
The characteristic of the voices, or acoustic features, indicate people’s thoughts, feelings, and attitudes. The same set of words uttered with different volumes or intonations can express different feelings and the underlying message of the words (Sebe et al., 2005). Thus, when understanding how people express trust, it is crucial to exanimate acoustic features. Pitch, measured as the fundamental frequency (F0), is one key component of acoustic features. Vocal pitch has been shown inversely related to the perceived trust of the agent, especially during the early stages of interactions (Elkins and Derrick, 2013). Additionally, the high-variance F0 trajectory, indicated by a high starting F0 and then a marked decrease at mid-utterance to finish on a strong rise, was rated high in trustworthiness (Belin et al., 2017). Waber and colleagues found a correlation between emphasis, defined as the variations in pitch and volume, and initial trust in technical communication in hospital settings (Waber et al., 2015). Additionally, formants, the concentration of acoustic energy around a particular frequency in the speech wave, were also found to associate with trust. Montano and colleagues found that high-pitch but low formants voices, affecting perceptions of masculinity, were trusted more in a cooperative game (Montano et al., 2017).
While previous research has shown relationships between conversational features with perceived trustworthiness of an agent as a trustee, limited research has shown how people, as trustors, signal and express trust they place in that agent. Trust, as both analytic and affective processes, can govern people’s behaviors and the way they speak (Lee and See, 2004). It has been shown that people change their lexical and acoustic cues in conversation depending on whether they trust the agent or not on a binary scale (Gauder et al., 2021). However, to date, no research has shown 1) whether the continuous scale of trust can also be predicted and 2) what are the important indicators in conversations that can predict trust. In other words, limited research has investigated whether and how to measure people’s trust via conversations. One methodology that can resolve this question is machine learning (ML). Recently ML has been used to not only predict certain classes of data (e.g., trust), but also infer and explain the predictions (Zhao & Hastie, 2021). In our study, the goal was two-fold: First, we showed that a machine learning approach can make predictions of trust using a combination of acoustic and lexical indicators extracted from conversations. Second, we identified the important lexical and acoustics features underlying these predictions, which provide insights for future trust management in HAT.
Methods
Estimating trust using machine learning (ML) requires crafting a situation that produces variations in trust and generates repeated measures of trust. First, large variations in a ground truth trust measure are needed. We used a well-validated variable, automation reliability, which has shown a strong causal relationship with trust, as a proxy to induce variations of trust (Desai et al., 2012; Lee and See, 2004; Li et al., 2019). Second, a well-labeled target response (i.e., trust) is needed for supervised ML models. Thus, we collected subjective trust ratings along with conversational data. Third, to generate trust-relevant utterances, we designed open-ended conversational prompts with follow-up questions to elicit trust-related utterances. The questions were designed to be nondirective, which probes respondents to describe their own attitudes and feelings on topics of trust in automation instead of using the presumed attitudes and descriptions. Since we manipulated the automation reliability, we aimed to elicit participants’ responses related to the performance-based trust. The questions were developed based on our prior research on trust lexicon and conversational measures; see details (Alsaid et al., 2022; Li et al., 2020). Finally, trust changes as a dynamic process that varies across interactions (Yang et al., 2021). We designed multiple check-in points after every interaction with the automated system to ensure we captured multiple measures of trust.
Data Collection
Study Design
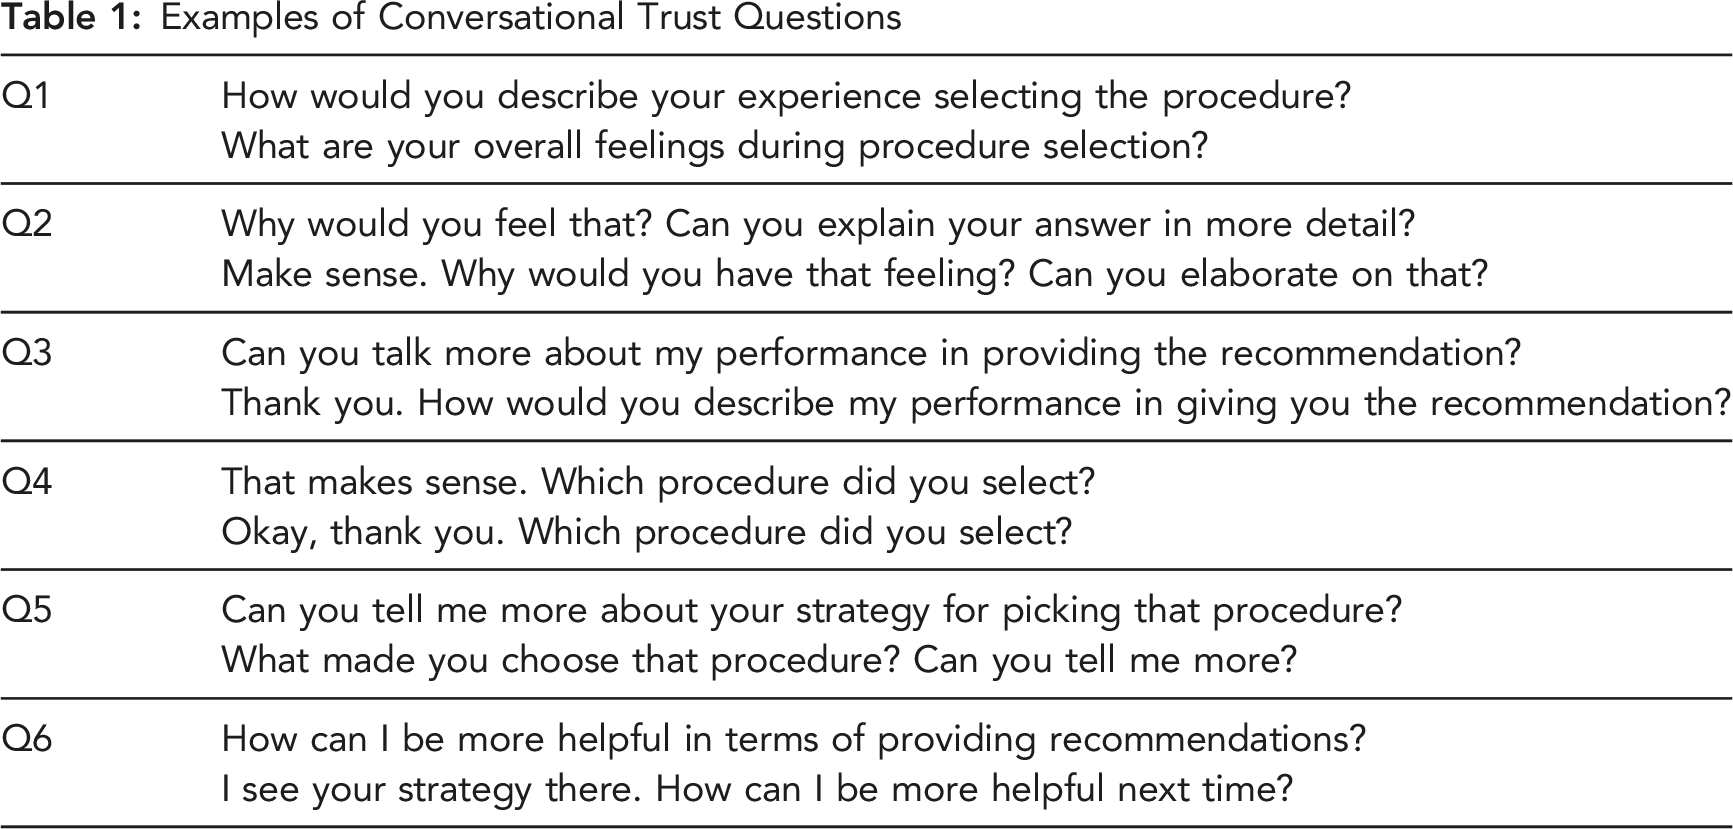
The study was a 2 (reliability) × 2 (cycles) × 3 (events) within-subject study (see Figure 1). Participants performed 12 decision-making tasks associated with managing a system of a simulated space station: the Habitat’s Carbon Dioxide Removal System (CDRS). Participants were assisted by a conversational agent with 2 levels of agent reliability (i.e., high, and low). Each level of reliability had 2 cycles of the CDRS tasks, each including 3 events (i.e., startup, venting, shutdown). The objective of the experiment setup is to induce substantial changes in trust and record the corresponding conversational indicators of trust for prediction. Adopted from prior research which used 4.9 and 1.4 out of 5 points for high and low performance agent (Gauder et al., 2021), a large variation is designed to change and anchor people’s trust level in a short-term study. Thus, the high-reliability conversational agent provided 100% correct recommendations, whereas the low-reliability agent provided 20% correct recommendations. The large difference between 100% and 20% reliability level is introduced to induce significant trust variations, which can be further reflected and captured in their conversations. For each event, the conversational agent provides two recommendations (i.e., recommend a procedure, provide suggestions on whether to rerun the procedure). For the low-reliability condition, the conversational agent would only make one correct recommendation out of six total suggestions. The twelve total events were designed to elicit various levels of trust through manipulation of the agent’s reliability. At the end of each event, the agent initiated a conversation by asking six trust-related questions (see Table 1). Once the participant finished the conversation, they then completed a 12-item trust survey on a 7-point Likert scale (Jian et al., 2000). In total, each participant had the opportunity for at least seventy-two conversational turns with the agent. Study design with 12 points of trust measurement. Examples of Conversational Trust Questions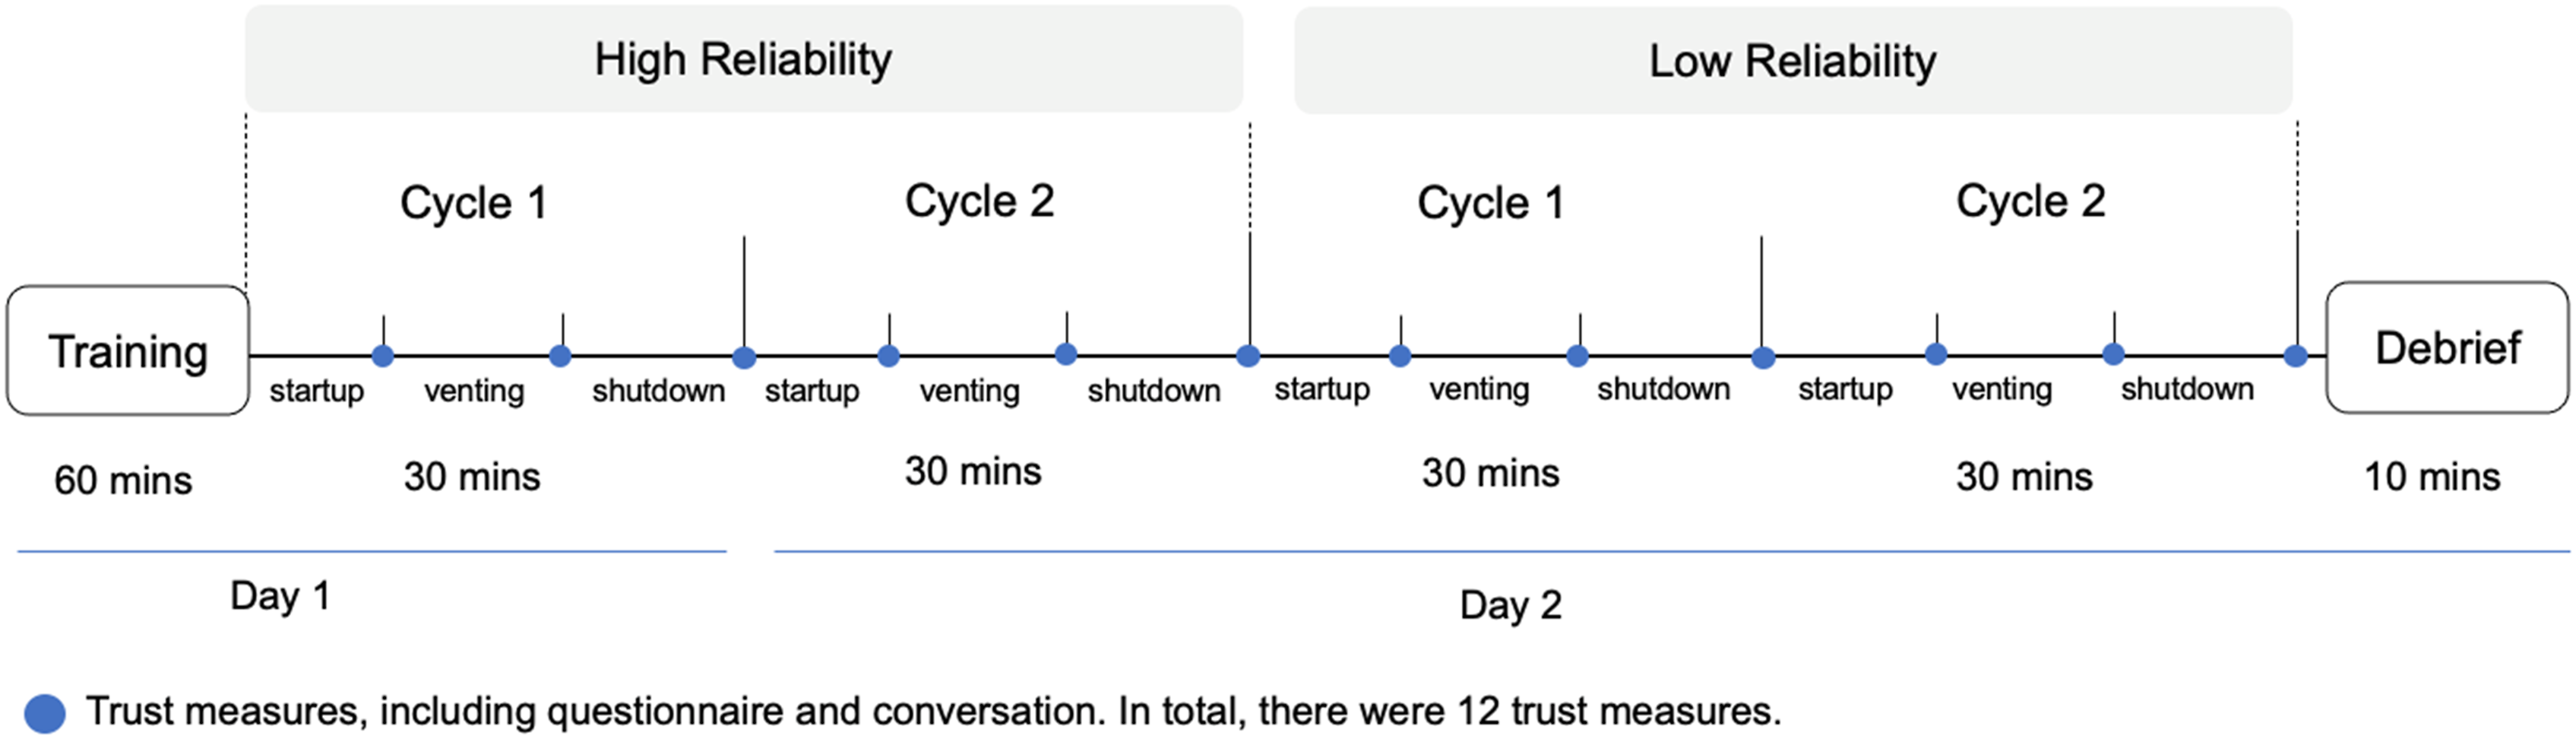
Participants
A total of 24 participants (18 female, 6 male) were recruited (M = 23.7, SD = 3.6). Participants were screened to have some technical background (e.g., completion of STEM courses). Due to the safety concerns of COVID-19, the study took place online. It was a 2-day study with each day lasting up to 2 hours. In total, the study was approximately 4 hours. Participants received $30 per hour for up to $120. This research complied with the American Psychological Association Code of Ethics and was approved by the Institutional Review Board at the University of Wisconsin–Madison.
Apparatus
The experimental task uses the Procedure Integrated Development Environment (PRIDE) which is an automated procedure software, to maintain the space station habitat using the Carbon Dioxide Removal System (CDRS) (Izygon et al., 2008; Schreckenghost et al., 2014). A conversational agent, named Bucky, was preprogrammed with procedure protocols to provide recommendations to help participants maintain follow the PRIDE procedures to maintain the habitat. Google Dialogflow, a Natural Language Understanding (NLU) platform was used to design and integrate the user interface. Participants were asked to directly speak to the conversational agent using their microphone. Keyboard and button inputs were also provided. Text data was automatically transcribed using speech-to-text technology. Both audio and text data were collected.
Procedure
After signing the consent form, participants completed training on PRIDE, CDRS, and Bucky systems. During the study, participants had 25 minutes to control the CDRS by completing all three events (startup, venting, and shutdown) before their crew experienced CO2 poisoning. For each event, the participant made two essential decisions with Bucky’s aid (i.e., procedure recommendation and verification suggestion). Participants will be asked to select the correct procedure to activate CDRS system in a specific order based on their knowledge from their training session. Bucky would provide a recommended procedure of CDRS and participants could either accept Bucky’s recommendation or reject it and manually select an alternate procedure among three system generated procedures. Once the procedure was selected, PRIDE automated the procedure execution. While the procedure was running, participants engaged in a secondary task of checking and reporting the CDRS status to Bucky. If the participant selected the wrong procedure, an error occurred. The participant then had to stop the procedure and reselected another procedure. If participants rerunning the procedures exceeded the 25-minute time limit, a warning would occur about the crew experiencing CO2 poisoning and the cycle is terminated. After the procedure finished running, Bucky provided a verification of the system status and make suggestions on whether participants should rerun the procedure. Again, participants could decide to accept or reject the suggestion. Once the participant finished the event, Bucky administered six conversational questions with some variations to avoid being repetitive (see Table 1). After conversational questions, participants completed the trust questionnaire. The total time of each cycle, including the trust conversation and questionnaire, was approximately 40 minutes. At the end of the study, participants were debriefed and compensated.
Machine Learning Pipeline
Figure 2 shows the machine learning pipeline we adapted from previous research (McDonald et al., 2020; McDonald et al., 2020). The conversations were first separated into audio, text, and combined data analysis streams. The audio and text features were extracted using speech signal processing and text analysis. The processed features were then used to fit the machine learning models. The best-performing model was selected based on root mean squared error (RMSE) and adjusted R-squared ( Machine learning pipeline to estimate and explain trust.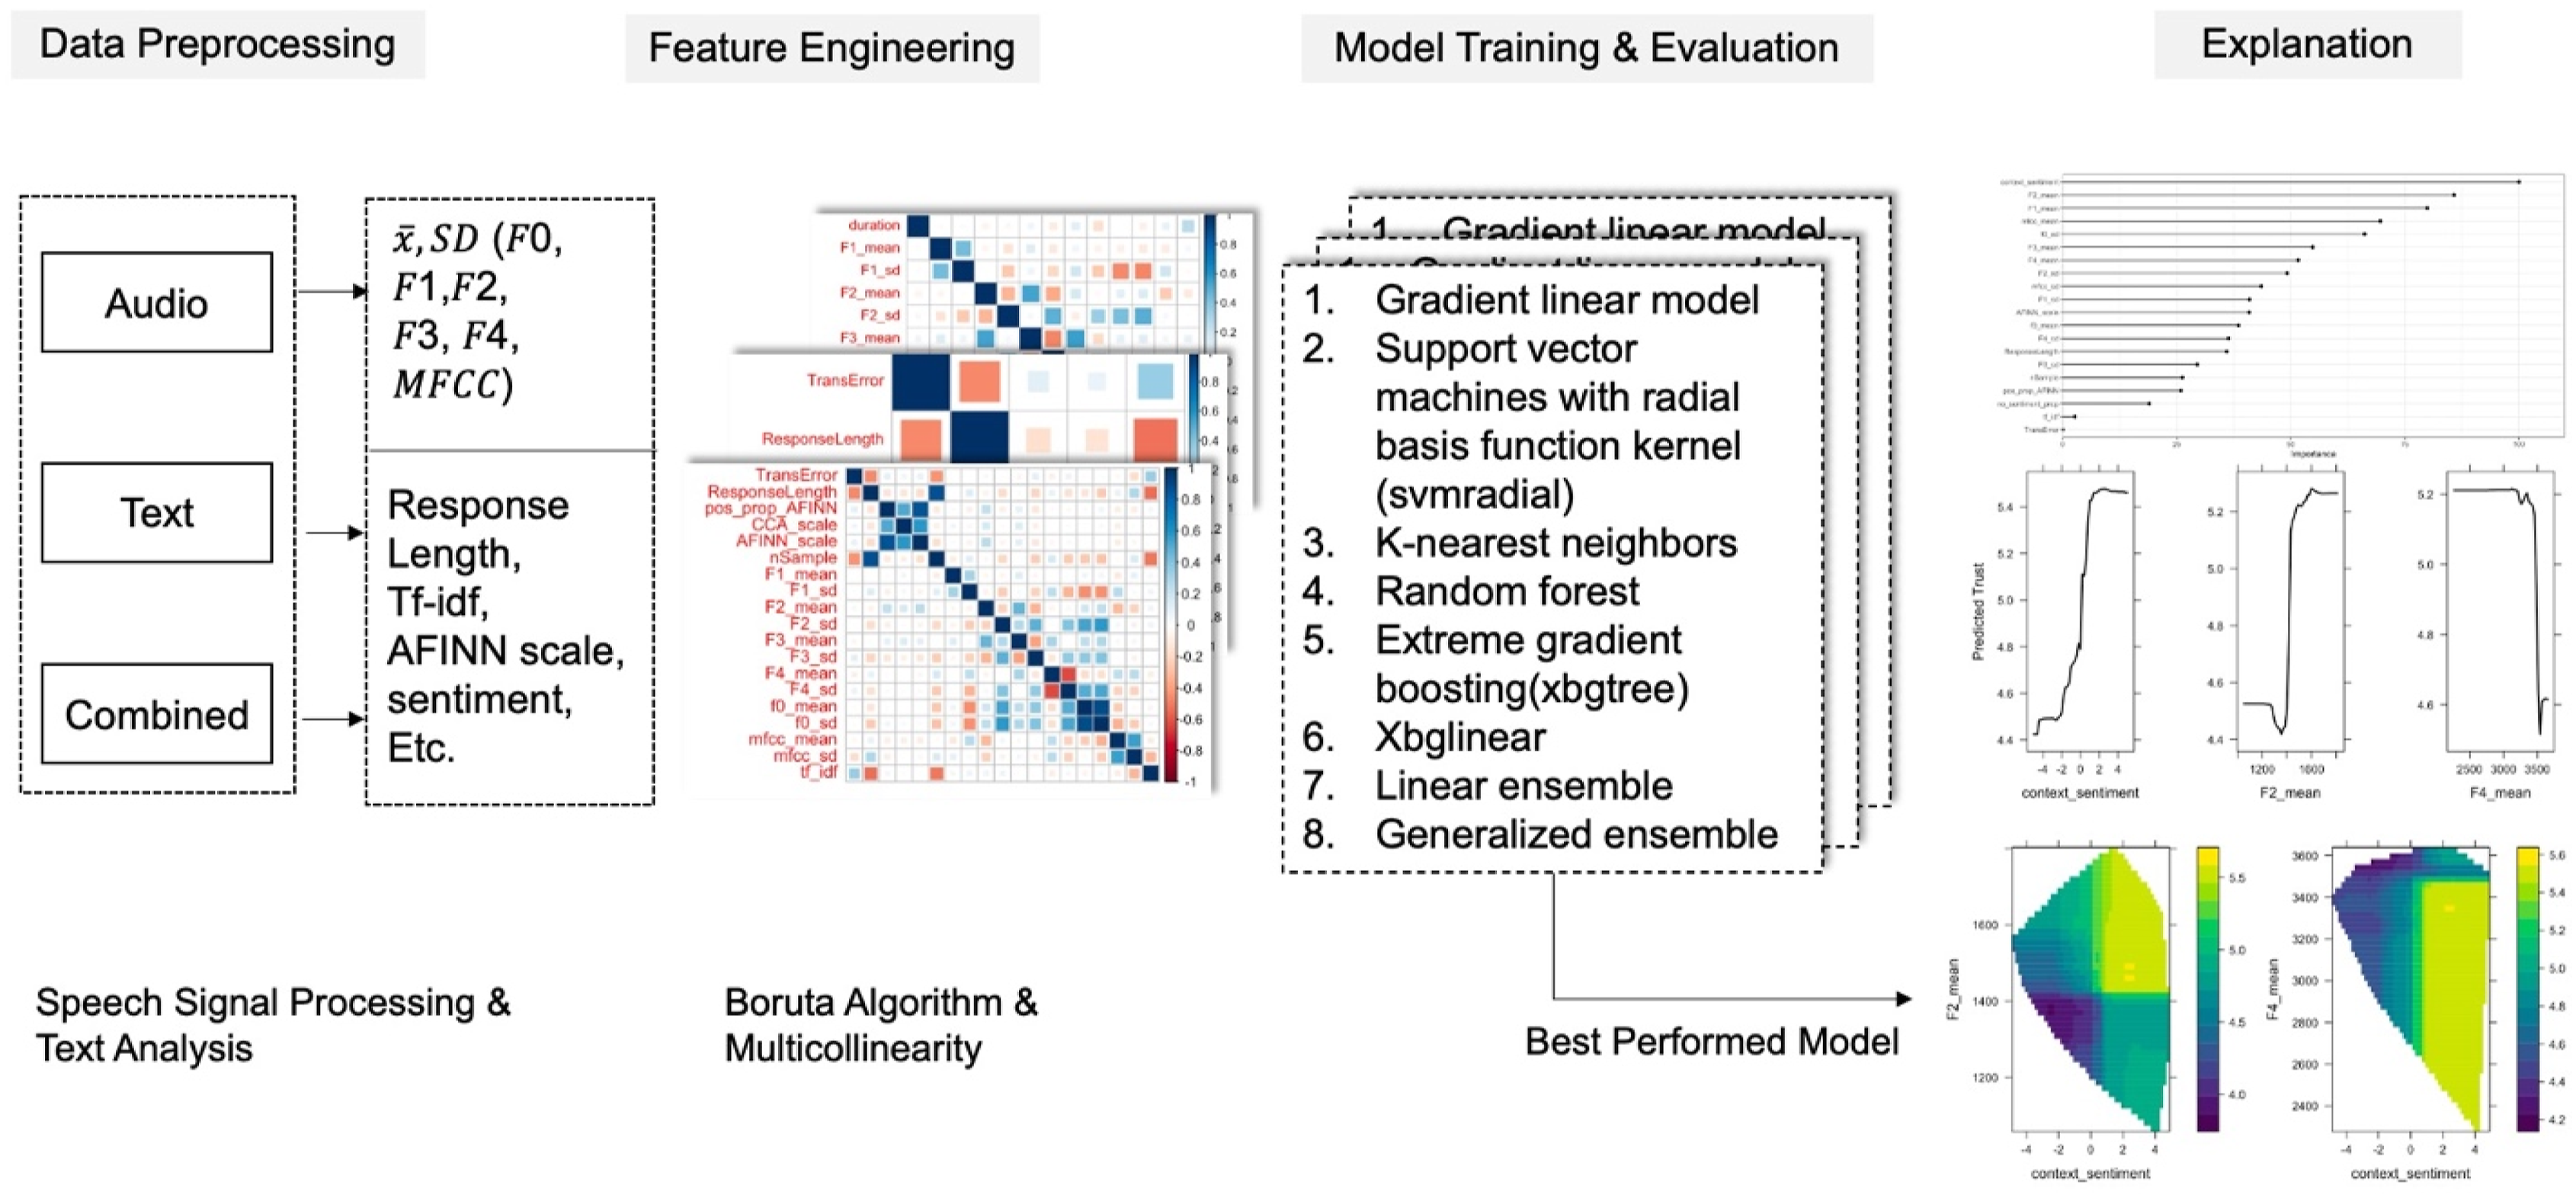
Data Preprocessing
For the response variable, trust, we calculated the subjective trust rating by averaging items 1–5, which represents trust, and averaging items 6–12, which represents distrust (Jian et al., 2000). We reversed the distrust score and averaged it with the trust score to get the final trust score.
For audio data, all the audio files were imported in R to extract acoustic features using the wrassp package (Bombien et al., 2021). A formant estimation function is used to calculate the first four formants and their bandwidths. For each formant, the mean and standard deviation were extracted. Fundamental frequency and Mel-frequency cepstral coefficients (MFCCs) were extracted using their mean and standard deviation. Since acoustics features are gender sensitive (Cartei et al., 2012), all acoustics features are normalized within gender.
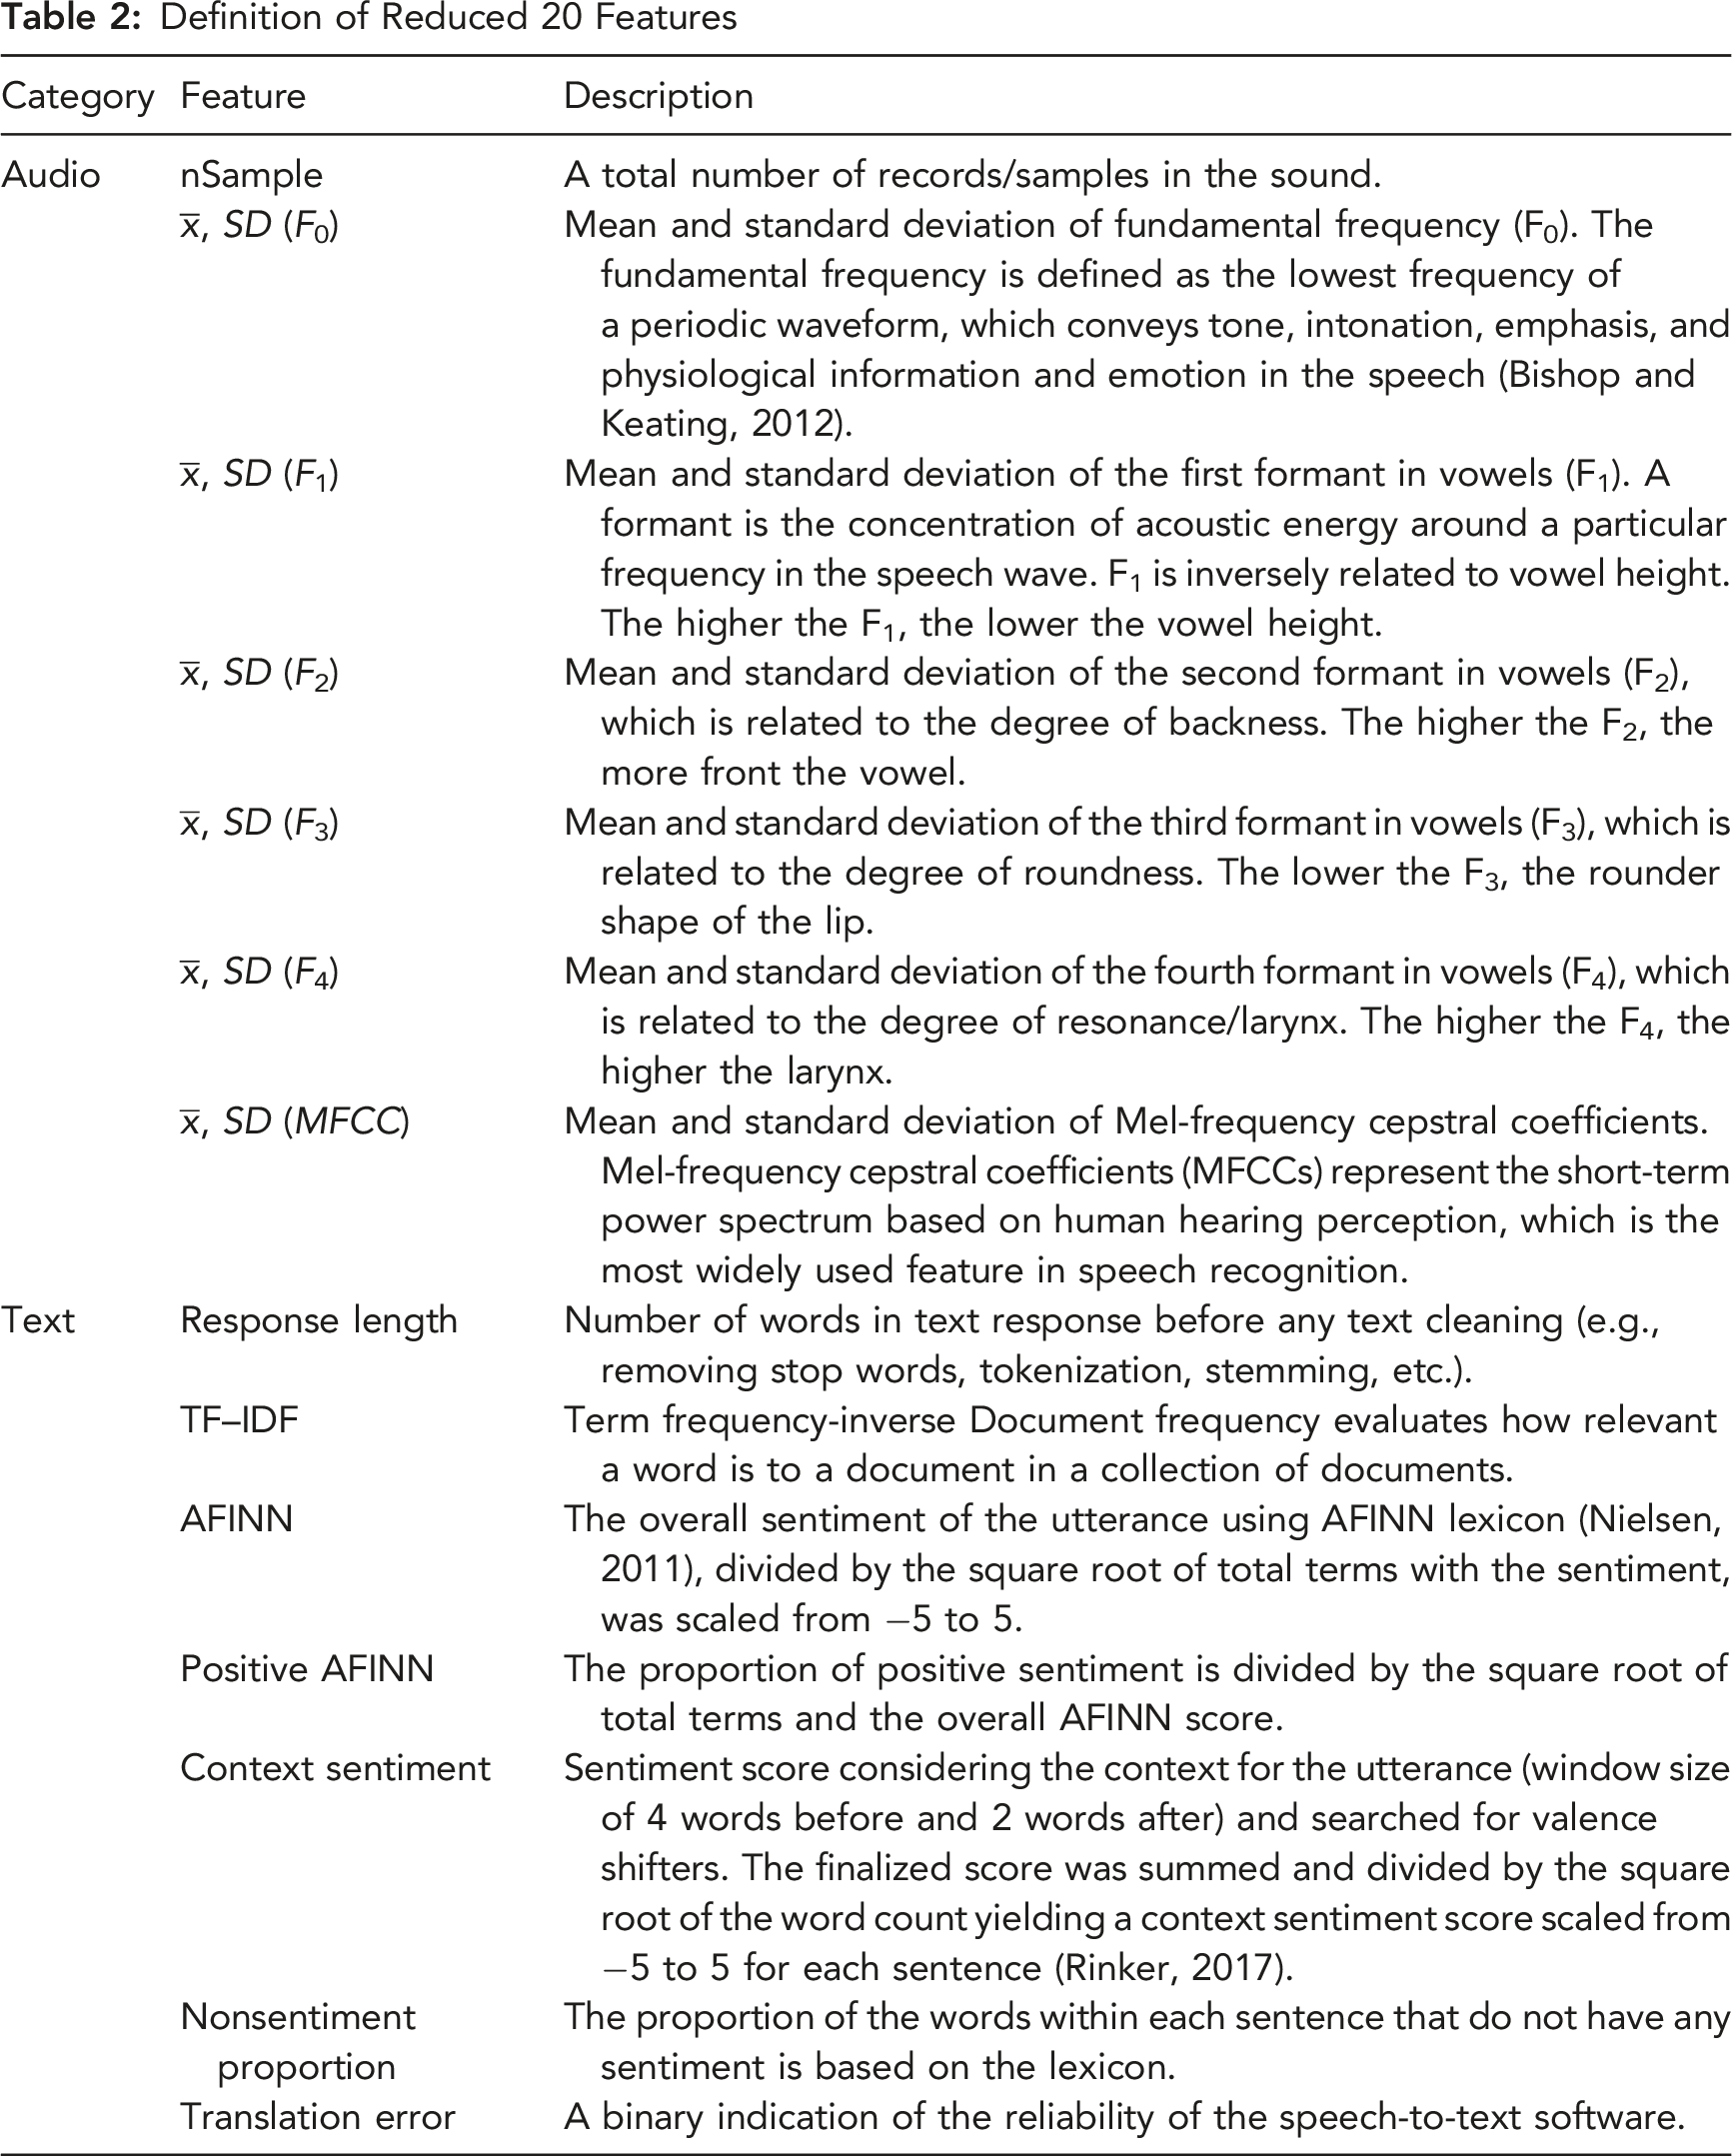
Definition of Reduced 20 Features
A combination of audio and text features was used to predict trust. The two feature sets were merged based on unique audio identifiers associated with each utterance in the study. A z-score standardization was applied to all features and the response variable.
When conducting machine learning, it is important to reduce the number of input features (i.e., noninformative, redundant, or correlated) to improve model performance. First, the Boruta algorithm was used to reduce the feature space based on two-sided z-score tests based on a random forest-based classification algorithm (Kursa and Rudnicki, 2010). This algorithm uses the dataset to identify relevant features, rather than on manual elimination based on domain constructs. Next, multicollinearity (high correlation between two or more predictor variables) was reduced using Variance Inflation Factors (VIF). VIF measures how much the variance of a regression coefficient was inflated due to multicollinearity in the model. We calculated a VIF score for all features and removed any features with a score higher than 10 because scores higher than 10 indicate exceptionally strong multicollinearity (O’Brien, 2007).
Algorithm Training and Evaluation
The algorithms were selected based on three main types of machine learning models (i.e., gradient descent-based, distance-based, and tree-based) as well as stacking ensemble models using caretEnsemble package. The ensemble models specify a higher-order model to learn how to best combine the predictions of sub-models. A total of eight models were evaluated: 1. Linear model. 2. Support Vector Machines with Radial Basis Function Kernel (svmRadial). 3. K-nearest neighbors (kNN). 4. Random Forest (RF). 5. EXtreme Gradient Boosting using tree-based models (XGBTree). 6. EXtreme Gradient Boosting using a generalized linear model (XGBLinear). 7. Linear ensemble model, which fits linear models across all the modes above. 8. Generalized ensemble model, which fits linear models via penalized maximum likelihood.
These eight models were fitted to all three feature sets (i.e., audio, text, and combined). Therefore, a total of 24 models were trained. For each model, we conducted a grouped of 10-fold repeated cross-validation with 3 repetitions. Grouped k-fold cross-validation considers data from the same participant, who may have similar acoustic features or word choices, as a nonoverlapping group so that the same participant does not appear in two different folds. This method can avoid within-subject data leakage by ensuring the same participant not included in the training and test datasets. The predictive performance observed with group k-fold cross-validation estimates performance on another sample of participants from the same population. Therefore, this method penalizes the within-subject similarities and reduces overly optimistic estimates of model performance.
Once the models were trained, we evaluated how well they predicted the response variable, trust, using two metrics: root mean squared error (RMSE) and adjusted R-squared (
Model Explanation
After picking the best performance model, we explained the model by visualizing the most important features for trust prediction. First, a Variable Importance Plot (VIP) was employed. The VIP shows the mean decrease in accuracy associated with removing a feature from the algorithm. However, the value and ranking of important variables in VIP simply represent the importance based on the loss function. The relationships between features and trust remained unknown. We further used, Partial Dependence Plot (PDP), to show the relationship features and the response variable, accounting for the average effect of the other predictors in the model (Greenwell, 2017). The PDP curve shows how much the variable affects the final prediction at specific values of the variable. While PDP provides an average effect of a feature, it does not show specific instances or participants. An Individual conditional expectation (ICE) shows the effect of a feature for individual observations, resulting in one line per observation, compared to one line overall in partial dependence plots. Compared to PDP, which plots the target covariates’ average partial effect on the predicted response, ICE plots each observation reflecting the predicted response as a function of other covariates, conditional on the observed feature. A PDP is the average of the lines of an ICE plot.
Results
The 24 participants can have at least 72 conversational turns with the agent, which leads to at least 1728 conversational segments in total. The audio data contained 1806 segments, with a mean length of 8.17 s (SD = 10.88). For the text data, we only included utterances that included sentiments and excluded answers to question 4 (e.g., I selected procedure 1) since it does not contain meaningful lexical indicators. The text data contained 810 lines of utterances, with the mean text length of 38.25 characters (SD = 26.49). The two datasets were joined by matching the common audio identifiers, leaving the final dataset with 810 lines of utterances. The Welch Two Sample t-test assessed the difference of trust values by reliability condition (mean in group high = 5.78, SD = 0.86; mean in group low = 4.37, SD = 1.44) suggests that the effect is positive, statistically significant, and large (difference = 1.41, 95% CI [1.05, 1.70], t (146.46) = 8.42, p < .001; Cohen’s d = 1.20, 95% CI [0.89, 1.51]).
Feature Engineering
A total of 23 features were extracted, including 13 for audio and 10 for text. The Boruta algorithm identified 23 features as important. The VIF score for multicollinearity identified 3 features above 10, which were removed. The 20 remaining features are described in Table 2.
Trust Estimation
Machine Learning Models Evaluation Using RMSE and Adjusted R2
Model Explanation
Because the random forest model with the combined features shows the best performance, we applied VIP and PDP to investigate the relationships between the features and trust. The VIP, shown in Figure 3, indicates that context sentiment from the text data, the mean of formants, MFCCs, and standard deviation of fundamental frequency were the most important features for predicting trust. Based on the VIP ranking, we used the top 8 features for the following analysis. Variable importance values for the RF algorithm based on the importance, which is calculated by the mean decrease in accuracy associated with removing the feature and scaled by its standard deviation.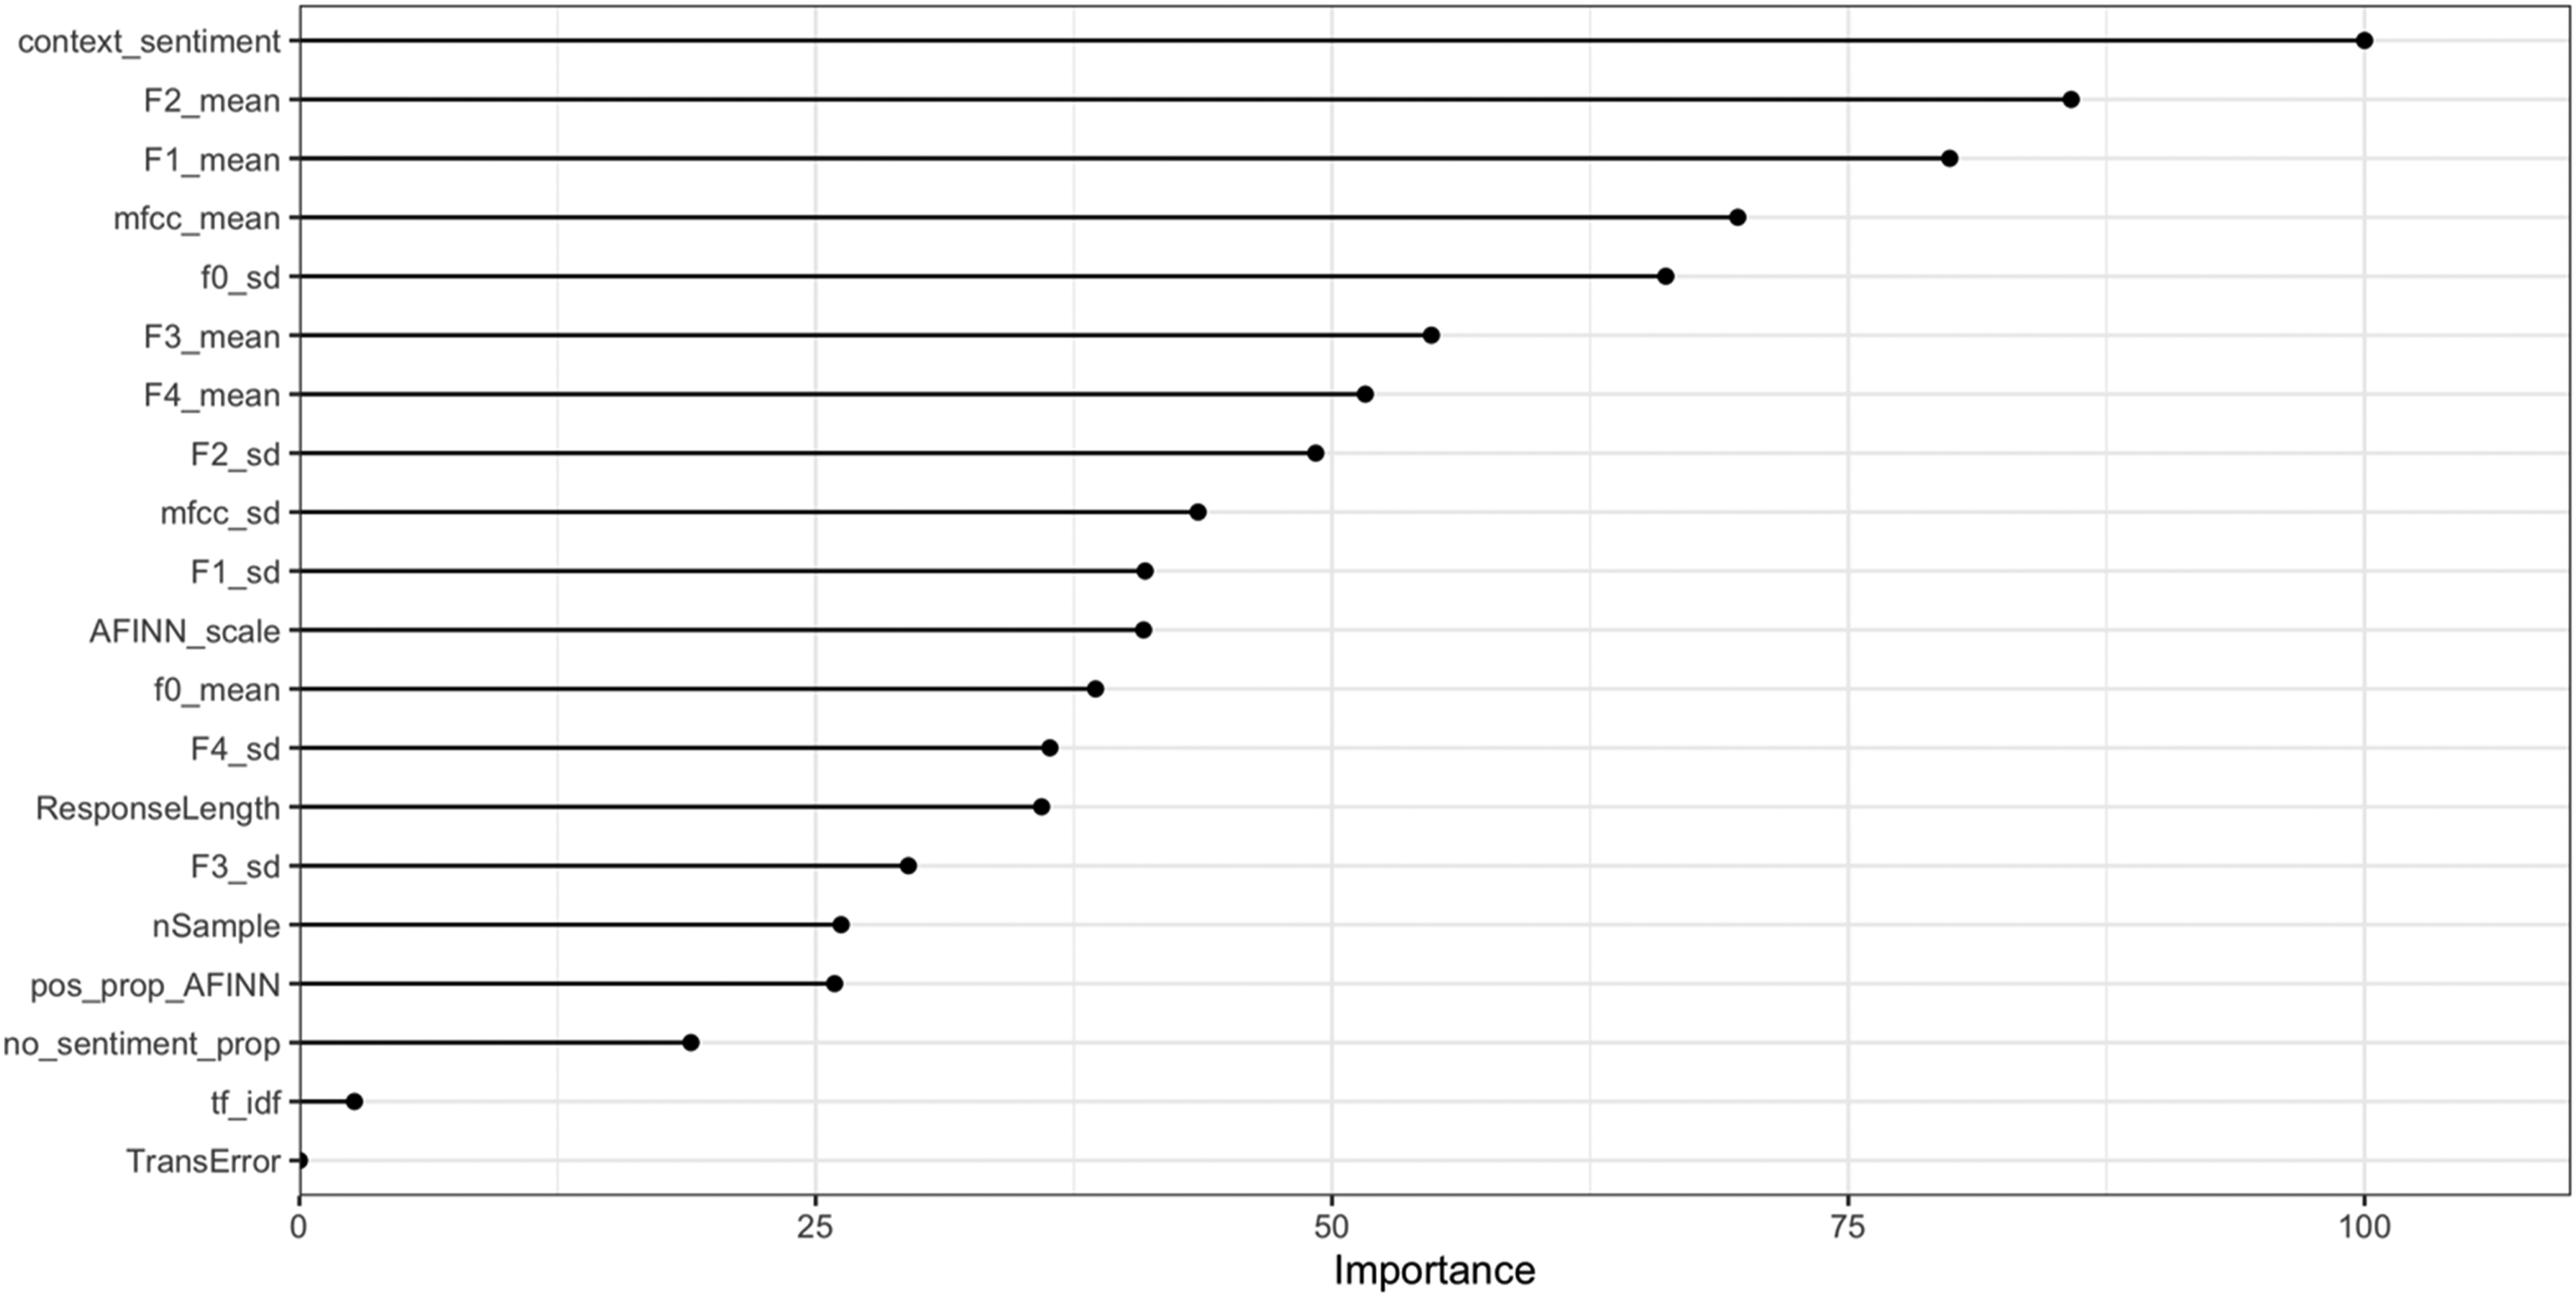
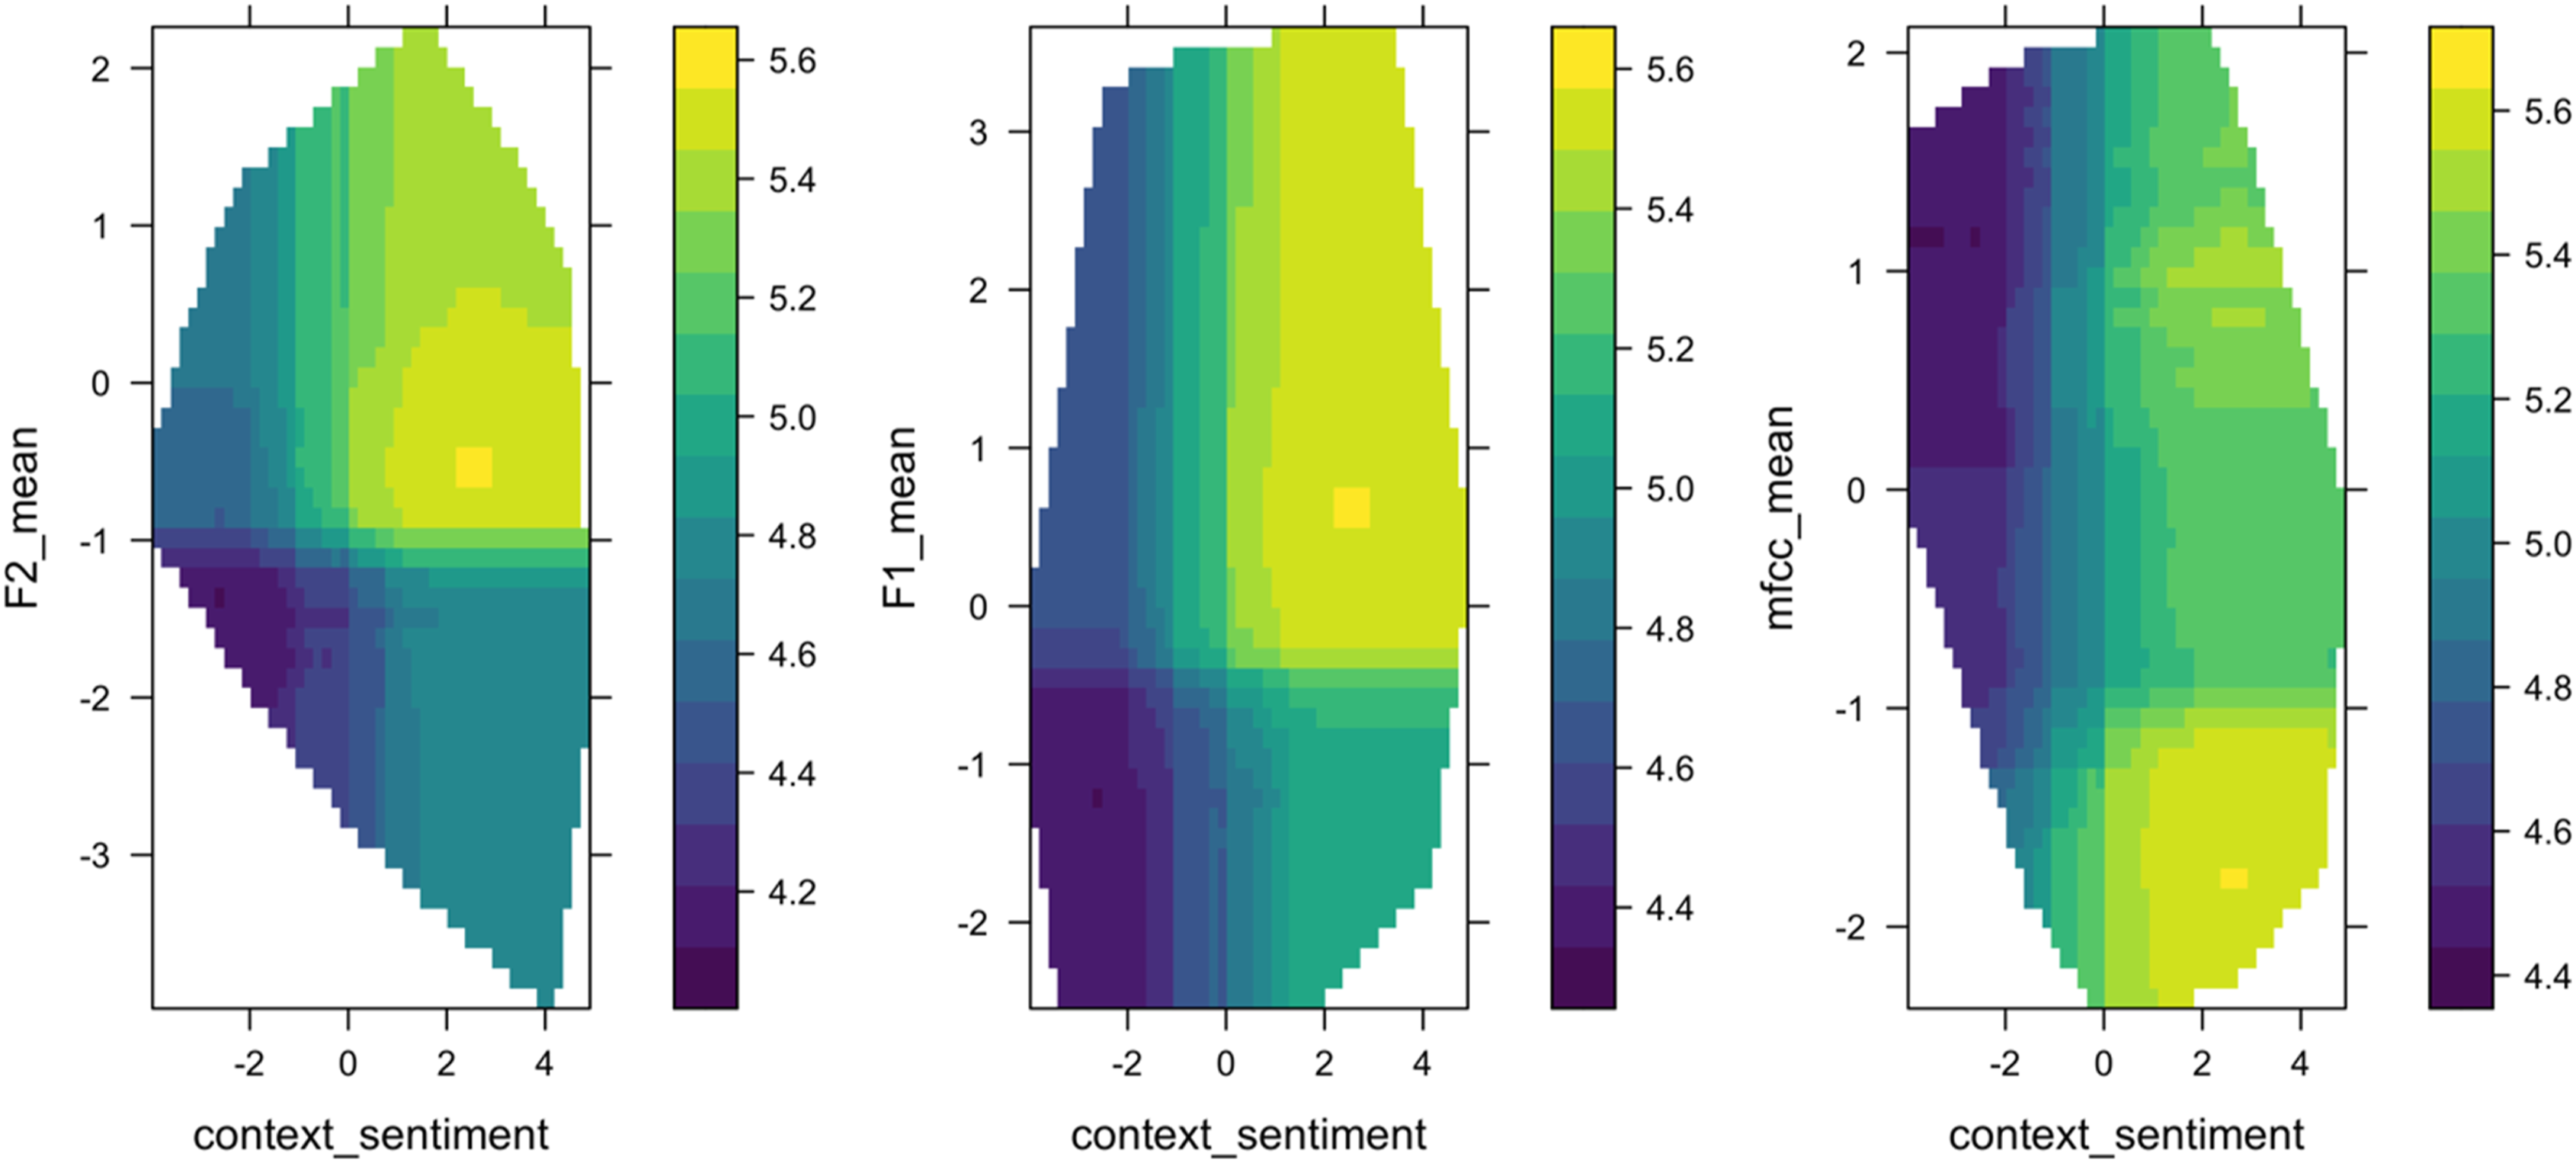
To investigate feature relationships with trust, Figure 4 shows the PDP plots of the top eight most important variables, ordered left to right, top to bottom, by importance. The plot shows the relationships between the response variable (i.e., trust score) on the y-axis and the conversational features (e.g., context sentiment, F2, F1) on the x-axis. Most of the features show a sigmoid-shaped curve, which suggests that the trust transition from low to high follows a nonlinear logistic increase. In other words, a small change in people’s conversational cues in a particular region signals a large change in trust. For each pair of relationships in PDP, positive relationships were observed between trust and sentiment, F1, F2, and F3. The F4 and mean of MFCC revealed an inverse relationship with trust. The standard deviation of the fundamental frequency shows a u-shaped contour. The two-way PDP in Figure 5 shows how trust depends on the joint value of lexical and acoustic features. This allows us to examine the interaction effect of lexical and acoustic features on trust prediction. Take context sentiment and F2 as an example, trust is higher (represented by a lighter shade) when context sentiment in the text and F2 in voice are in a particular range—trust depends on a nonlinear combination of the two features. Partial Dependence Plot (PDP) for the eight most important features based on variable importance plot in Figure 3. The ranges of all features on the x-axis are scaled to 0. The predicted trust on the y-axis is in the range of 1–7. Two-dimensional partial dependency plots for context sentiment, F2, F1, and MFCC mean based on the RF algorithm. The shading represents the predicted trust scores. The outlines of the region show the predictor space that the model was trained on.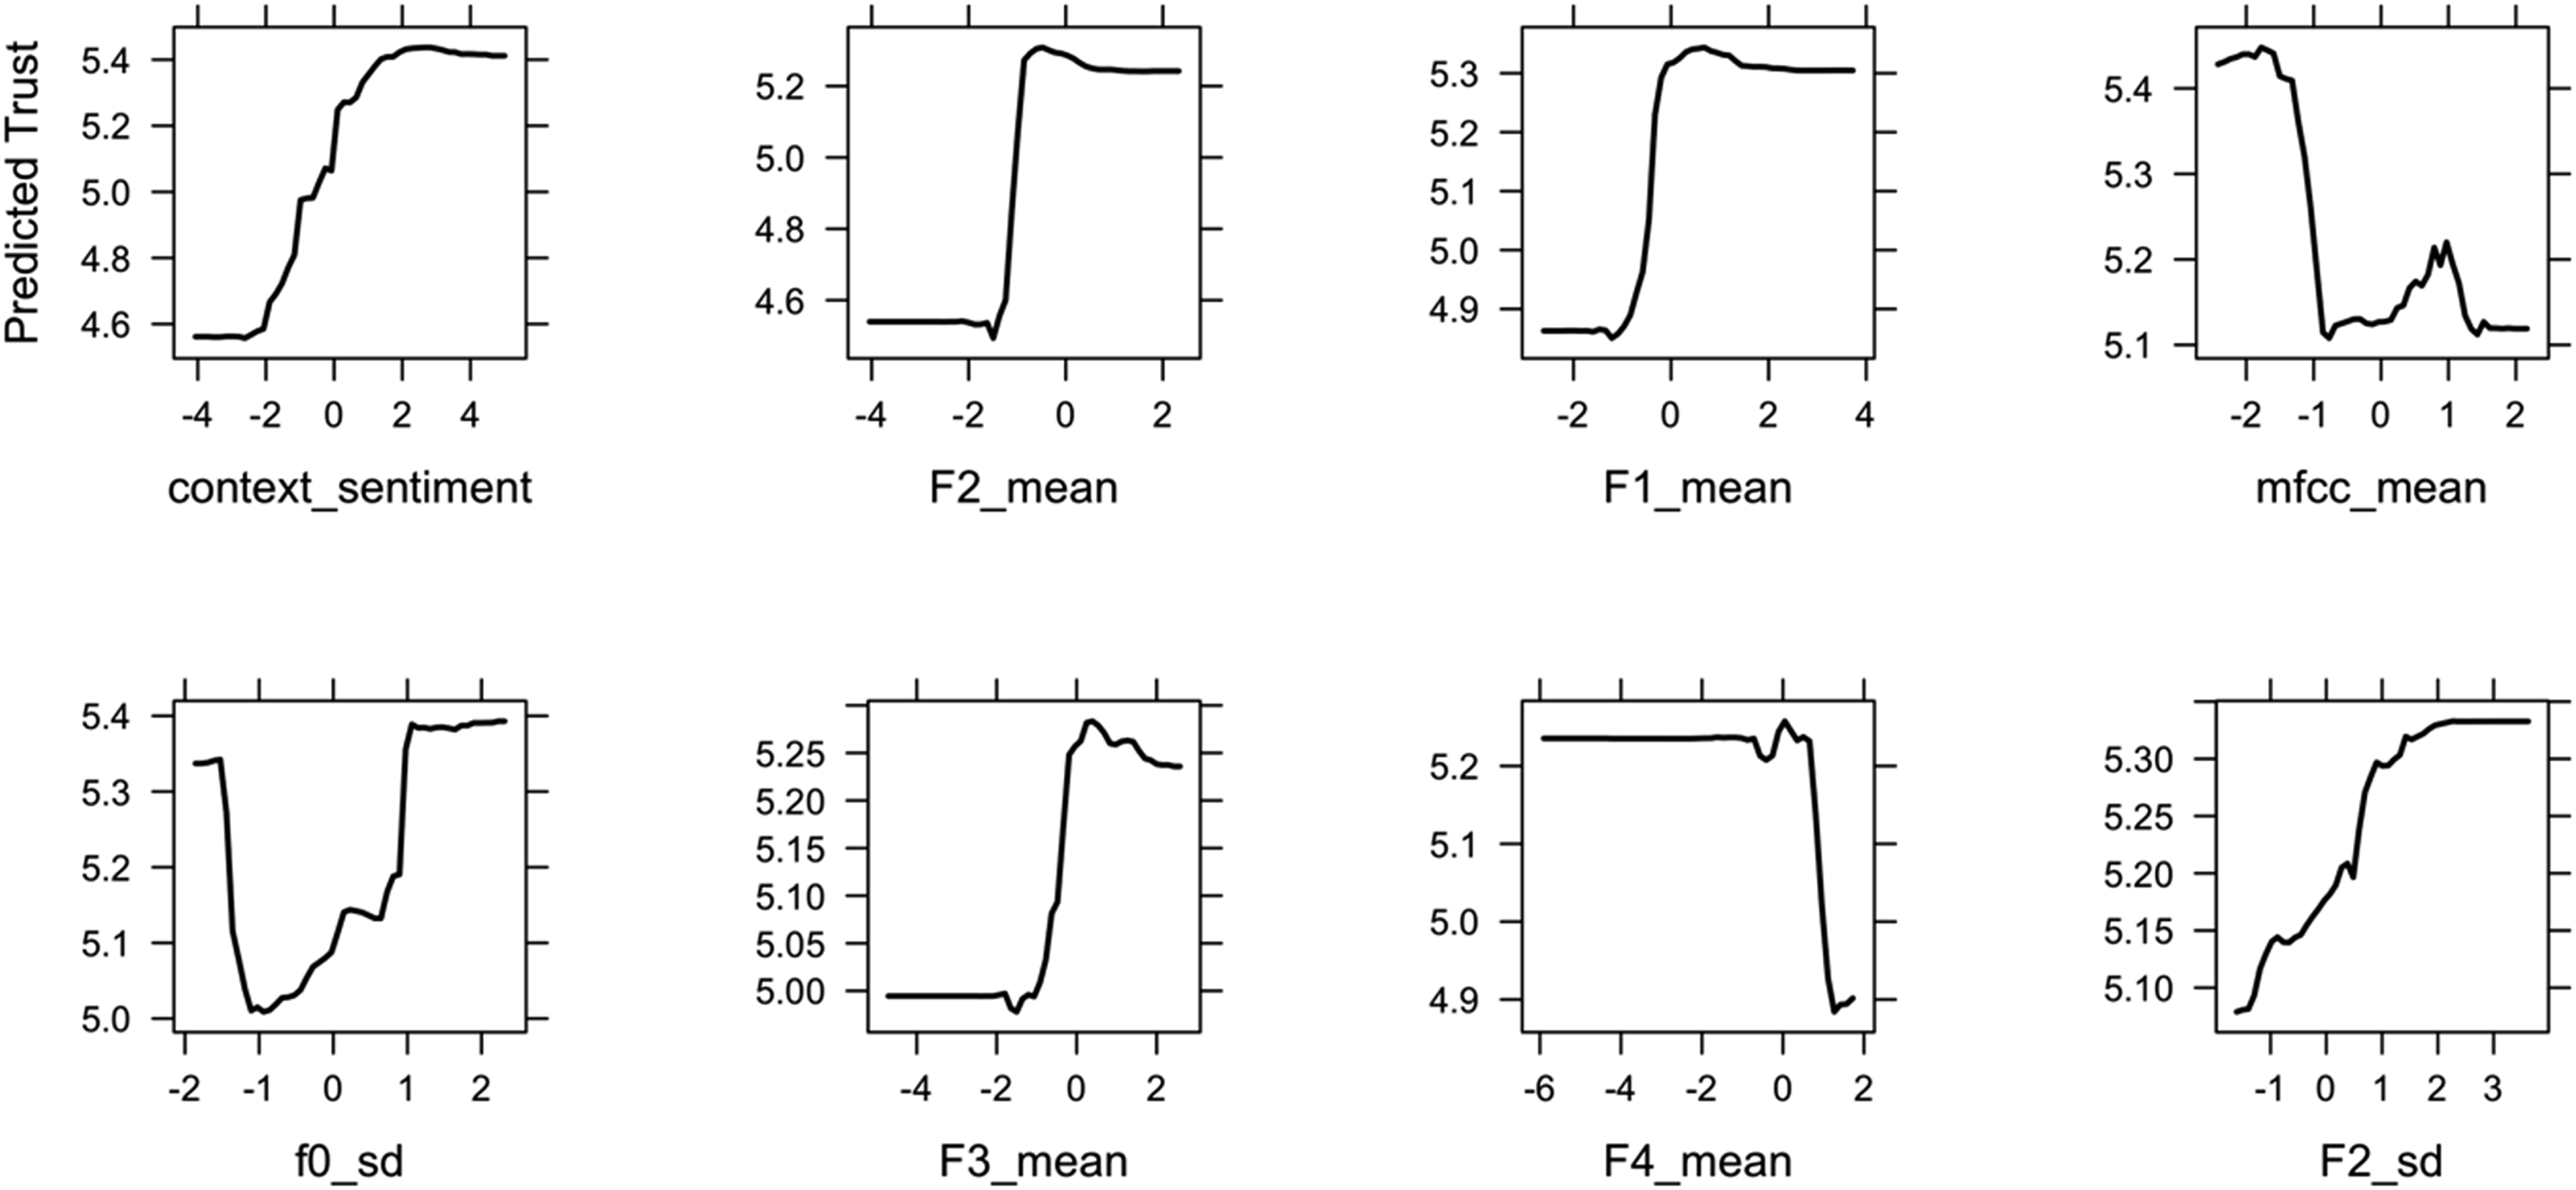
We further identified conversational features as medicators between an exposure (i.e., reliability) and a response variable (i.e., trust). We adopted the multiple mediator analysis method using R package mma (Yu & Li, 2017). Following the mediation analysis criteria (Baron and Kenny, 1986), we identified a partial mediation occurred between reliability on trust via conversational features with a Sobel test for the indirect effect, z = −5.86, p < .001. This suggests that reliability influences how people communicate as an underlying mechanism, which in turn influences people’s trust. The proportion of the effect of the reliability on trust that goes through the medicator is 0.17 (for details, see Supplementary Material).
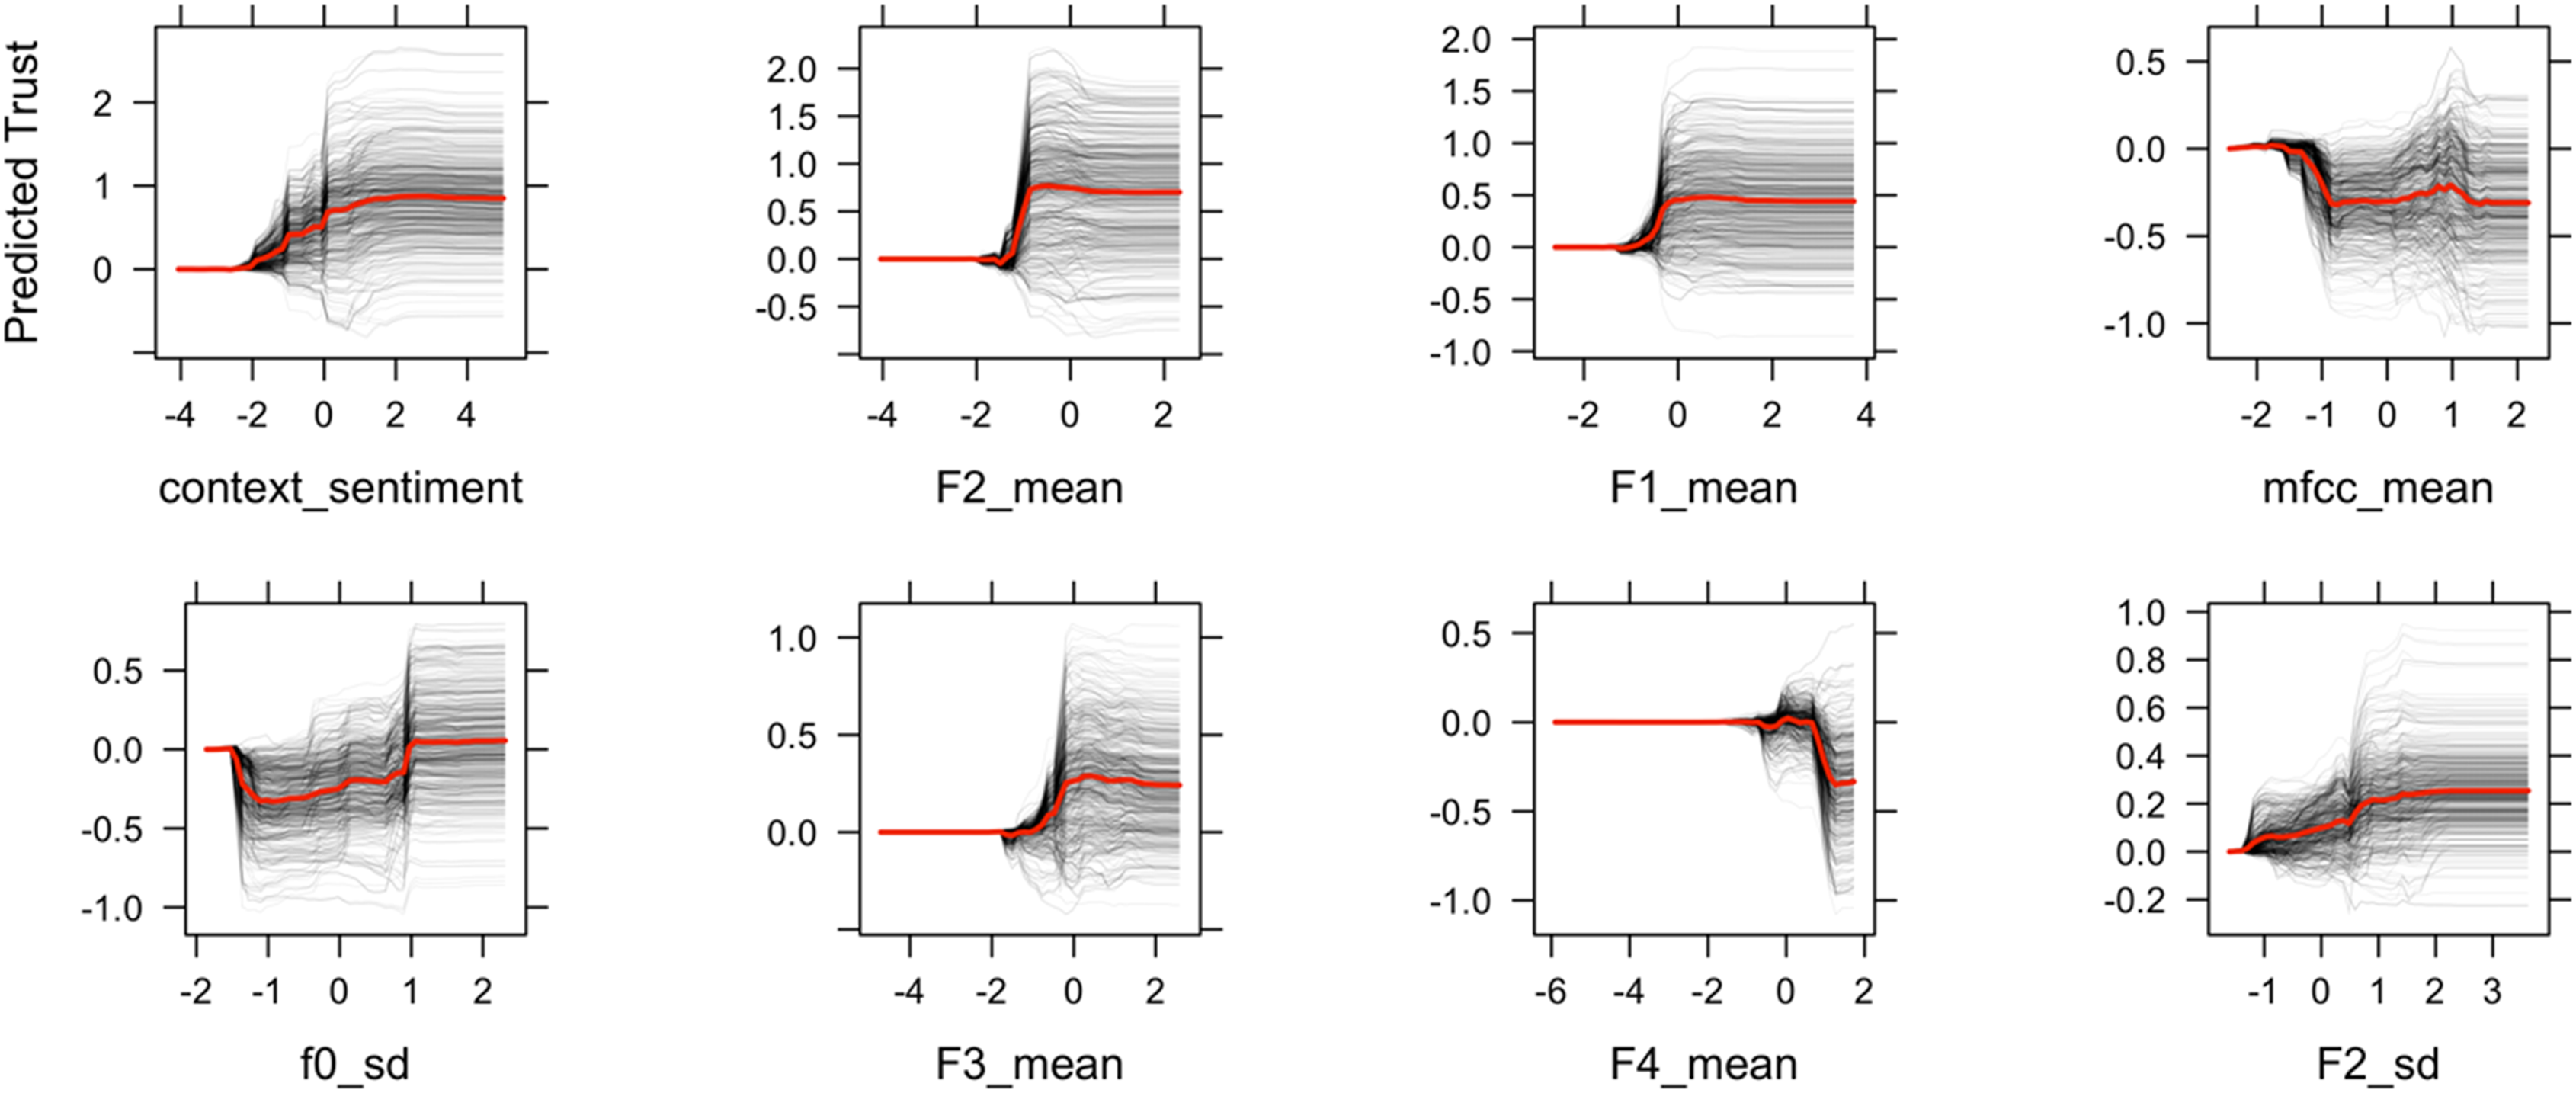
Figure 6 shows the Individual conditional expectation (ICE) plot, which can show how individual cases (i.e., conversational turns) depart from the average behavior. Different cases have different starting predictions in the ICE plot (i.e., high versus low trust), so it is hard to tell whether the curves differ between individuals based on such a wide range. Figure 7 shows the centered ICE, in which centers the curves are fixed to 0 at the minimal value of the trust and shows only the difference in prediction to this point. The centered-ICE curves highlight differences between people and show that the cumulative effects are consistent across participants. For each feature, most instances are similar and follow the shape of curves in PDP, which means changes in the feature has a similar effect across cases. Individual conditional expectation (ICE) plot of predicted trust by the eight most important features. Each line represents one conversational turn. Centered-ICE (c-ICE) plot of predicted trust by top 8 important features. Each line is fixed to 0 at the minimal values of each feature.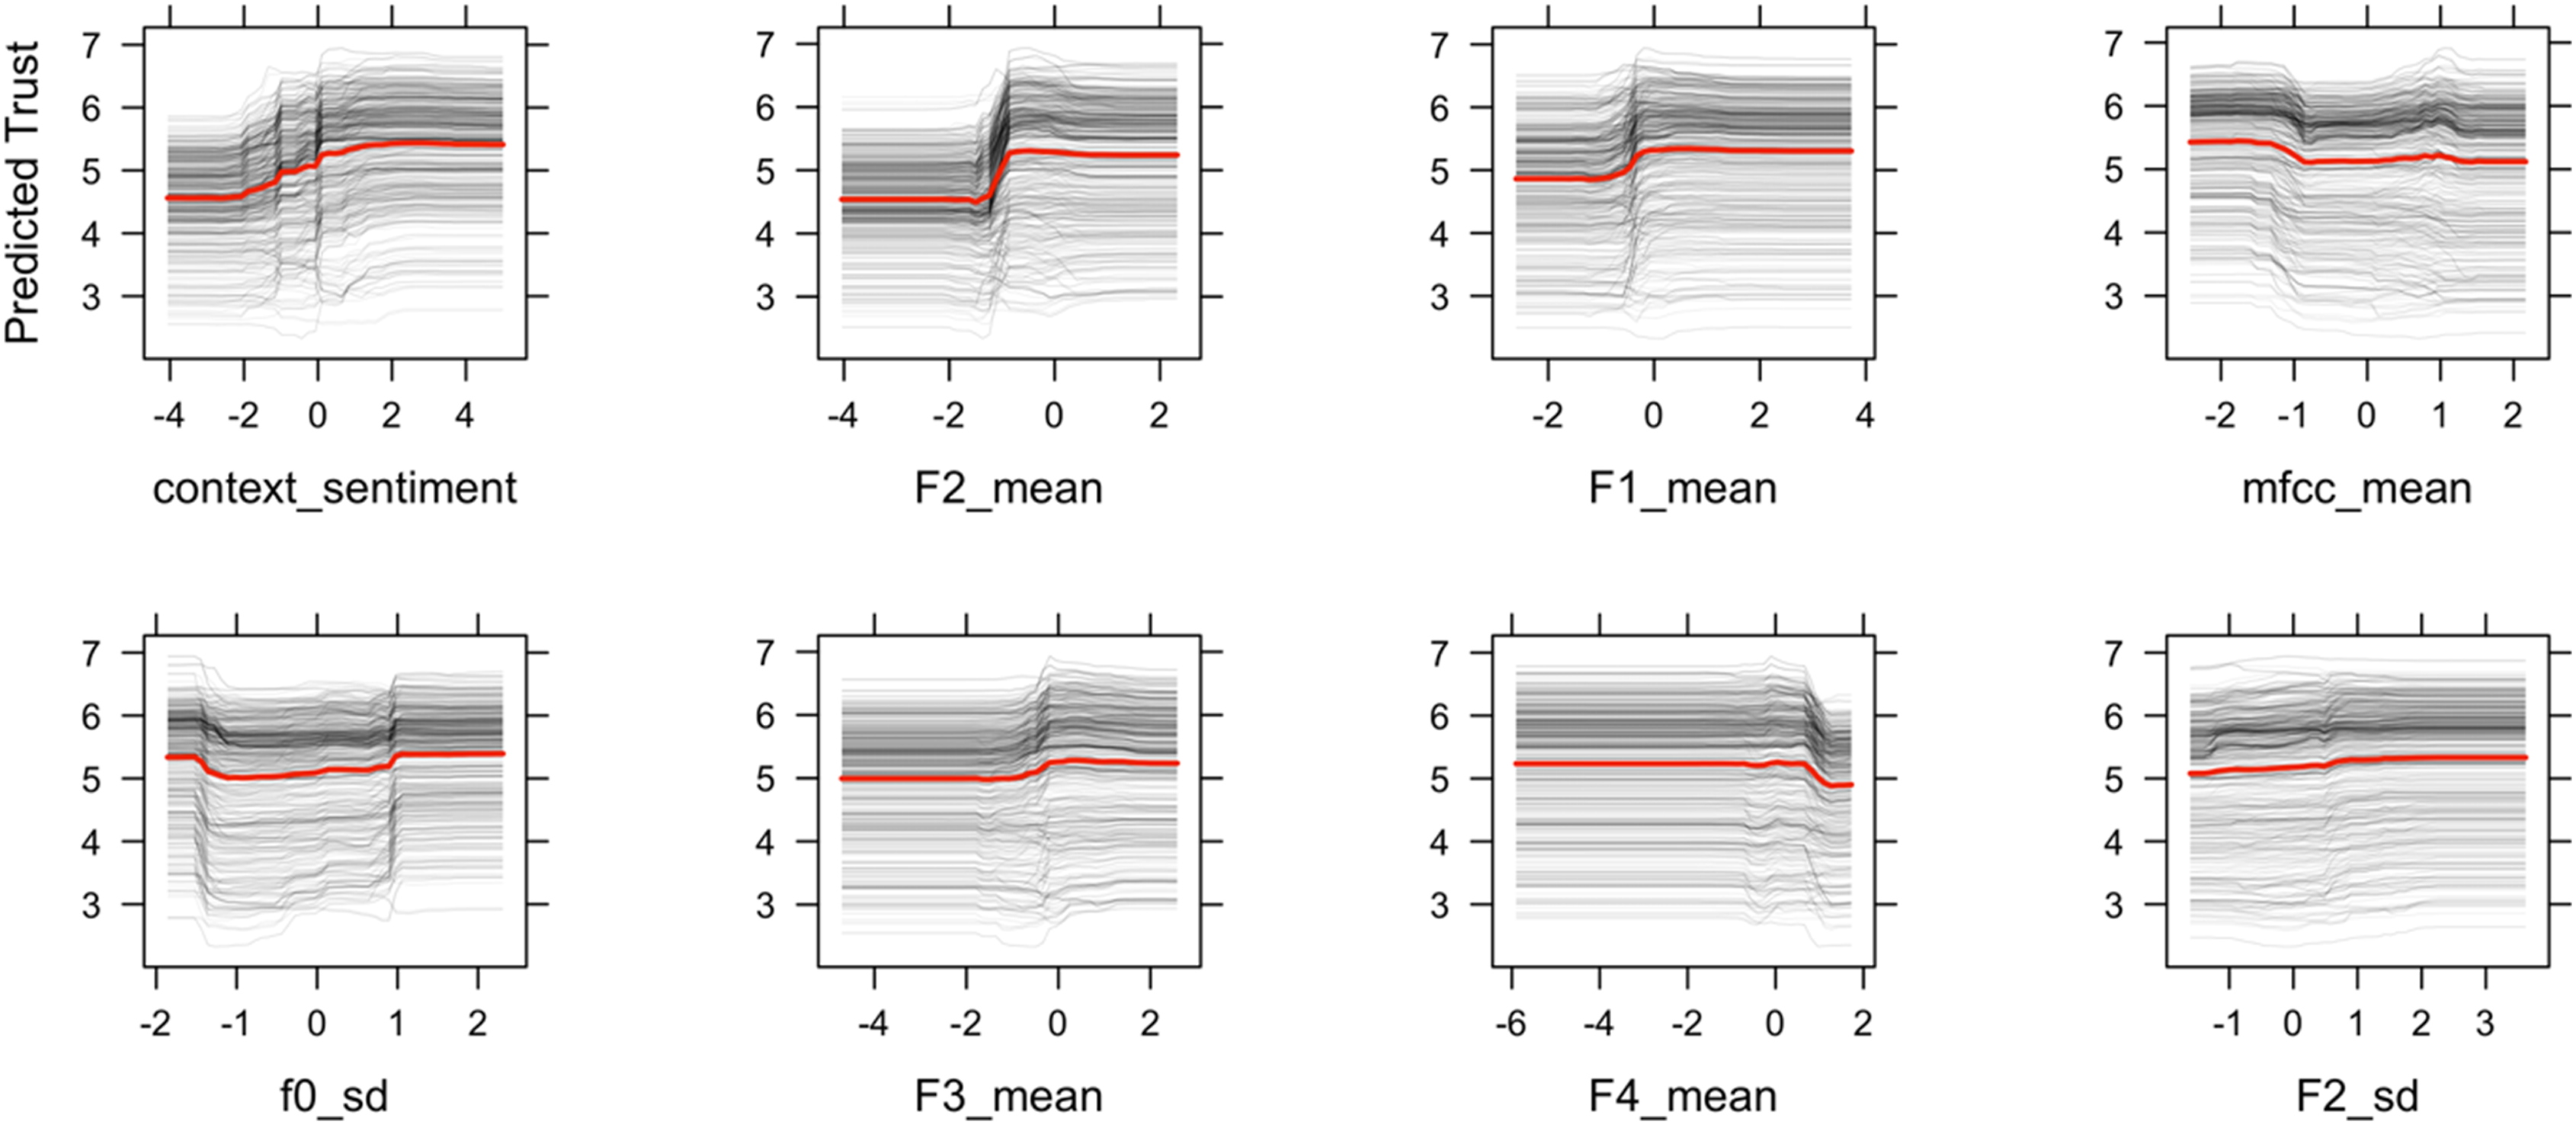
Discussion
This paper addressed two questions: can we measure trust in human-AI conversations? If so, what are the most important conversational indicators for trust measurement and future management? For the first question, we designed an aided decision-making study using the automation reliability as a proxy of trustworthiness to elicit large difference in people’s trust reflected in the human-AI conversations. Results showed that 71% of trust variation can be predicted using a combination of lexical and acoustic features using a random forest algorithm. The large effect size validates as a proof-of-concept that trust can be estimated from the conversations. Compared to prior work on discrete trust classification (Gauder et al., 2021), our work further validated the promising evidence of measuring continuous and real-time trust dynamics in the human-AI conversation. For the second question, we identified the most important trust conversational indicators—context sentiment as lexical cues, formants, fundamental frequency, and MFCC as acoustic cues—and showed that they affect trust in a nonlinear manner: a small change in people’s conversational cues in particular regions can signal a large change in trust.
Lexical Indicators of Trust: Context Sentiment
For the lexical indicator in the conversation, the context sentiment in the conversation is the strongest predictor of trust. Context sentiment is the average sentiment considering valence shifters and negation in the sentence. For example, “I am not good” contains the positive word “good,” but the sentiment score is negative because the sentence contains the negation ‘not’, which flips the polarity of the sentence. Results showed that positive sentiment predicts higher trust. The result is expected and consistent with prior research: when people used more positive words in their conversation, they rated their trust in the aid higher (Hildebrand and Bergner, 2021). Because benevolence is one of the core elements of trust (Mayer et al., 1995), people express greater affective trust and used positive sentiment words when interacting with a conversational agent.
Acoustic Indicators of Trust: Formants, Mel-Frequency Cepstral Coefficients (MFCC), Pitch Variation
For acoustic indicators in the conversations, formants, MFCC, and pitch variation follow context sentiment as the most important predictors of trust. As indicated in Figure 4, a high first formant (F1) and second formant (F2) were associated with a high level of trust. Formant is a spectral property of the speech signal that reflects voice quality as well as linguistic vowel identity (Goudbeek et al., 2009). The formant with the lowest frequency is called F1, the second F2, and the third F3. Prior studies showed that formants can influence people’s trust perception (Knowles and Little, 2016; Torre et al., 2020). Our study demonstrated that formants are also influenced by people’s trust levels. In other words, trust influences people’s speech production and formant articulation.
There are different ways to explain how trust influences formants in conversations. One way is to consider trust as an affective process. Prior research has shown that formants can be used to discriminate the valance (e.g., positive or negative) and arousal (e.g., excited or calm) dimensions of emotions (Kim et al., 2011): high arousal emotions result in a higher mean F1, whereas positive valence results in a higher mean F2 (Goudbeek et al., 2009). Thus, our results implied that when people are in a high level of trust, people express a high F1 and F2 in their voice, indicating trust as a positive valence and high arousal emotion. Another potential explanation is that people use different vowels when articulating different levels of trust. Formants are directly associated with tongue positions and pronunciation of different vowels. The F1 was associated with the height of the tongue position (i.e., top or bottom) and the F2 was associated with the backness of the tongue position (i.e., back or front). A high F1 and high F2 would be lower and front tongue position for words like “bat” (æ) versus a low F1 and low F2 would be “boot” (u). Results showed a high F1 and F2 for higher trust scores, meaning that participants were saying more words that contained vowels in bottom-front vowels (e.g., æ). The third explanation is when trust is higher, people have a “smiling voice” indicated by formants. Past studies have shown that when people smile, the first two formants are increased, which leads to a higher perceived trust (Torre et al., 2020). Future studies should further investigate the causal relationships between formants and trust.
MFCCs are coefficients that collectively make up an MFC, which represents the short-term power spectrum of a sound. MFCC is often used to recognize the emotion of a speaker from their voice. Prior research has shown that the mean and standard deviation of MFCC can classify hot anger, neutral, sadness, and happiness (Bhimavarapu et al., 2021; Lalitha et al., 2015; Nalini et al., 2013). Our result showed consistent findings with prior studies that MFCCs are important features for perceived trust in interpersonal group interactions (Spitzley et al., 2022). Based on the authors’ knowledge, our study is the first to show that MFCCs can be used to predict people’s trust in their conversations with a virtual agent.
In the past literature, trust perception is usually associated with pitch: voices with low F0 are considered more trustworthy than voices with high F0, in both male and female voices (Montano et al., 2017). To our surprise, F0 is not the most important feature to predict how people express their trust levels. Instead, the variance of F0 is considered a more important indicator of trust as shown in Figure 3. Syed and colleagues have demonstrated that a more dynamic and varied pitch contour is viewed as more trustworthy compared to flat intonation (Syed et al., 2021). Knowles and Little also showed that dynamic voices sounded more cooperative than monotone voices (Knowles and Little, 2016). High variation in F0 has been associated with prosocial and pleasant vocal attributes in human child-directed speech (Trainor et al., 2000). Thus, when people express a high-level trust, they also exhibit complex contour of the pitch that may signal affiliation.
Additionally, our study demonstrated that conversational features served as a partial mediator to predict trust. Results supported the causal relationships between conversations, reliability, and trust: automation reliability influenced the way people communicated, which can be used to predict trust. The causality implied that these identified conversational features can be used as conversational affordances of the agent to further manage trust. Future studies can also consider use communication to explain the process of the effects on human-AI team outcomes (O’Neill et al., 2022).
Implications
Measuring trust from conversations is a natural, unobtrusive, novel method to support human-AI teaming. Our findings on predicting trust using lexical and acoustic features provided an initial validation in measuring trust unobtrusively and dynamically in conversation. To date, limited research has been conducted or discussed the development of a standardized conversational measurement of trust. Our study used predefined prompts and conversational structure to elicit people’s trust-relevant responses in a performance-based task. Since conversations are highly context-dependent, future studies are needed to test the ecological validity by generalizing these measures to other contexts. Additionally, how to measure trust in a free-flow conversation remains unsolved. The main bottleneck is the technical limitation of the state-of-art conversational agents, which are usually based on intent detection and predefined conversational flows. With the emerging powerful large language models (e.g., ChatGPT), it can open the door for more complex and open-ended conversations for establishing a standardized conversational measurement of trust.
Once trust can be measured in conversation, an important next step is trust management. For a system to be trustable, it will have to adapt to its user’s trust levels. In performance-based human-AI interactions, we can compare the estimated people’s trust levels with the system capability and identify whether people are over- or undertrusting the system. Based on findings in our study, an adaptive conversational agent can be developed: the conversational agent could incorporate these identified trust indicators to actively probe, repair, and temper trust (Chiou and Lee, 2021). When people overtrust the agent, meaning people’s trust is higher than the actual trustworthiness, the agent can signal the trust tempering conversational cues, such as using the negative sentiment and lower formants. The next question would be whether these identified trust indicators show the same effect on trust perception. In other words, these identified conversational features can predict trustor’s trust, but can they influence perceived trustworthiness of trustee? Our findings show a mixed result from the prior literature: although pitch significantly affected perceived trustworthiness, it is not the most important feature when people express their trust in the conversation. On the other hand, sentiment and formants show that they can be used to both predict trust and influence perceived trustworthiness (Montano et al., 2017). Future studies are needed to show whether the identified conversational indicators are effective to manage people’s trust.
Limitations and Future Work
There are several limitations of this study. First, the conversation is limited in size and scope. Our study focused on the influence of reliability on trust in a performance-based interaction. The word use and other conversational cues in our dataset might not generalize to other trust dimensions (e.g., purpose-dimension trust) or domains of trust (e.g., human-human trust). A generalized protocol of trust-related questions should be developed and validated. Additionally, the acoustic features extracted from conversations can be affectively laden. Future studies should consider using other conversational analysis techniques to extract both analytic and affective processes to understand trust (Li et al., 2023). Second, the conversation design between humans and agents is restricted due to the technical limitations of the chatbot. Although the variation of agents’ responses and questions was designed, the conversational agent in our study is a decision-tree-based agent, rather than an intelligent agent that can hold a rich conversation. Therefore, the conversation complexity and flow were limited. Advances in conversational agents will produce richer data for trust measurement. Third, the extreme manipulation of agent reliability (i.e., 100%, 20%) in our study was designed to elicit trust difference, which can face the low ecological validity. Since prior studies have shown that a reliability below 70% is the “crossover point,” where unreliable automation can be worse than no automation at all (Dixon and Wickens, 2006; Wickens and Dixon, 2007), future studies should further test the differences of conversational indicators of trust with a gradient level of automation reliability (e.g., 70%, 80%).
Conclusion
To enhance the human-AI teaming, AI needs to measure and manage trust in real time. Conversational data provides a novel approach to measure trust unobtrusively. This study showed such real-time, conversational trust measures are possible by training machine learning models on lexical, acoustic, and combined conversational features. A random forest model that used the combination of lexical and acoustic features explained 71% of the variance in self-reported trust. The combination of lexical or acoustic features outperformed either alone. We identified the most important lexical and acoustic cues and further showed that trust transition follows a nonlinear shift. These results showed the importance of including both audio and text features when measuring trust via a conversation. An open question is whether they might be used to modulate the voice of the conversational agent to manage the trust.
Supplemental Material
Supplemental Material - Objective Communication Patterns Associated With Team Member Effectiveness in Real-World Virtual Teams
Supplemental Material for Objective Communication Patterns Associated With Team Member Effectiveness in Real-World Virtual Teams by Mengyao Li, Isabel M Erickson, Ernest V Cross and John D Lee in Human Factors
Footnotes
Acknowledgments
We thank members of the University of Wisconsin-Madison Cognitive Systems Laboratory for their discussions and comments. We also thank anonymous reviewers for providing insightful comments. This work was supported by NASA Human Research Program No.80NSSC19K0654.
Keypoints
• Trust can be estimated using a combination of text and audio data. A machine learning model trained on the combined features outperformed those based on a single modality. • Based on the Variable Importance Plot (VIP), we identified that the most important features to estimate trust were average sentiment considering the valence shifters in text, the mean of formants, and Mel-Frequency Cepstral Coefficients (MFCC) in voice. • Based on the Partial Dependence Plot (PDP) which shows the relationships between trust and conversational features, we identified that a nonlinear shift of trust as features change. • Lexical sentiment and acoustic formant features showed that trust is associated with the positive valence and high arousal emotion. • Conversational features partially mediated the relationship between reliability and trust. The causal relationship suggests that these identified features can be used to manage trust.
Supplemental Material
Supplemental material for this article is available online.
References
Supplementary Material
Please find the following supplemental material available below.
For Open Access articles published under a Creative Commons License, all supplemental material carries the same license as the article it is associated with.
For non-Open Access articles published, all supplemental material carries a non-exclusive license, and permission requests for re-use of supplemental material or any part of supplemental material shall be sent directly to the copyright owner as specified in the copyright notice associated with the article.