
Abstract
As technology advances, the integration of automation into human-machine systems is increasing and humans are more frequently assuming the role of monitor. Unfortunately, humans are poor monitors and struggle to sustain attention. This struggle is often greater for individuals with ADHD. As a result, they tend to exhibit impaired performance on vigilance tasks compared to their counterparts. Prior research has proposed that ADHD is more prevalent in the general population, with many going undiagnosed. The present study conducted several exploratory analyses to determine how differences in ADHD-like symptom manifestation predict vigilance task performance. The results provide evidence for a predictive relationship between impulsive scores and detection accuracy as well as inattention scores and response time on a cognitive vigil. This suggests that various dimensions of attention may influence performance on different measures. Such differences should be considered when assigning monitoring roles to operators.
Humans have historically been active operators of safety critical systems. However, as technology has become more automated, the allocation of functions between man and machine has gradually shifted. One of the domains in which this shift is more easily observed is in transportation. Popular manufacturers have released and advertised automobiles with self-driving capacities like Ford’s Co-Pilot360 and BlueCruise, as well as Tesla’s Autopilot. These features allow drivers to have a more hands-off experience while still requiring them to maintain complete attention to the road. Such technology places the human in the passive role of system monitor instead of the traditionally active role of driver. This new role requires operators to be vigilant to road and vehicle conditions, a capacity that requires the operator to sustain attention.
Sustained attention, a cognitive capacity required of humans in monitoring roles, is the ability to maintain focus on relevant stimuli for extended periods of time (Szalma et al., 2004; Warm, 1984). Because of its importance in safety domains, researchers have endeavored to better understand this type of attention. One method often used to study sustained attention is the vigilance task. This task requires participants to monitor displays for critical, yet rare, signals designed to simulate the real-world task of monitoring (see Davies & Parasuraman, 1982; Mackworth, 1948). Unfortunately, vigilance research has consistently found humans to be poor monitors, often failing to sustain attention (Mackworth, 1950; Nuechterlein et al., 1983).
Research assessing those diagnosed with Attention Deficit/Hyperactivity Disorder (ADHD) have found even greater monitoring impairment in this demographic (see Rapport et al., 1999; Vile Junod et al., 2006). Individuals with ADHD exhibit symptoms of inattention and impulsivity/hyperactivity through behaviors such as an inability to remain seated and/or remain on task (American Psychiatric Association, 2013). Additionally, research suggests that such behavior may be due to a deficit in the capacity to sustain attention (Fischer et al., 1990; Lam & Beale 1991; Spira & Fischel, 2005). As a result, they often exhibit impaired performance on vigilance tasks compared to their counterparts (Tucha et al., 2009). A previous study conducted by the authors found that participants with ADHD had longer response times (RT) and lower levels of accuracy compared to participants that did not report having a diagnosis. This study however, only compared participants with a formal diagnosis to those without.
Researchers have proposed that ADHD is more prevalent in the general population than we think, with many individuals going undiagnosed (Adler et al., 2006, 2019; Ginsberg et al., 2014). This assertion is supported by statistics showing that there exists a large group of people who do not receive psychological treatment. Research conducted by the National Center of Health Statistics of the CDC showed that only 19.2% of Americans had received mental health therapy in 2021 (Terlizzi & Schiller, 2022). This disparity is greater when comparing the percentages of different demographics. White adults are more likely to receive treatment than other ethnic groups, and women are more likely to seek treatment than men. Some reasons for this could be stigma associated with mental health services, cultural and language barriers, or economic challenges (Martinez et al., 2016). Regardless of the cause, the data indicate that there may be many neurodivergent individuals who are unaware of their conditions and how to combat the symptoms. Therefore, it is important to study how this individual difference might affect vigilance performance in a way that considers the possibility that some individuals who report not having ADHD may well be part of the population that has yet to be diagnosed. In order to address this issue, the present study sought to determine how differences in ADHD-like symptom manifestation predict vigilance task performance, in terms of both accuracy and RT.
To assess this, participants completed the Adult ADHD Self-Report Scale (ASRS v1.1) (Kessler et al., 2005) followed by a cognitive vigil. The ASRS is a validated scale used by healthcare professionals for screening and therefore aids in diagnosing patients with ADHD. The questions included in this scale are consistent with DSM criteria and are predictive of symptoms exhibited by those with ADHD (Kessler et al., 2005). The scale consists of 18 items and has two subscales designed to measure different aspects of the disability: inattention and impulsiveness. It is important to note that the ASRS is a screening tool, not a diagnostic one. It does not measure ADHD symptoms; instead, it measures functional impairments experienced by those with ADHD. Therefore, an analysis of the predictive relationship between ASRS scores and task performance will provide insight into the effects of common attentional impairments (i.e., inattention and impulsivity) on sustained attention.
The vigilance research assessing this is sparce, with few studies attempting to predict performance in this way. One previous study assessed the relationship between ADHD symptoms in a non-clinical population and performance on a vigilance task using the ASRS (Helton et al., 2011). However, performance was only measured in terms of accuracy (i.e., correct detections and false alarms) and not RT. Further, the false alarm rate in the study was low and therefore excluded from analyses. Another study utilizing a different scale, the Young ADHD Questionnaire-Self Report scale (YAQ-S), did not find a strong relationship between ADHD symptoms and task performance (Shaw et al., 2010). The current study aims to shed more light on the relationship between ADHD symptomology and vigilance task performance.
Methods
Sample Data
The data used in these analyses are from a previous between-subjects experiment with three conditions. In this study, participants were exposed to different types of gamified feedback depending on condition. There was one control condition and two experimental conditions. The feedback, only provided in the experimental conditions, was presented during the interstimulus interval (ISI). All conditions were identical in all aspects apart from the information displayed in the ISI. To investigate the relationship between ASRS scores and performance, participant data were collapsed across conditions and subsequently analyzed.
Participants
Participants were recruited from a research participation system within a large university in the southeastern United States. Participants were compensated with course credit.
Materials
Questionnaires
Prior to the task, participants were administered a questionnaire containing demographic questions, the ASRS, and a question regarding ADHD diagnosis (i.e., “Have you ever been diagnosed with ADHD?”). This question was included to further validate the ASRS. Those with scores of 4 or greater on part A (the first six items) of the questionnaire are considered to have symptoms consistent with those exhibited by adults with ADHD (Adler et al., 2019; Waite et al., 2022). Therefore, ASRS scores were compared between those who responded “Yes” and those who responded “No” to the question of ADHD diagnosis.
The Vigilance Task
Each participant completed a cognitive vigilance task. The task consisted of the successive presentation of single digit numbers from 0 to 9, with the critical signal being 0. Participants were instructed to press the spacebar any time the number 0 appeared on the screen and withhold response for all other numbers. Each trial included the presentation of a single digit for 1,500 ms, followed by an inter-stimulus interval of 500 ms. The even rate was set to 30 events per minute, a high event rate according to Parasuraman (1979), and the signal probability was 0.066. The vigil lasted a total of 20 consecutive minutes with no breaks for all participants. Responding via spacebar did not advance the display. The vigil was divided into 4 blocks of 5 minutes, in post, to analyze performance across time. The 20-minute task was preceded by a 30 seconds practice session with the same event rate and signal probability. For the purpose of training, this practice vigil provided participants with accuracy feedback for each response. For each hit and correct rejection, they were presented with the phrase “Correct.” For each miss and false alarm, they were presented with the phrase “Wrong” (see Figure 1).

Practice vigil performance feedback.
Procedure
This study was administered remotely and accessed via a Qualtrics link. Upon clicking the link, participants provided informed consent and were directed to the pre-task questionnaire. Following the questionnaire, they received instructions explaining how to properly complete the task. They then completed the practice vigil. Once the practice vigil was complete and prior to beginning the 20-minute vigil, they were reminded of the task instructions and were told to respond as quickly and accurately as possible.
Results
Demographics
The data were collected from a total of 66 participants. The sample was predominantly female (54.5%) and White (57.6%) with an average age of 19.4 years (SD = 2.95 years).
Psychometrics
On average, participants scored 4.63 (SD = 2.34) on the inattentive subscale, 5.38 (SD = 1.60) on the impulsive subscale, and 3.87 (SD = 1.75) on part A. Subscale scores were mean centered to aid in the interpretation of interaction terms and reduce issues with multicollinearity.
The inattentive and impulsive subscales were centered around the sample means, while part A scores were centered around 4, the threshold for ADHD symptomology.
Nine participants reported having been diagnosed with ADHD. These participants’ mean ASRS part A scores were significantly higher (M = 5.67, SD = 1.00; t(16.03) = −5.27, p < .001) than their counterparts’ (M = 3.56, SD = 1.66), further supporting the construct validity of the ASRS. Scores on the ASRS subscales were analyzed independent of whether participants had a formal ADHD diagnosis.
Performance
Performance data were analyzed using Linear Mixed Modeling (LMM) with the “lme4” package in R (Bates et al., 2015; R Core Team, 2022).
The LMM was fitted to predict performance across trial blocks, with ASRS part A, inattention, and impulsive subscales as predictors. Performance accuracy was measured by the proportion of hits and false alarms per trial block. Median response time in milliseconds was used to measure the timeliness of responses. Nonparametric Signal Detection Theory (SDT) measures of sensitivity (A’) and bias (
Response Time
The model fitted to predict response time showed a significant decrement in performance across trial blocks (B = 52.75, 95% CI [39.01, 66.50], t(219) = 7.56, p < .001; β = .31, 95% CI [0.24, 0.39]) as well as a significant interaction between trial block and inattention score (B = 19.95, 95% CI [8.35, 31.55], t(219) = 3.39, p < .001; β = .27, 95% CI [0.11, 0.42]), with participants scoring higher in inattention than the sample mean showing a greater decrement across time than those who scored lower (see Figure 2). All other predictors and interaction terms did not reach significance (p > .05). The model’s total explanatory power is substantial (conditional R2 = .67), and the variance explained by the fixed effects alone is (the marginal R2) is .18.
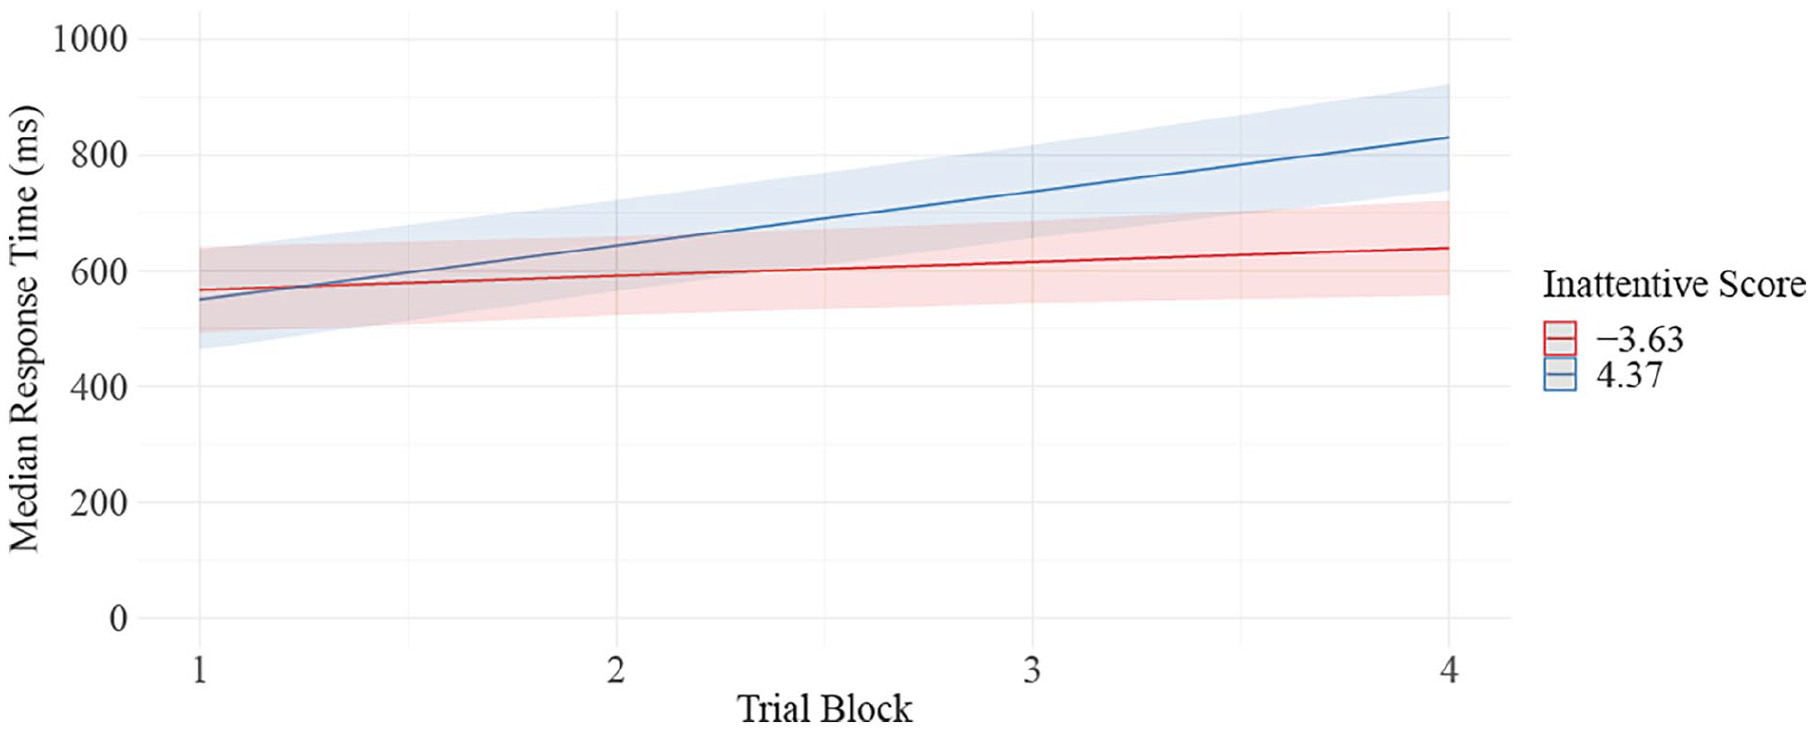
Predicted values of RT by ASRS inattentive score.
Accuracy
Analysis of the proportion of hits showed a significant decline across trial blocks (B = −.08, 95% CI [−0.11, −0.06], t(231) = −6.61, p < .001; β = −0.31, 95% CI [−0.41, −0.22]). All other predictors and interaction terms were nonsignificant (p > .05). The model’s total explanatory power is substantial (R2 = .51). The variance explained by the fixed effects alone is an R2 of .12.
The model for proportion of false alarms did not show a significant change in performance over time (p = .60). Scores on the impulsive subscale were significant predictors of performance (B = .00187, 95% CI [5.72e-05, 3.67e-03], t(231) = 2.03, p = .043; β = .18, 95% CI [.003, 0.36]), such that each 1 unit increase in impulsive subscale score predicted an increase in false alarms by .26. This translates to every 4 unit increase in impulsivity leading to an increase in number of false alarms by approximately 1. All other predictors and interaction terms were nonsignificant (p > .05). However, the model's total explanatory power is weak (R2 = .11), and the variance explained by the fixed effects alone is an R2 of .05.
Sensitivity and Bias
The model run on sensitivity showed a significant decline in sensitivity with time on task (B = −.00785, 95% CI [−0.01, −.00392], t(218) = −3.94, p < .001; β = −.21, 95% CI [−0.31, −0.11]) and the model fitted to predict bias showed a significant increase in bias across time (B = .12, 95% CI [0.06, 0.18], t(230) = 3.69, p < .001; β = .21, 95% CI [0.10, 0.32]). No other predictors or interactions were significant (p > .05). The sensitivity model had a conditional R2 = .10 and a marginal R2 = .46. The bias model had a conditional R2 = .07 and a marginal R2 = .29.
It is important to consider research suggesting that SDT measures of sensitivity are not well-suited for cases in which false alarm rates are low, as is observed in the present sample. It is argued that in these cases, changes in sensitivity may simply reflect changes in response bias (Thomson et al., 2016). As seen from the LMM for false alarms, the number of false alarms did not increase with time on task while the number of hits did significantly decrease. These findings appear to suggest that participants grew more conservative with time on task and that changes in sensitivity merely reflect that.
Discussion
The present work sought to determine whether performance on a vigilance task could be predicted by ASRS scores. The performance data show patterns consistent with the decrement often observed in the vigilance literature. Participants exhibited a significant decrement in both response time and accuracy across trial blocks.
Scores on the ASRS impulsive subscales were predictive of false alarm rate, with participants higher in impulsivity committing more false alarms. An interaction effect between inattention scores and trial block on response time was also found. Participants scoring higher in inattention exhibited a greater increase in response time as time progressed. It is possible that this disparity might be more pronounced in the latter portion of longer vigilance tasks. Contrary to what was expected, scores on part A of the ASRS, the subscale considered to be consistent with ADHD in adults, did not predict performance in terms of response time nor accuracy. These differences in attention and their effects on performance should be considered when assigning monitoring roles to operators. Individuals high in inattention and impulsiveness will likely benefit from interventions designed to mitigate the effects of these tendencies.
Conclusion
The results of this study provide evidence of a predictive relationship between scores on ASRS subscales and performance on a vigilance task. These findings suggest that the decrement in performance exhibited by participants may be due to attention deficits rather than a decline in sensitivity. This provides support for the Hancock and Warm (1989) model of stress and attention. This model argues that extreme levels of stress negatively impact the allocation of attentional resources, resources that are required for success on a vigil.
Footnotes
Acknowledgements
We would like to extend our gratitude to Dr. Nelson Roque for his contribution to the development of the task and subsequent statistical analyses.
Declaration of Conflicting Interests
The author(s) declared no potential conflicts of interest with respect to the research, authorship, and/or publication of this article.
Funding
The author(s) received no financial support for the research, authorship, and/or publication of this article.