
Abstract
Understanding the impact of operator characteristics on human-automation interaction (HAI) is crucial as automation becomes pervasive. Despite extensive HAI research, the association between operator characteristics and their dependence on automation has not been thoroughly examined. This study, therefore, examines how individual characteristics affect operator dependence behaviors when interacting with automation. Through a controlled experiment involving 52 participants in a dual-task scenario, we find that operators’ decision-making style, risk propensity, and agreeableness are associated with their dependence behaviors when using automation. This research illuminates the role of personal characteristics in HAI, facilitating personalized team interactions, trust building, and enhanced performance in automated settings.
Keywords
Introduction
As automation becomes further integrated into daily life, it is essential to understand how individual characteristics affect the interaction and outcomes. The issue of automation over- and under-use has been a central concern among researchers, beginning with the seminal work by Parasuraman and Riley (1997). Since then, considerable research has been undertaken. However, there has been a lack of focus on the impact of individual characteristics, despite its importance to the rapid deployment of automation (Chung & Yang, 2024; Robert et al., 2020). A research gap exists concerning the intricate relationships between an operator’s individual characteristics and their interaction strategy with and dependence behaviors on automation.
In this paper, we seek to answer the question: How do operators’ individual characteristics influence their dependence behaviors when using automation? We conducted a controlled laboratory experiment involving 52 participants in a dual-task scenario. This experiment investigated the interplay between individual characteristics and operator behaviors. It directly contributes to understanding the role of underlying factors of humans in HAI and can be applied to personalize team interactions, foster appropriate trust, and enhance overall task performance.
Methods
This study complied with the American Psychological Association code of ethics and was approved by the University of Michigan’s Institutional Review Board.
Participants
A total of 52 (27 males, 24 females, and 1 person who did not disclose gender information) university students (mean age = 23.3 years old, SD = 4.04) with normal or corrected to normal vision participated in the experiment. Upon completion of the experiment, the participant received US $20 with an opportunity to earn a performance bonus ranging from $1 to $2.50 (Figure 1).
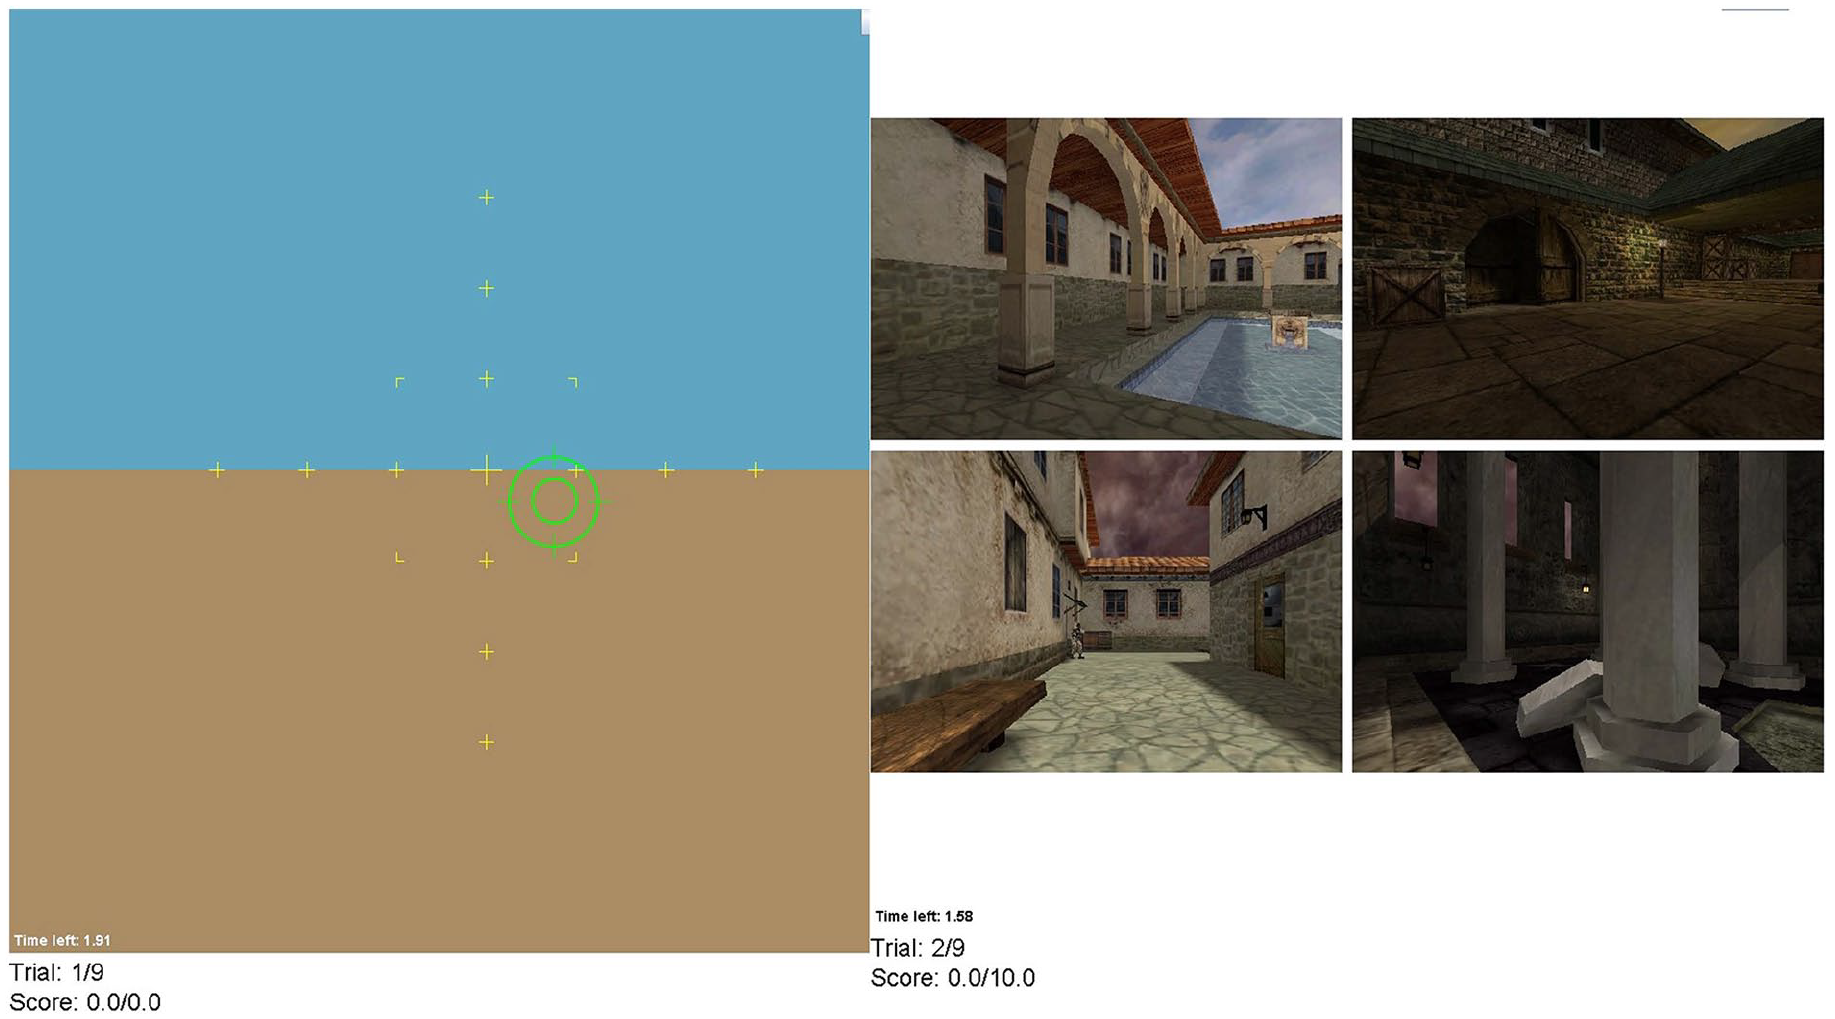
The dual-task testbed displays the tracking task on the left and the threat detection task on the right. Only one screen is visible at a time.
Apparatus and Stimuli
Pre-Experiment Questionnaire
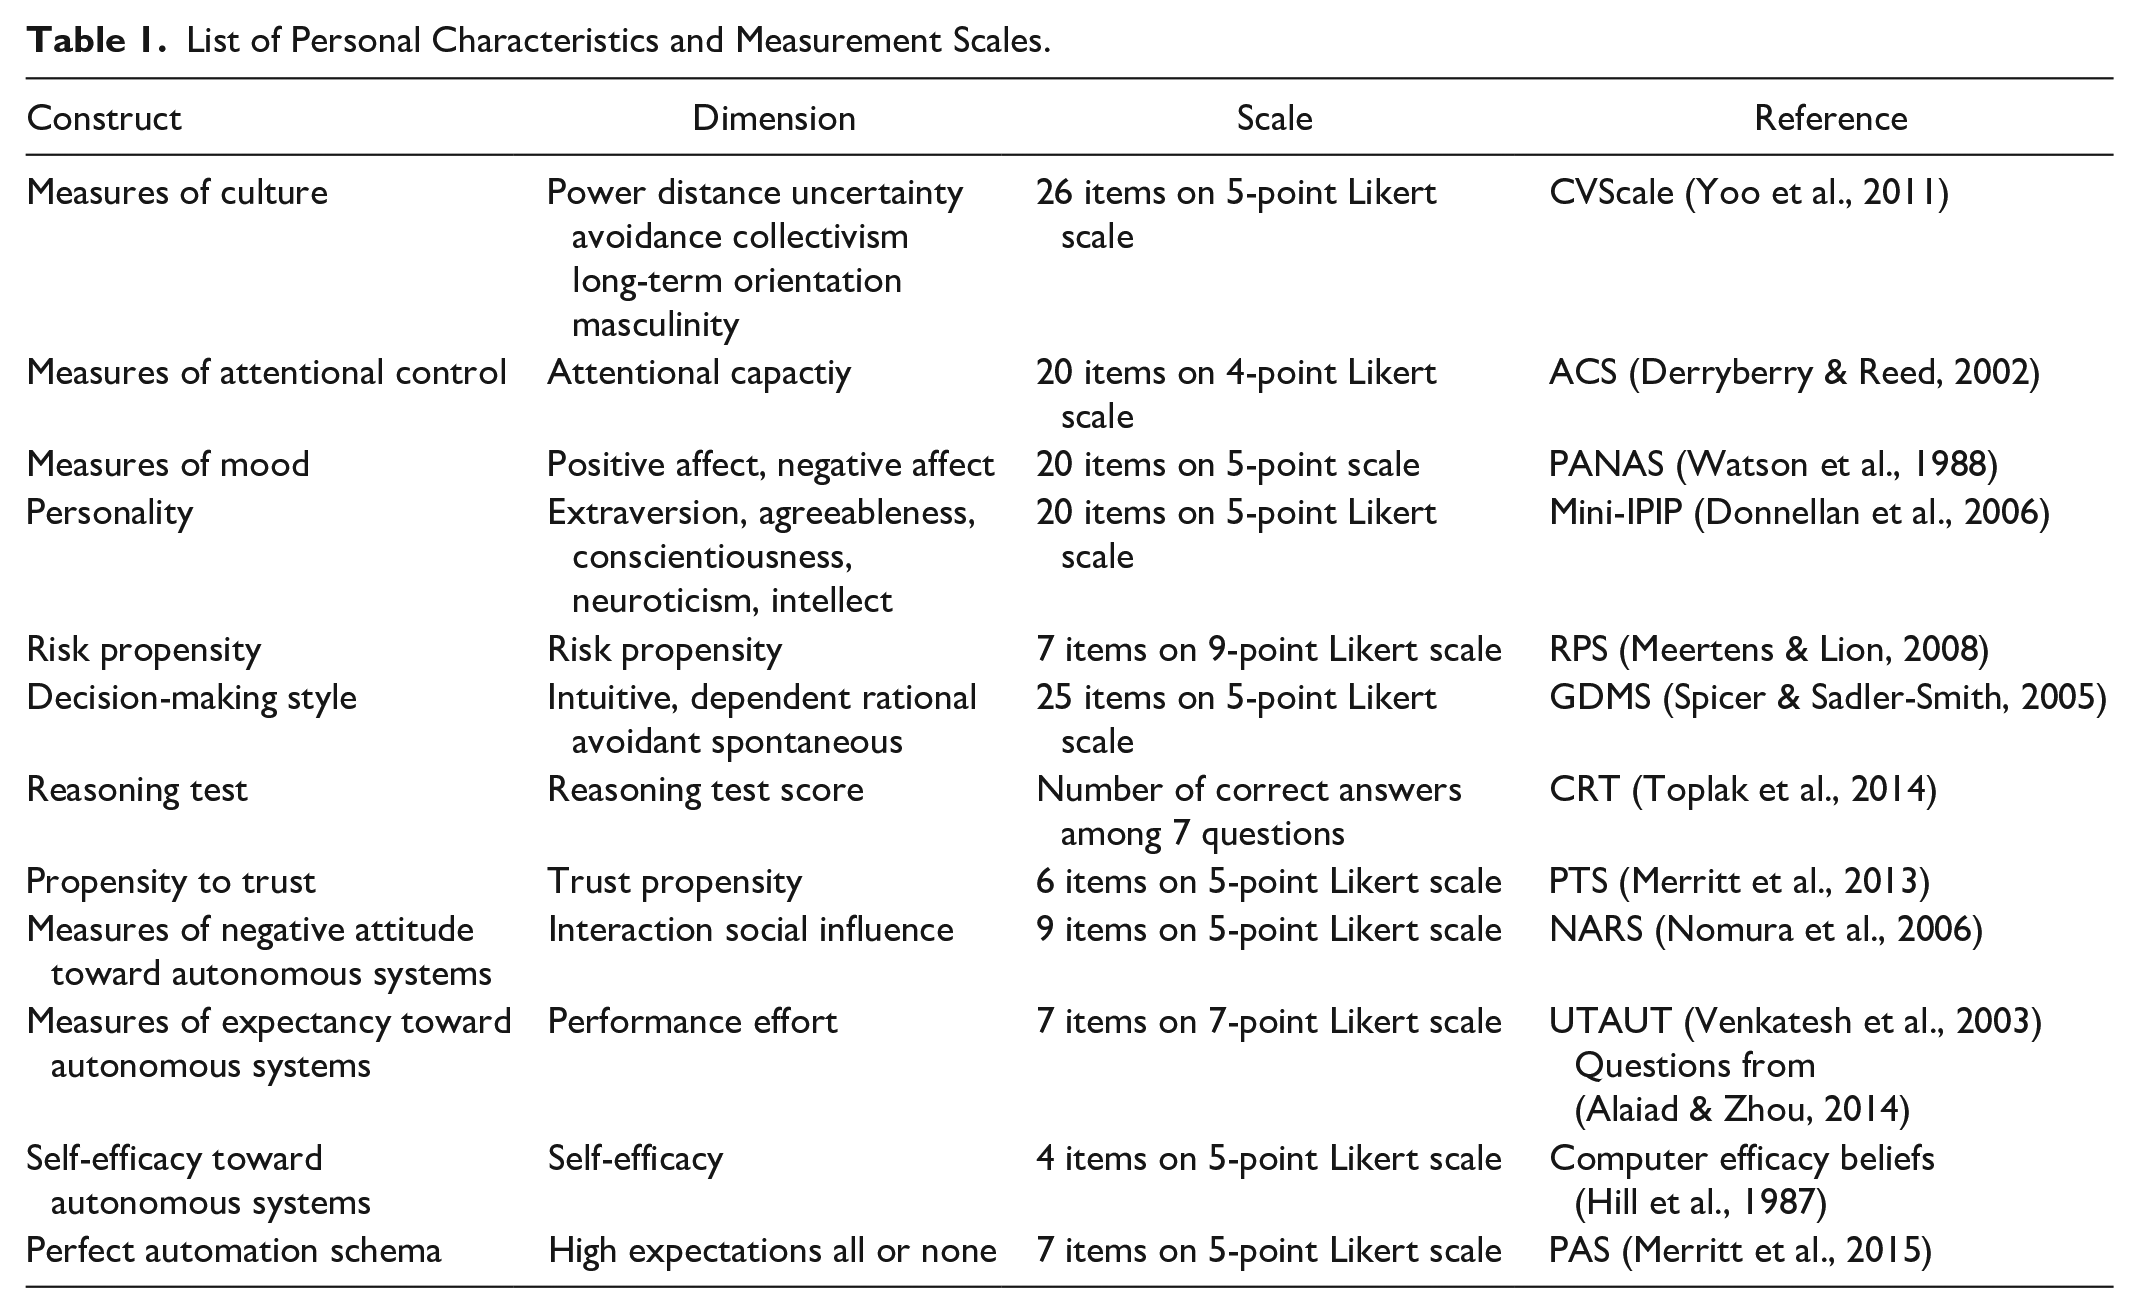
Before conducting the experiment, participants were asked to fill out a survey that assessed a variety of their individual characteristics. These characteristics have been identified to be associated with operators’ trust in and interaction with automation (Chung & Yang, 2024; Hancock et al., 2021; Hoff & Bashir, 2015; Kaplan et al., 2023). Table 1 lists all twelve of these individual characteristics, the corresponding dimensions, and their measurement scales. In addition to these questions, we also asked participants to rate their experience with automated and autonomous systems and their overall familiarity with Artificial Intelligence and Machine Learning. The final set of questions asked participants about their previous experience with video games.
List of Personal Characteristics and Measurement Scales.
Tracking Task
The tracking task was developed using the Psychology Experiment Building Language (PEBL) framework (Mueller & Piper, 2014). In this task, participants utilized a joystick to align a randomly drifting green circle with a stationary cross-hair positioned at the center. Throughout each trial, participants had the potential to accumulate up to 10 points based on their performance in the tracking task. Tracking error, denoted as the pixel-based separation between the cross-hair and the circle, was recorded at a frequency of 20 Hz. Subsequently, we computed the Root Mean Square Error (RMSE) from the tracking errors collected across all trials. To establish participants’ tracking scores, we employed a 10-bin histogram based on the RMSE distribution derived from a prior investigation by Yang et al. (2017), thereby determining the corresponding score out of 10 for each participant.
Threat Detection Task
Throughout each trial, participants were presented with a new set of four static photographs, each potentially depicting threatening scenarios. These threats were visually represented by human figures, with only one threat featured per photo. Distraction stimuli were intentionally omitted, with participants explicitly instructed to perceive every human figure as a potential threat. The distribution of threats across the four images was uniform. For each successful threat detection task, participants had the opportunity to accrue a maximum of 5 points, albeit subject to a linear time penalty based on the duration taken to identify the threat. Any erroneous identifications by the participant, whether in the form of a false alarm or a miss, resulted in a threat detection score of zero for that trial. Conversely, correctly identifying the absence of a threat awarded participants the full 5 points for the detection task, as no further action was warranted. The calculation employed during successful identifications (hits) was as follows: Detection Score = 5 − 5 * (detection time/total trial time).
Automated Aid
For the threat detection task, participants relied on an automated aid, albeit imperfect, which provided binary recommendations regarding the presence of threats (“safe” or “danger”) through both auditory and visual alarms. Despite these cues, participants retained the ultimate responsibility of deciding whether to report a perceived threat, accomplished by activating the joystick’s trigger. Based on previous research benchmarks (Du et al., 2020; McBride et al., 2011; Wiczorek & Manzey, 2014; Yang et al., 2017), we established a base rate of 30% for true signals.
Post-Experiment Survey
After participants completed the requisite number of trials, they were asked to complete a debriefing questionnaire. The questionnaire included 8 questions on a 5-point Likert scale regarding their overall trust in the automation; 9 questions on a 5-point Likert scale regarding their overall satisfaction of the threat detector; 5 questions on 5-point Likert scale regarding their understanding of the automated threat detector; and a single question on a 7-point Likert scale regarding their self-confidence in completing the same dual task scenario without the assistance of the automated threat detector.
Procedure
Participants were enlisted through email communication and subsequently welcomed to the laboratory. Upon their arrival, they were required to complete an informed consent form before commencing with the training phase, aimed at acquainting them with the experimental scenario. This training regimen consisted of two segments: first, participants undertook 30 practice trials exclusively focused on the tracking task, followed by an additional 8 practice trials involving the dual-task scenario. Notably, participants were not provided with any information regarding the likelihood of automation during this phase. Each trial commenced with a 3-second countdown, and immediate performance feedback was delivered following the conclusion of each trial. After the 50th trial, participants were mandated to take a 5-minute break.
Independent and Dependent Variables
This study examines the relationships between an individual’s characteristics and their dependence behavior and performance in the dual task scenario.
Individual Characteristics
We measured 28 dimensions of the 12 characteristics constructs listed in Table 1.
Compliance, Reliance and Cross-Checking Behaviors
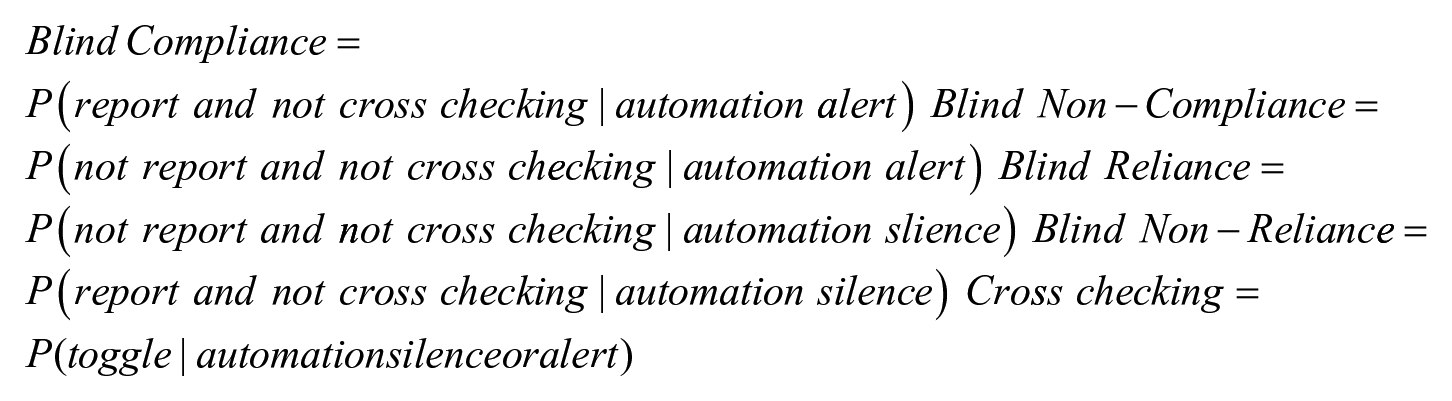
We calculated the operators’ compliance, reliance and cross-checking behaviors using the following formulas. Blind compliance refers to the operator reporting a threat without cross-checking when the automation also alerts for a threat. Blind non-compliance describes when the operator does not report a threat without cross-checking when the automation sends an alert signal. Blind reliance behaviors describe when an operator does not report without cross-checking in the event of automation silence. Blind non-reliance indicates a behavior when the operator disagrees with a non-alarm without cross-checking. Cross-checking refers to the action of the operator toggling from the tracking task to the detection task to cross-check.
Tracking and Detection Performance
Tracking and detection metrics describe how the participant performed during the testbed. As described in the methods section we analyzed characteristics related to their performance to observe continuity between how an individual assesses themselves versus how they actually respond in the testbed.
Results
To explore potential associations between personal characteristics and automation dependence behaviors, we conducted correlation analysis. These coefficients were used to quantify the strength and direction of linear relationships between variables. Due to the exploratory nature of the study, a p-value of .05 was considered significant and a p-value between .05 and .1 was deemed marginally significant. Combining methods from both Cook’s Distance and studentized residuals, we identified a list of outliers. We then removed these outliers from the dataset, ensuring that our analysis was not influenced by extreme or overly influential data point which minimizes the risk of outlier-driven distortions.
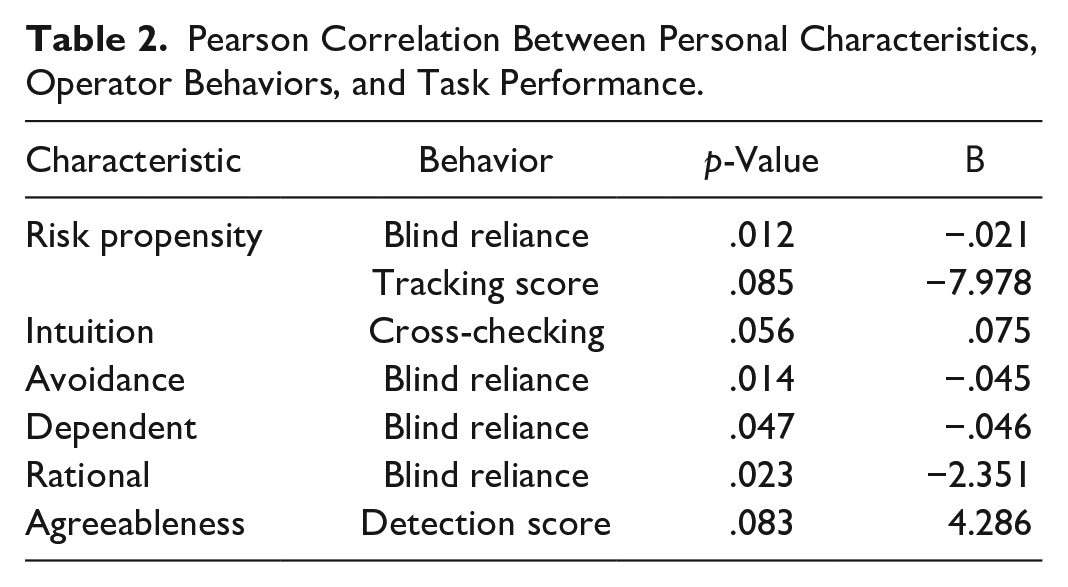
Table 2 shows the significant correlations found in our analysis.
Pearson Correlation Between Personal Characteristics, Operator Behaviors, and Task Performance.
Risk Propensity
The Risk Propensity Scale measures an individual’s tendency to take risks in general (Meertens & Lion, 2008), with a higher score indicating more risk-taking tendency. There was a significant correlation between Blind Reliance and Risk Propensity (β = −.021, p = .012). The more risk-taking a person is, the less likely s/he will blindly rely on automation in the cases of automation silence. Trends were also indicated with risk propensity and tracking scores (β = −7.978, p = .085). A higher risk propensity score indicates that participants were generally performing worse on the tracking task (Figures 2 and 3).
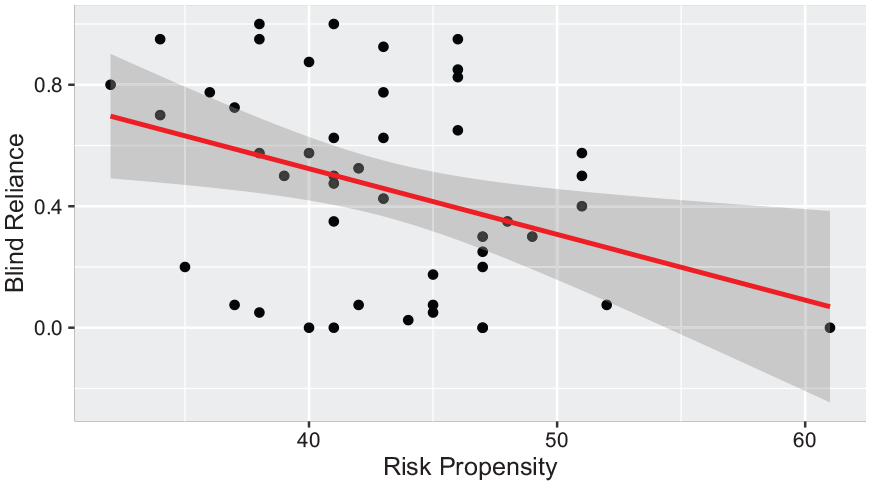
Relationship between risk propensity and blind reliance behaviors.
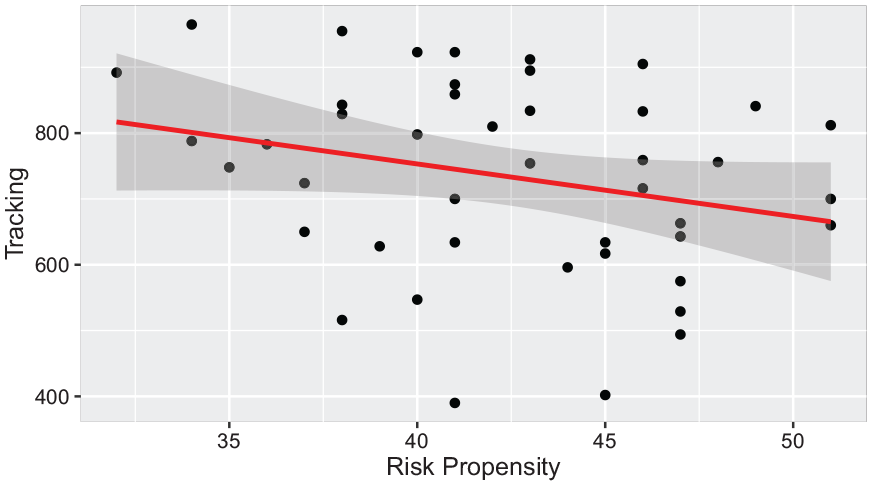
Relationship between risk propensity and tracking scores.
Intuition
Using the General Decision Making Styles (GDMS) questionnaire, intuition measures one’s “reliance upon hunches, feelings and impressions” (Spicer & Sadler-Smith, 2005, pp. 137). A participant with a higher intuition score is more likely to depend on their instincts. On the other hand, someone with a lower score may take more time to analyze a problem set. We found a marginally significant correlation between intuition and cross-checking behaviors (β = .075, p = .056). The positive relationship suggests that individuals reporting higher levels of intuition also tend to have higher cross-checking rates (Figure 4).
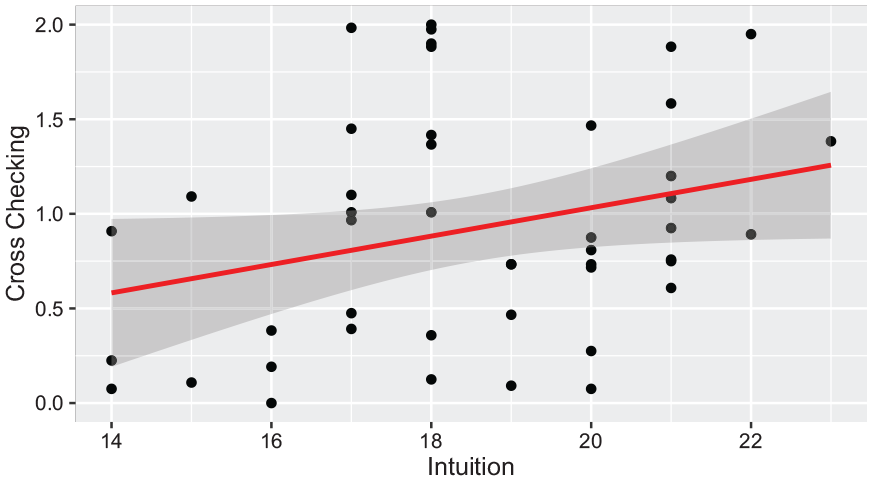
Relationship between intuition and cross-checking rates.
Avoidance
Avoidance was measured using the GDMS questionnaire which describes avoidance as the tendency to delay or avoid decision making (Spicer & Sadler-Smith, 2005). A higher avoidance score indicates that a participant is more apt to delay decision-making in general. Blind Reliance behaviors displayed a significant correlation with avoidance (β = −0.045, p = .014). The negative correlation indicates that when an alarm occurs a participant with a higher avoidance score will agree without cross-checking (Figure 5).
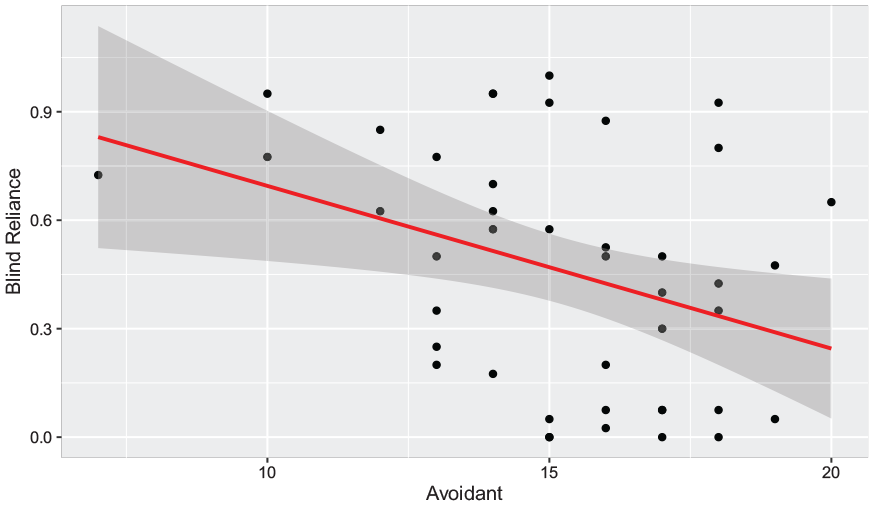
Relationship between blind reliance and avoidance.
Dependence
Dependence was measured using the GDMS questionnaire which is described as the tendency to rely on “direction and the support of others (Spicer & Sadler-Smith, 2005).” Higher dependence scores indicates a stronger need for guidance or outside suggestion. One of the strongest relationships observed was between reported dependence and Blind Reliance (β = −.046, p = .047). The negative relationship between dependence and Blind Reliance behaviors suggests that individuals with higher reported dependent levels may feel the need to cross-check more often to ensure the automation recommendation accuracy (Figure 6).
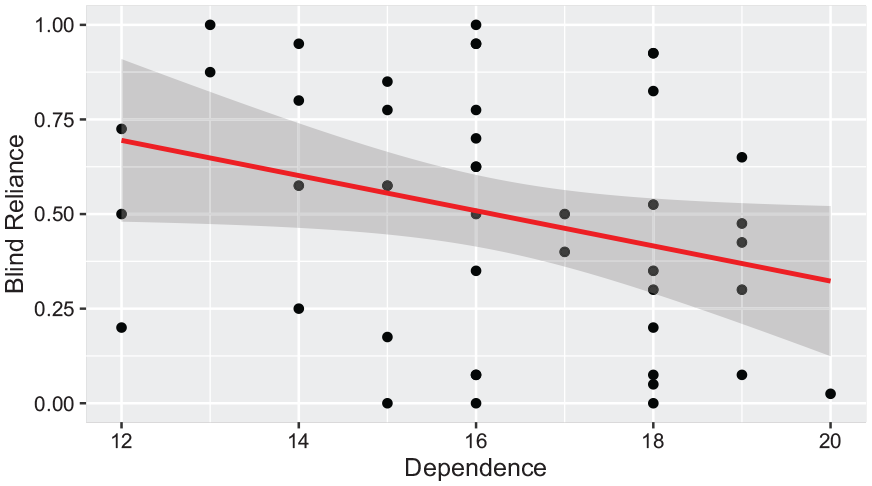
Relationship between dependence and blind reliance.
Rational
The rational dimension was assessed as part of the GDMS questionnaire, which is described as an individual’s ability to make “logical and structured decision making (Spicer & Sadler-Smith, 2005).” A higher score indicates a stronger propensity for the participant to make deliberate and logical decisions. Among the behaviors analyzed, we found a strong positive correlation between rational scores and blind-reliance (β = −2.351, p = .023) (Figure 7).
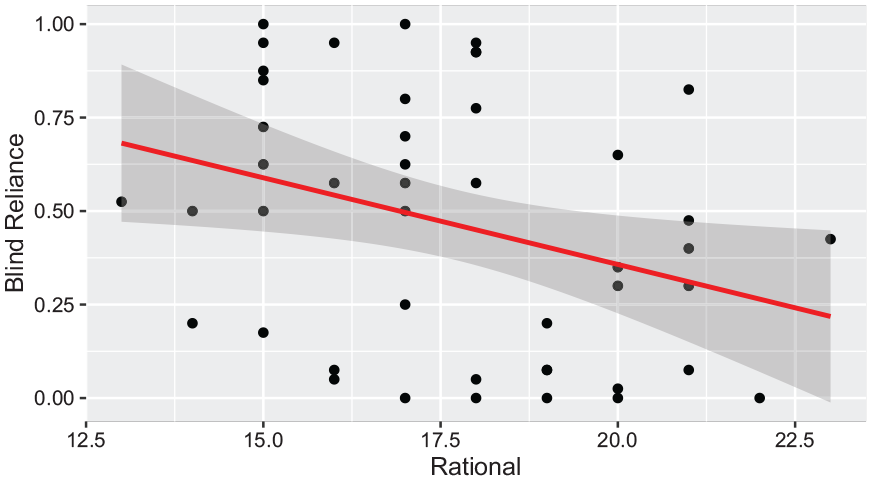
Relationship between rational and blind reliance.
Agreeableness
Agreeableness is a dimension of the personality construct which was measured using the 20 item International Personality Item Pool-Five-Factor-Model or the Mini-IPIP (Donnellan et al., 2006). A higher agreeableness score would indicate that a participant is more likely to embrace cooperation in general. There is a marginally significant positive correlation between total detection scores and a participant’s agreeableness score (β = 4.286, p = .083) (Figure 8).
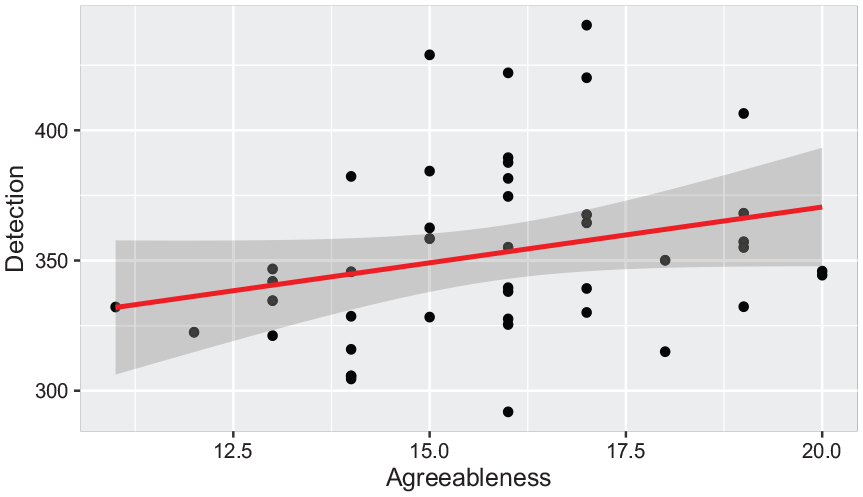
Relationship between agreeableness and detection scores.
Discussion
We predicted that a host of individual characteristics would provide insights into operator dependence on automation. The surveys served as a medium to establish a baseline for every operator’s individual characteristics. We could then use data produced from this baseline to establish general operator trends as they related to their performance and behaviors when conducting the test bed. Our preliminary study has revealed several significant and marginally significant correlations.
We observed correlations between blind reliance and several personal characteristics, including risk propensity, avoidance, dependent scores, and rational scores. Interestingly, no correlation was found between compliance behaviors and personal characteristics.
We also observed some seemingly counter-intuitive results. Specifically, regarding self-reported intuition scores, we observed a positive correlation between intuition and cross-checking rates. However, those with a higher intuition score were expected to make decisions based on gut feelings rather than through deeper consideration.
Four of the six dimensions in the decision-making style construct showed significant or marginally significant correlations with reliance and cross-checking behaviors. The other two constructs are found in the personality or risk propensity constructs. We can surmise that, to a greater degree, decision-making styles in an individual influence how they will interact with automation, with personality and risk propensity asserting a lesser influence. Future iterations studying personal characteristics and automation can be guided by these constructs when observing interaction in a variety of automation settings.
This study is subject to several limitations that should be considered. First, as an exploratory study with a small sample size, the results should be interpreted with caution. Future research with larger sample sizes is needed to substantiate our findings. Second, given the significant relationships identified between a few characteristics and behavioral outputs, subsequent studies should intentionally include participants with both high and low scores on these characteristics. This approach will introduce more variance and help verify the preliminary evidence provided by this study. Third, examining personality characteristics across different task scenarios will offer further insights into the impact of these traits on human-automation interaction.
Conclusion
Human-automation interaction is increasingly common across various settings where humans collaborate with imperfect automation. However, there has been insufficient focus on how individual characteristics influence interaction strategies and dependence behaviors with automation. This paper presents a controlled laboratory experiment with 52 participants in a dual-task scenario. The study investigates the interplay between individual characteristics/traits and operator behaviors, contributing to the understanding of human factors in HAI. The findings can be used to personalize team interactions, foster appropriate trust, and enhance overall task performance.
Footnotes
Declaration of Conflicting Interests
The author(s) declared no potential conflicts of interest with respect to the research, authorship, and/or publication of this article.
Funding
The author(s) disclosed receipt of the following financial support for the research, authorship, and/or publication of this article: This material is based upon work supported by the National Science Foundation under Grant No. 2045009 and the University of Michigan Center for Ergonomics.