
Abstract
Automakers are beginning to include larger and brighter tablet-style interfaces in their vehicles. The amount of light emitted from these large interfaces could cause issues with driver distraction and might degrade performance. In the following study, the impact of bright lights from the interface on driver performance and object detection was studied.
Large digital interfaces in vehicles have become popular in the last few years. These interfaces emit a large amount of light which could cause issues when driving in dark environments. The following study explores the impact of bright interfaces on driver performance and object detection with the interface in the peripheral view of the driver. The study was conducted in a driving simulator with 12 participants (6M, 6F, M = 23 years old). Participants were instructed to perform two activities simultaneously. Inspired by difficulties faced when driving at night in Michigan, there was a lane change task in the driver simulator and a task in which participants searched for deer in their right or left peripheral vision on the screens surrounding the driver simulator. To emulate dark nighttime conditions the lights were turned off and the contrast and brightness on the main screens were turned down. The following data was analyzed: driver performance, object detection, participant height, and illuminance measures. Results showed that cheek and nose bridge illumination were almost equivalent showing glare was distributed across the driver’s vision. Additionally, it was observed that shorter participants had slightly higher illumination on their right cheek than taller participants. Performance was consistent across brightness levels however several participants vocally noted frustration or stress increasing with the brightness. Overall, the data showed that there was little to no impact on driver performance or object detection in the test-driving conditions.
Introduction
Many automotive manufacturers are replacing physical button-based interfaces with increasingly large tablet interfaces. These interfaces control almost everything in the vehicle such as navigation, radio/music, heating and cooling, etc. In some case, the gear shifter is also located on the tablet. Because these LED interfaces can get extremely bright, it is important to understand if there is any danger to driver safety due to the glare from these tablet style interfaces, especially at night or in dark situations. Past work on this topic is inconclusive and mostly considers the glare from lights on the road itself rather than within the vehicle, and results from these studies show that glare from light sources is the most concerning visual impairment when driving at night (Gruber et al., 2013; Owens et al., 2007; Wood, 2020). The following study considers the LED tablet interface within a vehicle as the only glare source, and brightnesses and colors of the tablet were selected to assess a potential worst-case scenario (to establish the scope of future work) where the interface does not enter a specific “dark mode” or dim mode when driving at night.
Methods
To study the impact from the interface on both driver performance and object detection, participants were asked to perform two activities simultaneously. Inspired by the difficulties faced while driving at night in Michigan, the participants would be performing a lane change task while simultaneously searching for deer in their right or left peripheral vision. With each trial, the lighting level on the interface would change and the tasks would be repeated. The following section describes the experiment in greater detail.
Equipment and Setup
A three-screen driving simulator (shown in Figures 1 and 2) was used in this study. On the center screen, the lane change task was shown, and the left and right screens there was a forest environment in which participants would be searching for deer. The interface was set at an angle and placed on the right side of the participant, as it would be in a vehicle. A Microsoft Surface Pro 6 was used as the interface. This device had a maximum brightness of 470 cd/m2 which is a reasonable estimate for vehicle interface screens. There was also an eye tracker placed behind the steering wheel of the participant. An illuminance meter was used at the start of every trial to measure the amount of light reaching the participants’ eyes.
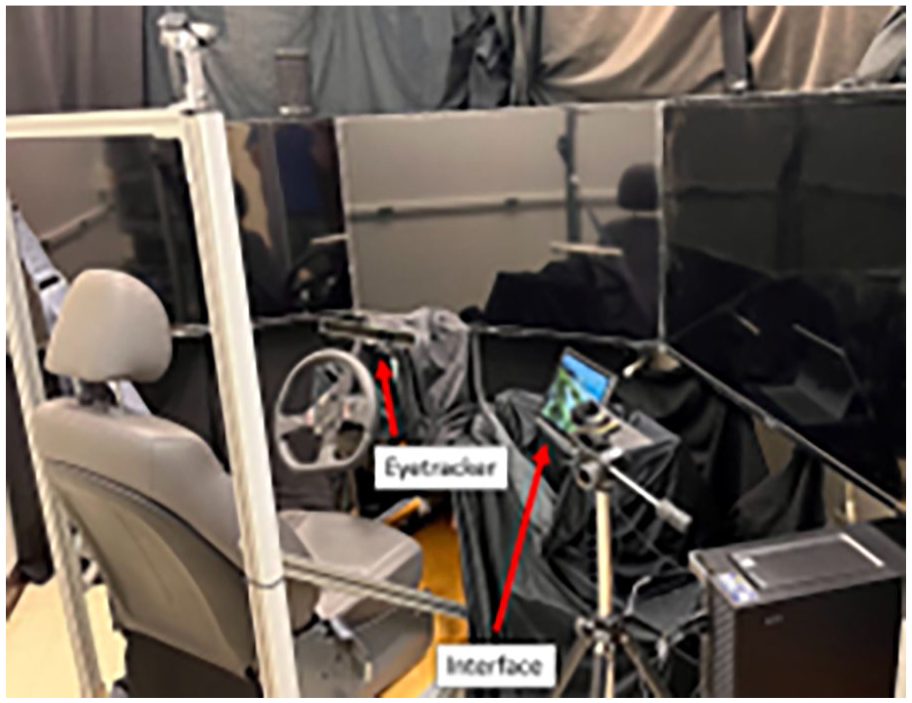
Overall view of driving simulator.
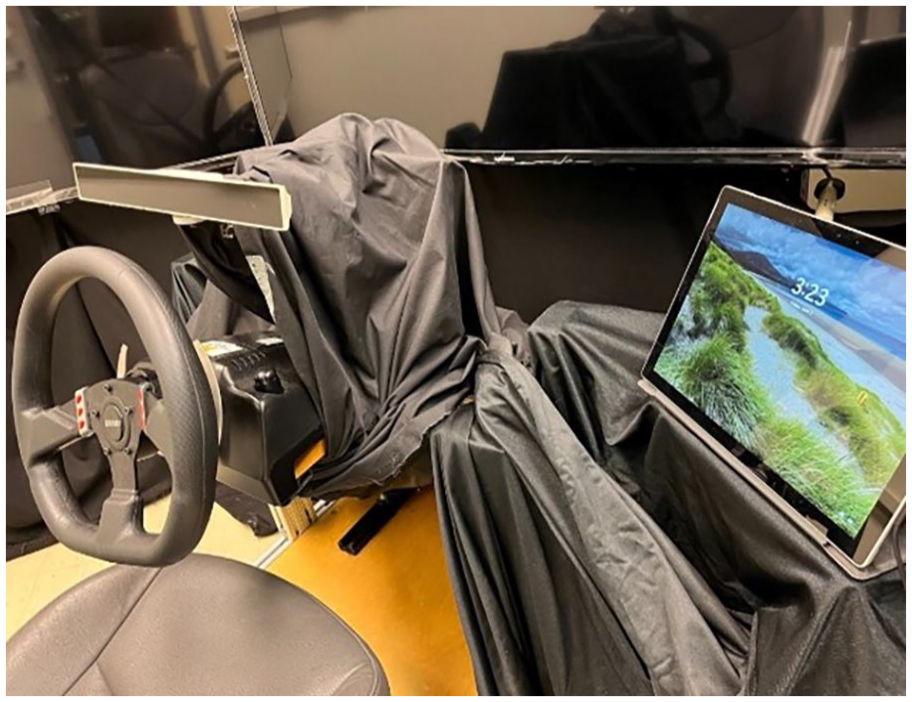
Close view of main interface and steering wheel.
Participant Information
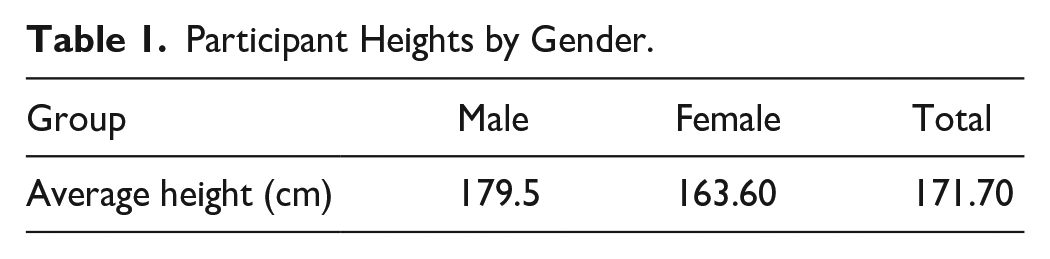
Twelve participants (6M, 6F, M = 23 years old) participated in this study. All participants were licensed drivers and had normal or corrected-to-normal vision. As the angle of the participants’ body and location relative to the screen was important to this study, it was hypothesized that participant height may have some impact on the glare experienced by the participant. A summary of the participant heights is shown in Table 1 below.
Participant Heights by Gender.
Experiment Design
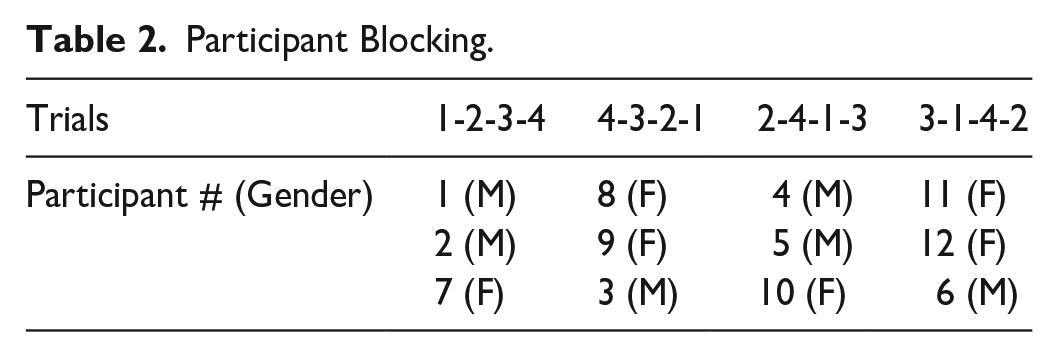
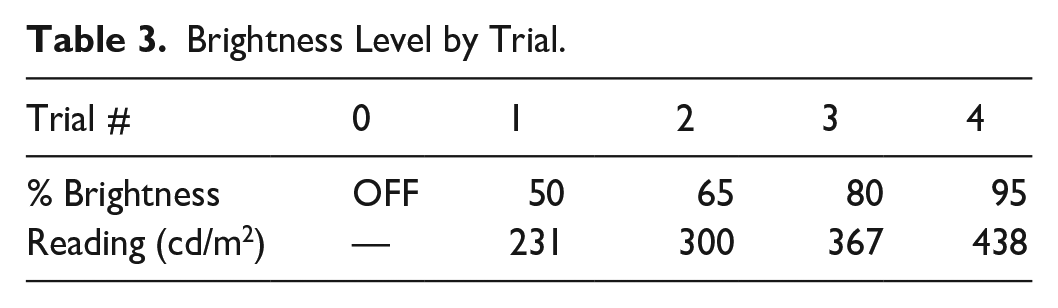
To reduce the impact of practice, the trial blocking used is shown in Table 2 below in which participants 1 to 6 were male and 7 to 12 were female. Participants performed four trials and one practice trial at the start of the experiment with each trial lasting about 15 min. The only thing that would be changed between trials was the brightness of the main interface and the interface was turned off during the initial practice trial. The interface brightness would be varied from 50% to 95% brightness which is 231 to 438 cd/m2. Table 3 below shows the trial number and associated percent brightness and cd/m2 reading. All trials were conducted in the nighttime condition in which the simulator room lights were turned off and the simulator screens were dimmed, and the contrast was lowered. When the interface was turned off, the driver simulator illuminance measures were 0 to 1 cd/m2.
Participant Blocking.
Brightness Level by Trial.
The main driving task in this experiment was the Lane Change Task presented in ISO 26022 (International Organization for Standardization [ISO], 2010; Zheng et al., 2023). In this task, participants will drive on a three-lane rural highway and roadside signs will indicate to the participant which lane they should be in. When the participant sees this sign, they will move to the indicated lane. Figure 3 below shows this task.
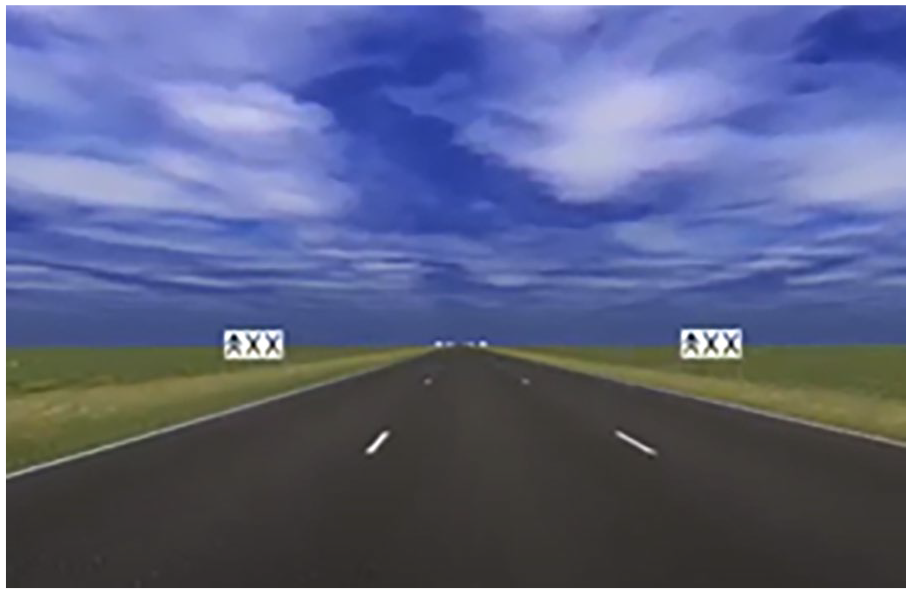
Lane change task.
In addition to the driving task, participants were performing a simultaneous object detection task. On the left and right screens, a slide deck containing forest environments would automatically change slides every 3 s. In the 300 slides, there would be 20 deer on the right and 20 deer on the left were spread throughout the slides. Each trial had an associated slide deck with a set order. Additionally, the deer was always within the first third of the screen and the same deer head image was used (shown in Figures 4 and 5). When a participant spotted a deer, they would click a lever on the left or right on their steering wheel based on which side the deer appeared.
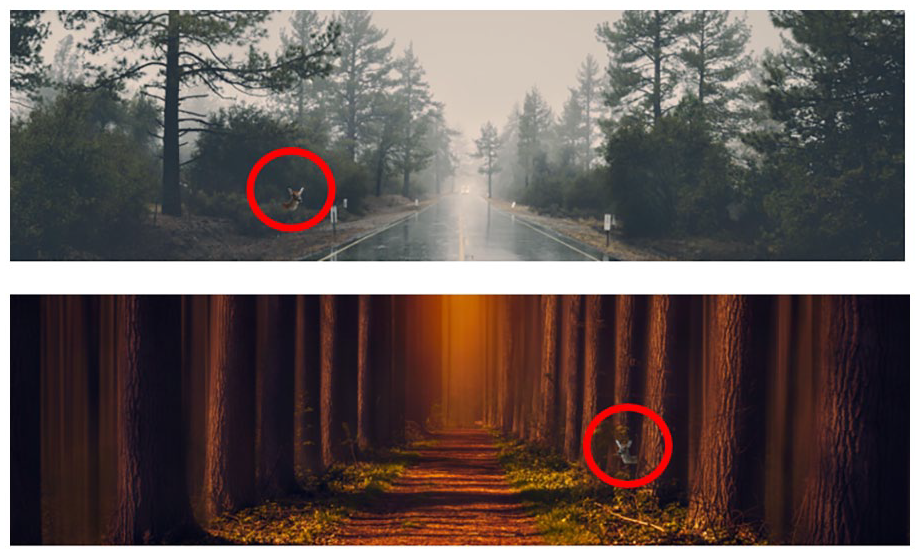
Examples of slides with deer.
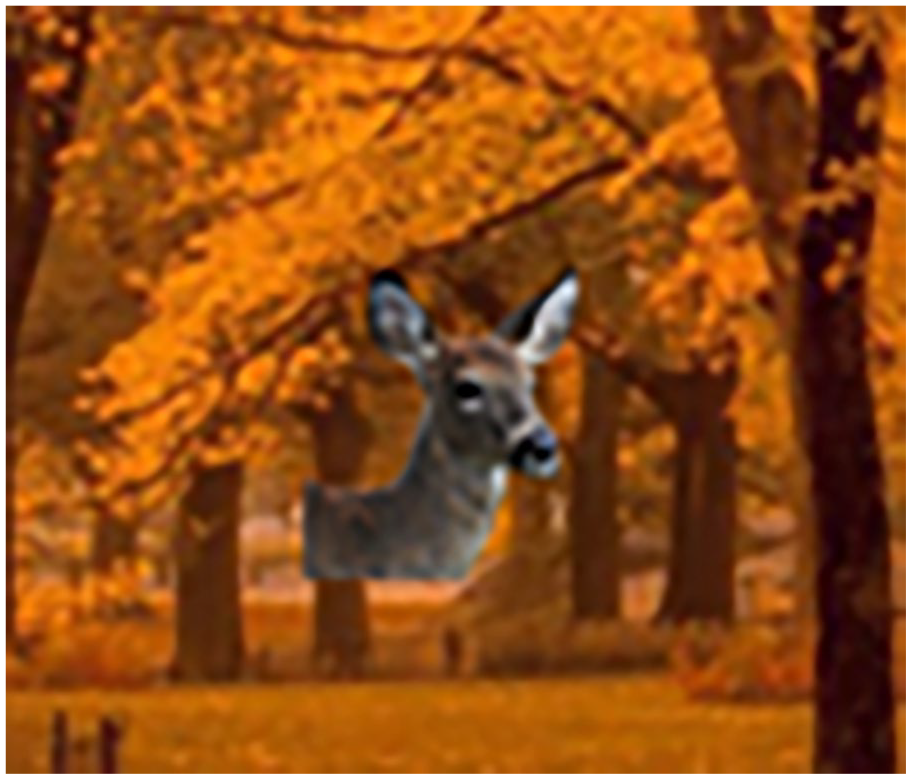
Close shot of deer.
During the study, participants were instructed to adjust the seat to how they would normally drive and to wear their seatbelt to accurately simulate driving conditions. They were also instructed to drive the simulator at the maximum speed of 60 miles per hour to ensure consistency between participants. Additionally, before the start of every trial, participants used an illuminance meter on their nose bridge and right cheek to measure the amount of light reaching their eyes from the main interface.
Results
Illuminance Measures
The interface was placed at an angle on the right-hand side of the driver as it would be in the vehicle. Therefore, to check if the participants were receiving more glare in one eye, the lighting level was measured at both the right cheek and the nose bridge (right eye vs. both eyes). The following Figure 6 shows the linear regression of these lighting levels across all participants. From both the equation of fit and R2 value, it is shown that the right cheek illuminance levels are slightly higher than nose illuminance levels which is reasonable as the interface was on the right-hand side of the driver. However, as the slope is nearly one, this indicates that there is not much difference between the right cheek and nose bridge illuminance levels (or how much light the eyes were receiving). Therefore, only right cheek illuminance levels will be used in analysis for the remainder of the report.
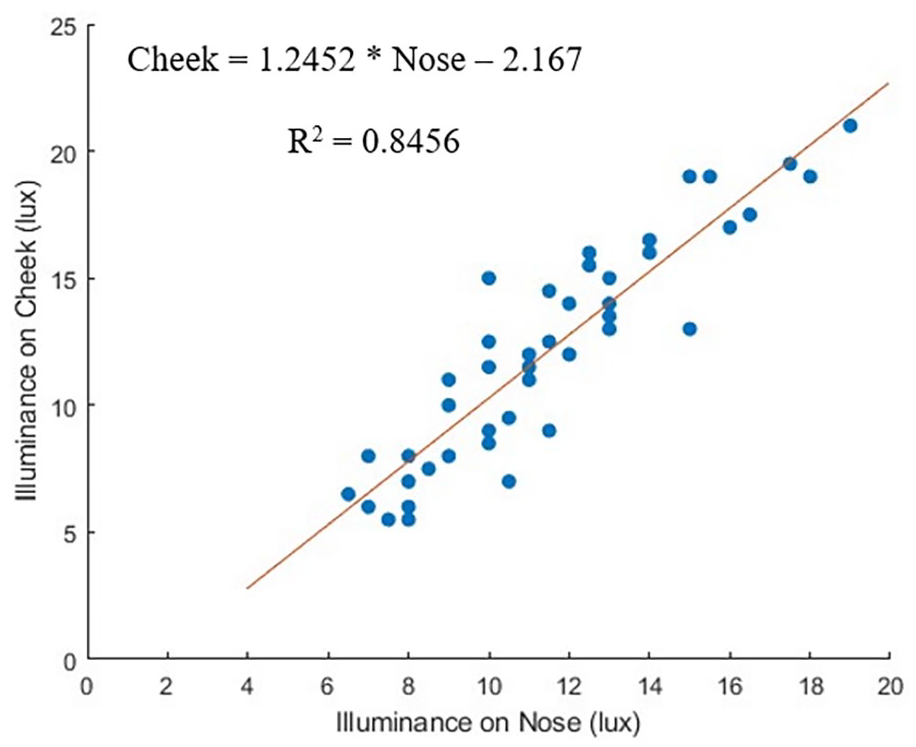
Right cheek versus nose illuminance measures.
As there was a large variety of heights within the participants, it was important to check that there was no impact from a participants’ height on the amount of light reaching their eyes. Figure 7 on the next page shows participant height in centimeters against the right cheek illuminance levels. As shown in the following figure, there is very little correlation between height and illuminance on the right cheek. While some participants had much larger gaps in illuminance between trials compared to other participants, this was not found to be correlated to height. Therefore, in any future iterations of this research, it would be important to check whether these gaps came from the angle of the interface or how participants sat in the driver’s seat.
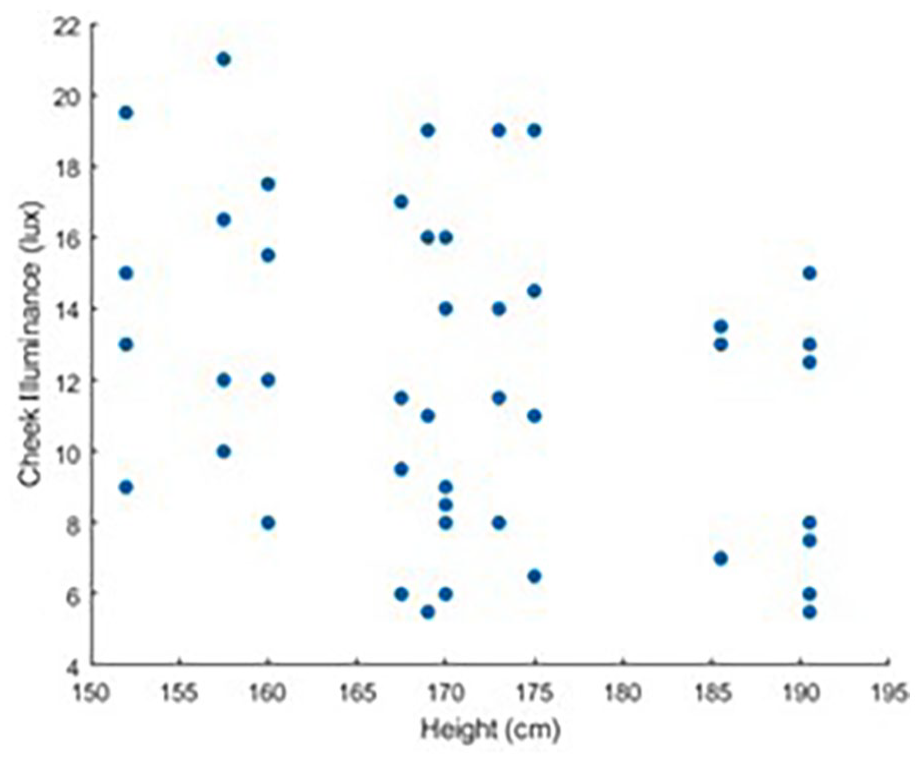
Height versus right cheek illuminance.
Driving Performance
As discussed earlier, the participants’ primary driving task was a lane change task in which they followed signs to change to the proper lane. The software used took multiple measurements of the driver’s performance throughout each trial. In the following figures, the two main performance metrics used are mean lane deviation and the standard deviation of the lane deviation, both in meters. This measures how well participants were able to stay in the assigned lane.
In Figure 8 on the next page, the mean lane deviation is plotted against the right cheek illuminance level and there is very little change in the mean lane deviation as the lighting level increases. Therefore, as the amount of light that reached the participants’ eyes increased, there was no impact on how well a participant was able to drive.
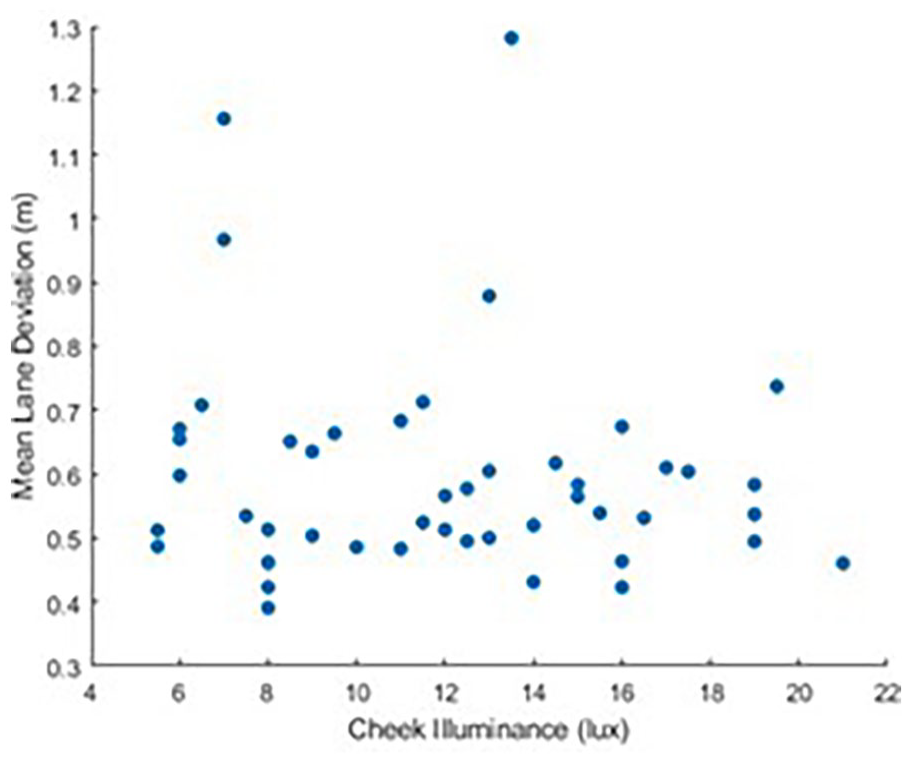
Mean lane deviation versus right cheek illuminance.
In Figure 9 on the next page, the mean lane deviation was plotted against the trial number in which trial 0 is the baseline practice trial where the interface is off and trials 1 to 4 correlate to the brightness of the interface from 50% to 95% brightness (see Table 3 on page 2). The mean lane deviations in the practice trial are similar to the test data showing that participant performance was relatively consistent throughout. Ignoring outliers, there is a very slight increase in the mean lane deviation in trials 3 and 4 when compared to trials 1 and 2. However, there is not enough of an increase to confidently state that there is an impact on driver performance as the brightness of the interface screen increases.
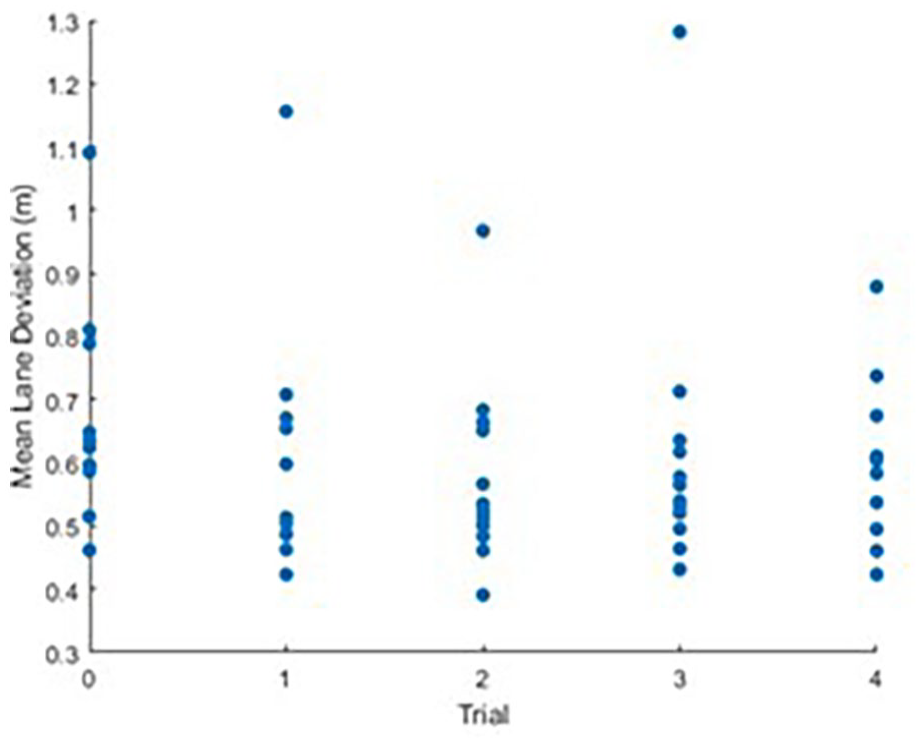
Mean lane deviation versus brightness level.
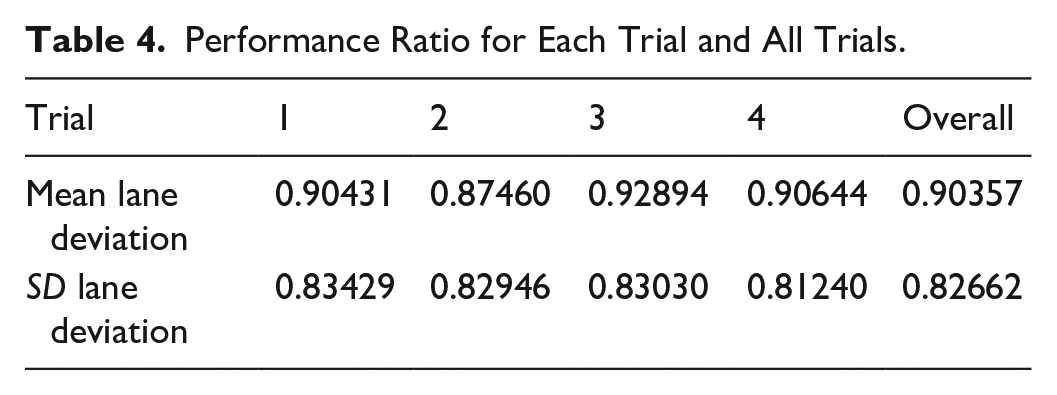
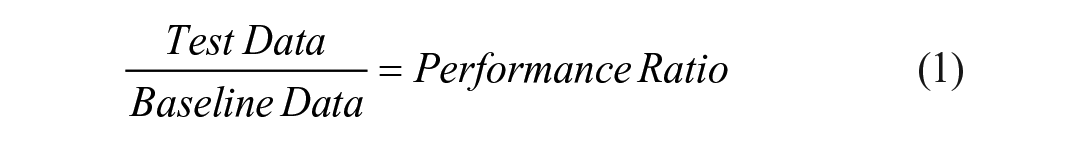
The performance ratio shown in Equation 1 below was used to assess if there was any correlation between the brightness of the interface and driving performance. Both mean lane deviation and standard deviation of lane deviation were used. The results are shown in Table 4 below. As both ratios are somewhat close to one, it can be interpreted that there was little difference between the test data and the baseline data. It can be concluded that there was little impact from increasing the brightness of the interface on driver performance in the lane change task.
Performance Ratio for Each Trial and All Trials.
Object Detection
In addition to the lane change driving task, participants were also performing an object detection task. The accuracy of the participants’ object detection was measured for both left and right as well as total accuracy.
Object detection accuracy was compared when the deer was on the left side of the screen versus on the right side of the screen. The thought was that the right side of the screen would have a lower level of accuracy when compared to the left as that is where the bright interface was located. However, as noted in Figure 6 on page 3, there is very little difference between the illumination levels on the nose and right cheek indicating that relatively the same amount of light is reaching both eyes. This relationship carries on in Figure 10 on the next page as there is no relationship between the left and right side accuracy. Therefore, all further analyses will be reported with total accuracy only.
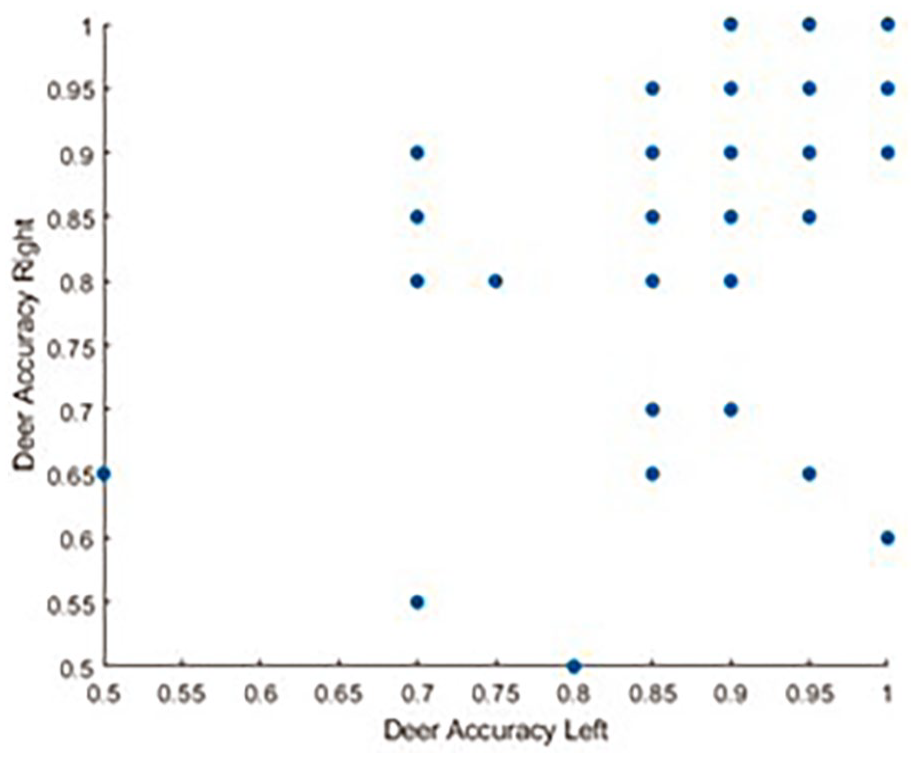
Deer accuracy right versus deer accuracy left.
Figures 11 and 12 show total accuracy (all deer) compared with the cheek illuminance level as well as trials (or brightness levels). As shown in the following two figures, there is no impact from the brightness of the interface on the participants’ ability to detect the deer. There is a slight downward trend shown when comparing the accuracy with the right cheek illuminance which shows that there is some impact on object detection as the amount of light that reached the participants’ eyes increased. This relationship could be further established by testing over a longer period of time at the same illuminance level or adding a larger range of lighting levels.
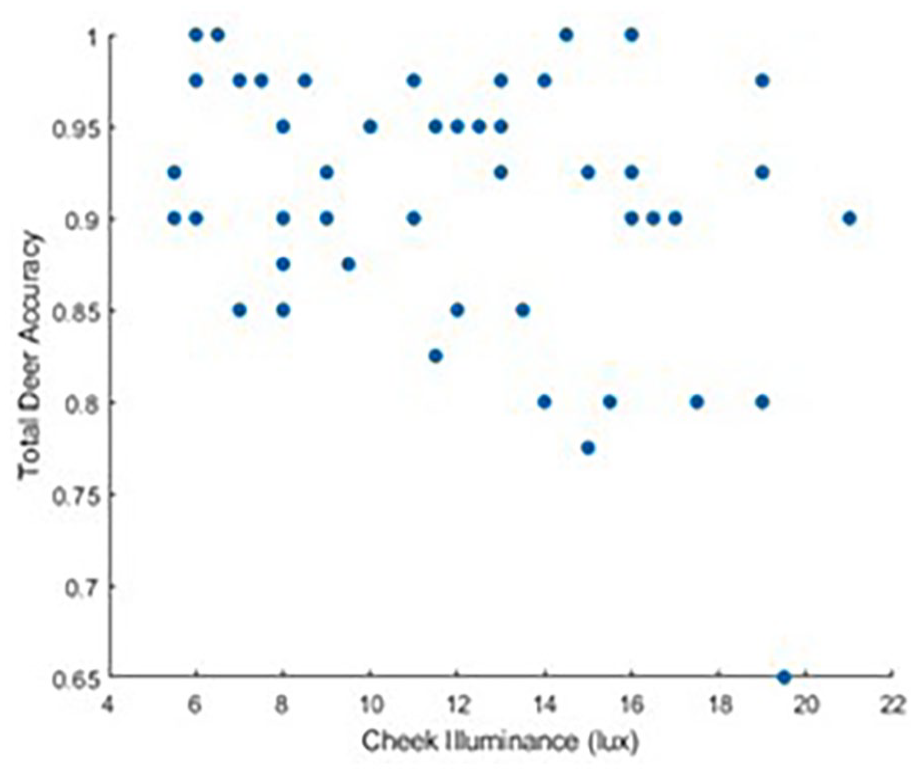
Total deer accuracy versus right cheek illuminance.
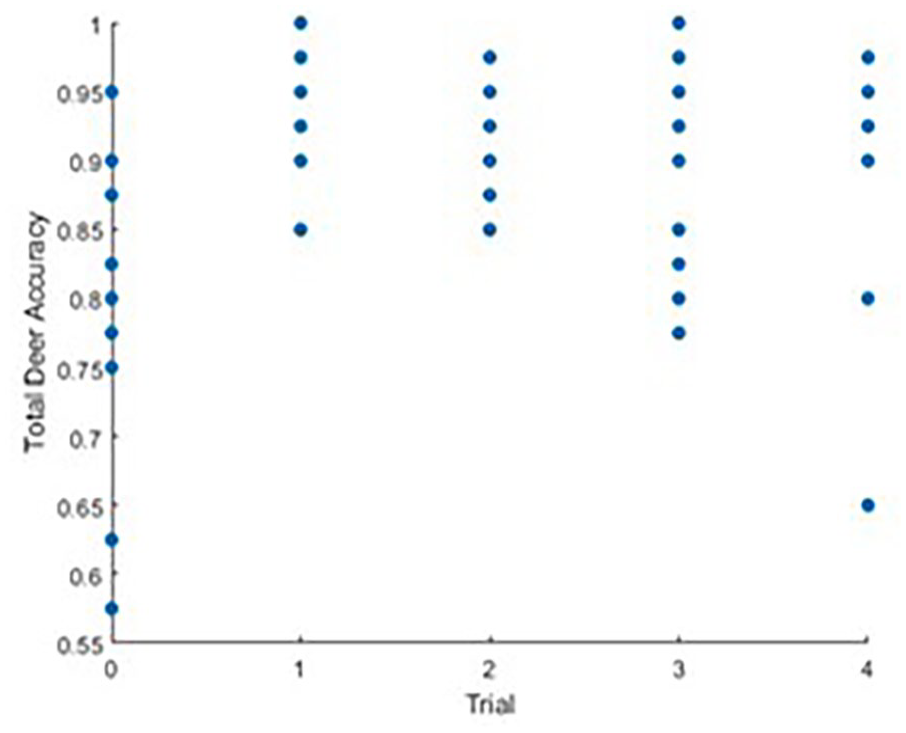
Total deer accuracy versus brightness level.
However, this relationship is not as clear in the following figure in which the brightness level of the interface was compared with object detection directly. This could indicate that the brightness level of the interface does not have as much of an impact when compared to the amount of light hitting the participants’ eyes directly.
Conclusions
Overall, the data shows that there is little to no impact on driver performance or object detection in this setting. There were some slight relationships with right cheek illumination levels and overall object detection, but the relationship was not strong enough to draw any solid conclusions. However, it is important to note that the participants did not glance at the interface and stayed focused on the road the entire time. Further experimentation assessing if there is any change in the results when the eyes need to refocus between two different screens may be required. Additionally, many participants noted increasing frustration or fatigue when the interface screen was brighter and mental relief when the brightness was lower. Taking additional qualitative data and exploring the mental workload required to perform the two tasks with different lighting levels may allow for new conclusions to be drawn.
Footnotes
Acknowledgements
The author would like to acknowledge the Patricia F. Waller Scholarship from the University of Michigan Transportation Research Institute which funded this work. The author would also like to acknowledge the contributions of Paul Green and Collin Brennan-Carey to this work and to the University of Michigan Transportation Research Institute for the driver simulator.
Declaration of Conflicting Interests
The author(s) declared no potential conflicts of interest with respect to the research, authorship, and/or publication of this article.
Funding
The author disclosed receipt of the following financial support for the research, authorship, and/or publication of this article: The funding received was from the Patricia F. Waller Fellowship from the University of Michigan Transportation Research Institute.