
Abstract
Objective
To understand the influence of driving experience and distraction on drivers’ anticipation of upcoming traffic events in automated vehicles.
Background
In nonautomated vehicles, experienced drivers spend more time looking at cues that indicate upcoming traffic events compared with novices, and distracted drivers spend less time looking at these cues compared with nondistracted drivers. Further, pre-event actions (i.e., proactive control actions prior to traffic events) are more prevalent among experienced drivers and nondistracted drivers. However, there is a research gap on the combined effects of experience and distraction on driver anticipation in automated vehicles.
Methods
A simulator experiment was conducted with 16 experienced and 16 novice drivers in a vehicle equipped with adaptive cruise control and lane-keeping assist systems (resulting in SAE Level 2 driving automation). Half of the participants in each experience group were provided with a self-paced primarily visual-manual secondary task.
Results
Drivers with the task spent less time looking at cues and were less likely to perform anticipatory driving behaviors (i.e., pre-event actions or preparation for pre-event actions such as hovering fingers over the automation disengage button). Experienced drivers exhibited more anticipatory driving behaviors, but their attention toward the cues was similar to novices for both task conditions.
Conclusion
In line with nonautomated vehicle research, in automated vehicles, secondary task engagement impedes anticipation while driving experience facilitates anticipation.
Application
Though Level 2 automation can relieve drivers of manually controlling the vehicle and allow engagement in distractions, visual-manual distraction engagement can impede anticipatory driving and should be restricted.
Introduction
With the state-of-the-art driving automation technology available to the public, that is, SAE Level 2 driving automation (SAE On-Road Automated Vehicle Standards Committee, 2018), drivers no longer need to control the vehicle continuously. However, they are still required to monitor the roadway and the automation, and intervene when necessary, either by taking over vehicle control or by adjusting the automation; intervention may be required due to degradations in automation reliability or situations that exceed automation capability. Drivers are expected to perform better if they can anticipate when their intervention is needed. For example, drivers exhibited more stable steering wheel control after a takeover when driving automation disengaged on a regular schedule compared with a variable and thus unpredictable one (Merat et al., 2014). Drivers also allocated more attention toward relevant cues within the vehicle and the environment indicating the potential for a takeover: Dogan et al. (2017) found that their participants looked more at the speedometer when they were approaching an upper speed limit of adaptive cruise control (ACC); participants of DeGuzman et al. (2020) glanced more at the roadway when there were breaks in lane markings, a situation that led to a lane-keeping assist (LKA) failure.
While the above studies suggest that drivers can perform better if they can anticipate when their intervention is needed, the type of scenarios utilized in these studies is fairly simplistic for studying the skill of anticipation. Anticipatory driving has been defined as “a manifestation of a high-level cognitive competence that describes the identification of stereotypical traffic situations on a tactical level through the perception of characteristic cues, and thereby allows for the efficient positioning of a vehicle for probable, upcoming changes in traffic” (Stahl et al., 2014, p. 605). Anticipatory driving goes beyond hazard anticipation and requires relatively complex scenarios, with causal links between the behaviors of different traffic agents, which we refer to as anticipatory scenarios (He & Donmez, 2020). In these scenarios, anticipation can be assessed using various measures, such as behavioral or glance metrics. For example, glancing more toward cues that indicate an upcoming traffic event and disengaging the automation prior to the event suggest that a driver might have anticipated the event. Limited research in automated driving has used anticipatory scenarios to investigate drivers’ anticipation of upcoming traffic events. In a driving simulator, Merat and Jamson (2009) found that drivers in nonautomated vehicles were better able to anticipate critical (i.e., required driver intervention) lead vehicle braking events than drivers in automated vehicles, as indicated by a faster brake response time. When the lead vehicle braking was due to a traffic light ahead changing from amber to red, drivers in nonautomated vehicles braked before the lead vehicle began braking, whereas drivers in automated vehicles did not brake until after. However, this study did not investigate the factors that may influence drivers’ anticipation. In a recent simulator study on automated driving, we investigated the effect of in-vehicle displays on novice and experienced drivers’ anticipation when they were distracted by a visual-manual secondary task (He et al., 2021), but we did not investigate the combined influence of driving experience and secondary task availability.
Research in nonautomated vehicles suggests that experienced drivers are more capable of anticipating upcoming traffic events (He & Donmez, 2020; Stahl et al., 2014), possibly because they are better at visually scanning the environment (e.g., Jackson et al., 2009; Sagberg & Bjørnskau, 2006) and they pay more attention to environmental cues that enable anticipation of upcoming events (i.e., anticipatory cues; He & Donmez, 2020; Stahl et al., 2019). While several studies investigated the influence of drivers’ experience with driving automation on their behaviors in automated vehicles (e.g., Larsson et al., 2014), a limited number of studies have focused on general driving experience. Young and Stanton (2007) found that active steering (a lateral support system) led to smoother control of speed and headway among novice drivers, but not among more experienced drivers; He and Donmez (2019) found that experienced drivers exhibited less risky off-road glance behaviors in automated vehicles compared with novices, and He et al. (2021) found that when presented with surrounding traffic information on an in-vehicle display in an automated vehicle, experienced drivers maintained safer margins (longer minimum gap times) compared with novices, despite exhibiting a higher rate of long (>2 s) glances towards a visual-manual secondary task.
Based on the findings from nonautomated driving studies (e.g., Stahl et al., 2014; Stahl et al., 2019), it is expected that experienced drivers may perform better in monitoring traffic and anticipating upcoming events in automated vehicles. However, the benefit of experience on anticipation may be less pronounced in automated vehicles. As drivers no longer need to control the vehicle continuously when using driving automation, they are expected to have more spare attentional capacity than in nonautomated vehicles. This spare attentional capacity may especially aid anticipation among novice drivers, who are known to have limited spare attentional capacity to perceive on-road hazards in nonautomated vehicles (Jackson et al., 2009). However, drivers may not allocate this additional spare attentional capacity to the driving task. Previous research found that drivers in automated vehicles are more likely to shift their spare attention onto secondary tasks (de Winter et al., 2014; He & Donmez, 2019; Jamson et al., 2013), which can negatively impact their ability to attend to and respond to upcoming traffic events (He & Donmez, 2018; He & Donmez, 2020). The negative effect of a secondary task is expected to be more pronounced among novice drivers, as they were found to engage more in secondary tasks and exhibit riskier glance behaviors compared with experienced drivers in automated vehicles (He & Donmez, 2019).
In this paper, we present a driving simulator experiment to investigate the influence of driving experience and secondary task engagement on anticipation in automated vehicles equipped with ACC and LKA. Participants completed four drives, each with a scenario that enabled anticipation of an upcoming traffic event. For these scenarios, we analyzed glance metrics as well as anticipatory driving behaviors, including proactive control actions prior to an event (i.e., pre-event actions) and preparations for any control actions to change the automation settings or take over control (i.e., pre-event preparations).
Method
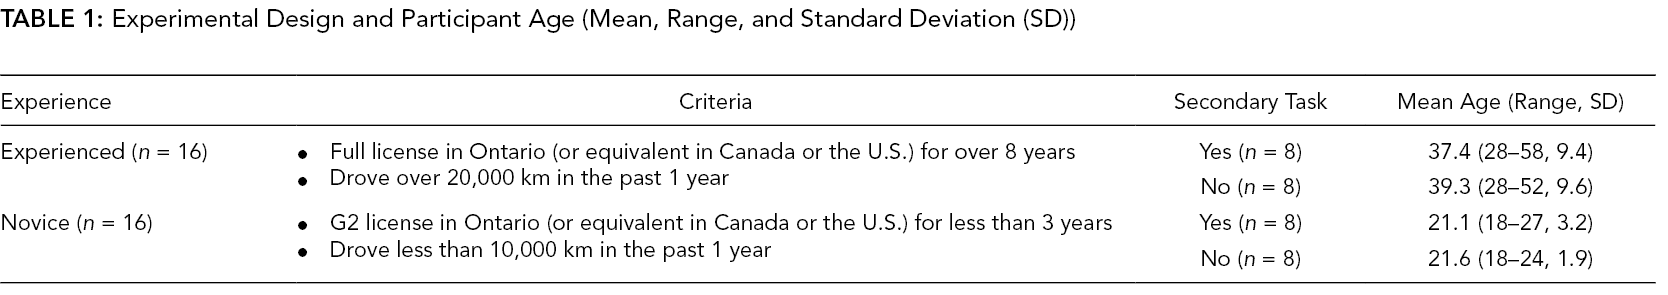
The experiment had a 2 × 2 design, with driving experience (novice or experienced) and secondary task (yes or no) as independent variables, both implemented as between-subjects factors. The criteria for the recruitment of novice and experienced drivers are shown in Table 1 and were based on previous research (He & Donmez, 2020; Stahl et al., 2016). Participants were randomly assigned to a secondary task condition, balanced for gender. Considering that visual-manual distractions are the most detrimental to safety in nonautomated vehicles (Dingus et al., 2016), a primarily visual-manual secondary task was used. Each participant completed four experimental drives in the simulator with both ACC and LKA working simultaneously. Near the end of each drive, there was a scenario where the participant could anticipate an upcoming traffic event based on the behavior of other traffic agents. In this paper, we focus on these anticipatory scenarios. Secondary task engagement and physiological measures recorded throughout the entire drives, and self-reported workload and perceived risk in the drives were reported in He and Donmez (2019).
Experimental Design and Participant Age (Mean, Range, and Standard Deviation (SD))
Overall, our experimental design is the same as the one used in He and Donmez (2020), except that this earlier study investigated driver anticipation in nonautomated vehicles. The driving automation in the current study was designed to be able to navigate all events without intervention from the driver to avoid impacting drivers’ attitudes and/or behaviors in an unrealistic way, as driving automation failures are relatively rare in current production systems (Blanco et al., 2016; Favarò et al., 2017; Teoh & Kidd, 2017). However, in addition to verbal instructions about limitations of ACC and LKA, we introduced an ACC failure event (i.e., abrupt intensive lead vehicle braking that exceeded the ACC capability) in a practice drive so that participants were primed that the automation could fail in this experiment.
Participants
Participants were recruited through online forums or posters around campus or nearby residential areas. A total of 32 participants completed the study. In general, the novice drivers were younger than the experienced drivers (Table 1, F(1, 28) = 42.9, p < .0001), which is to be expected and is representative of the driving population. No significant age difference was found between participants who were randomly assigned to the two secondary task conditions (p = .7). Experienced drivers had a full license for an average of 16.0 years (range: 9–33) with a standard deviation (SD) of 6.8 years, and novice drivers had an average of licensure of 13.8 months (SD: 9.9, range: 0.5–34).
Twenty-six of the participants reported to have never used ACC or LKA systems. One participant reported using the systems several times a week (an experienced driver in the no secondary task condition), and five participants reported using either an ACC or an LKA system less than several times a year (one experienced driver in the secondary task condition, two experienced drivers in the no secondary task condition, one novice driver in the secondary task condition, and one novice driver in the no secondary task condition).
The experiment took about 2.5 hr. Participants were told that they would be compensated at a rate of $14/hr plus a bonus of up to $8 based on their driving performance (all currency reported in CAD). Participants in the secondary task condition were told that the $8 bonus also depended on their secondary task performance, specifically that they would receive $0.20 for each correct answer and lose $0.40 for each incorrect answer. All participants received the full bonus regardless of their performance. The study received approval from the University of Toronto Research Ethics Board (#35560).
Apparatus
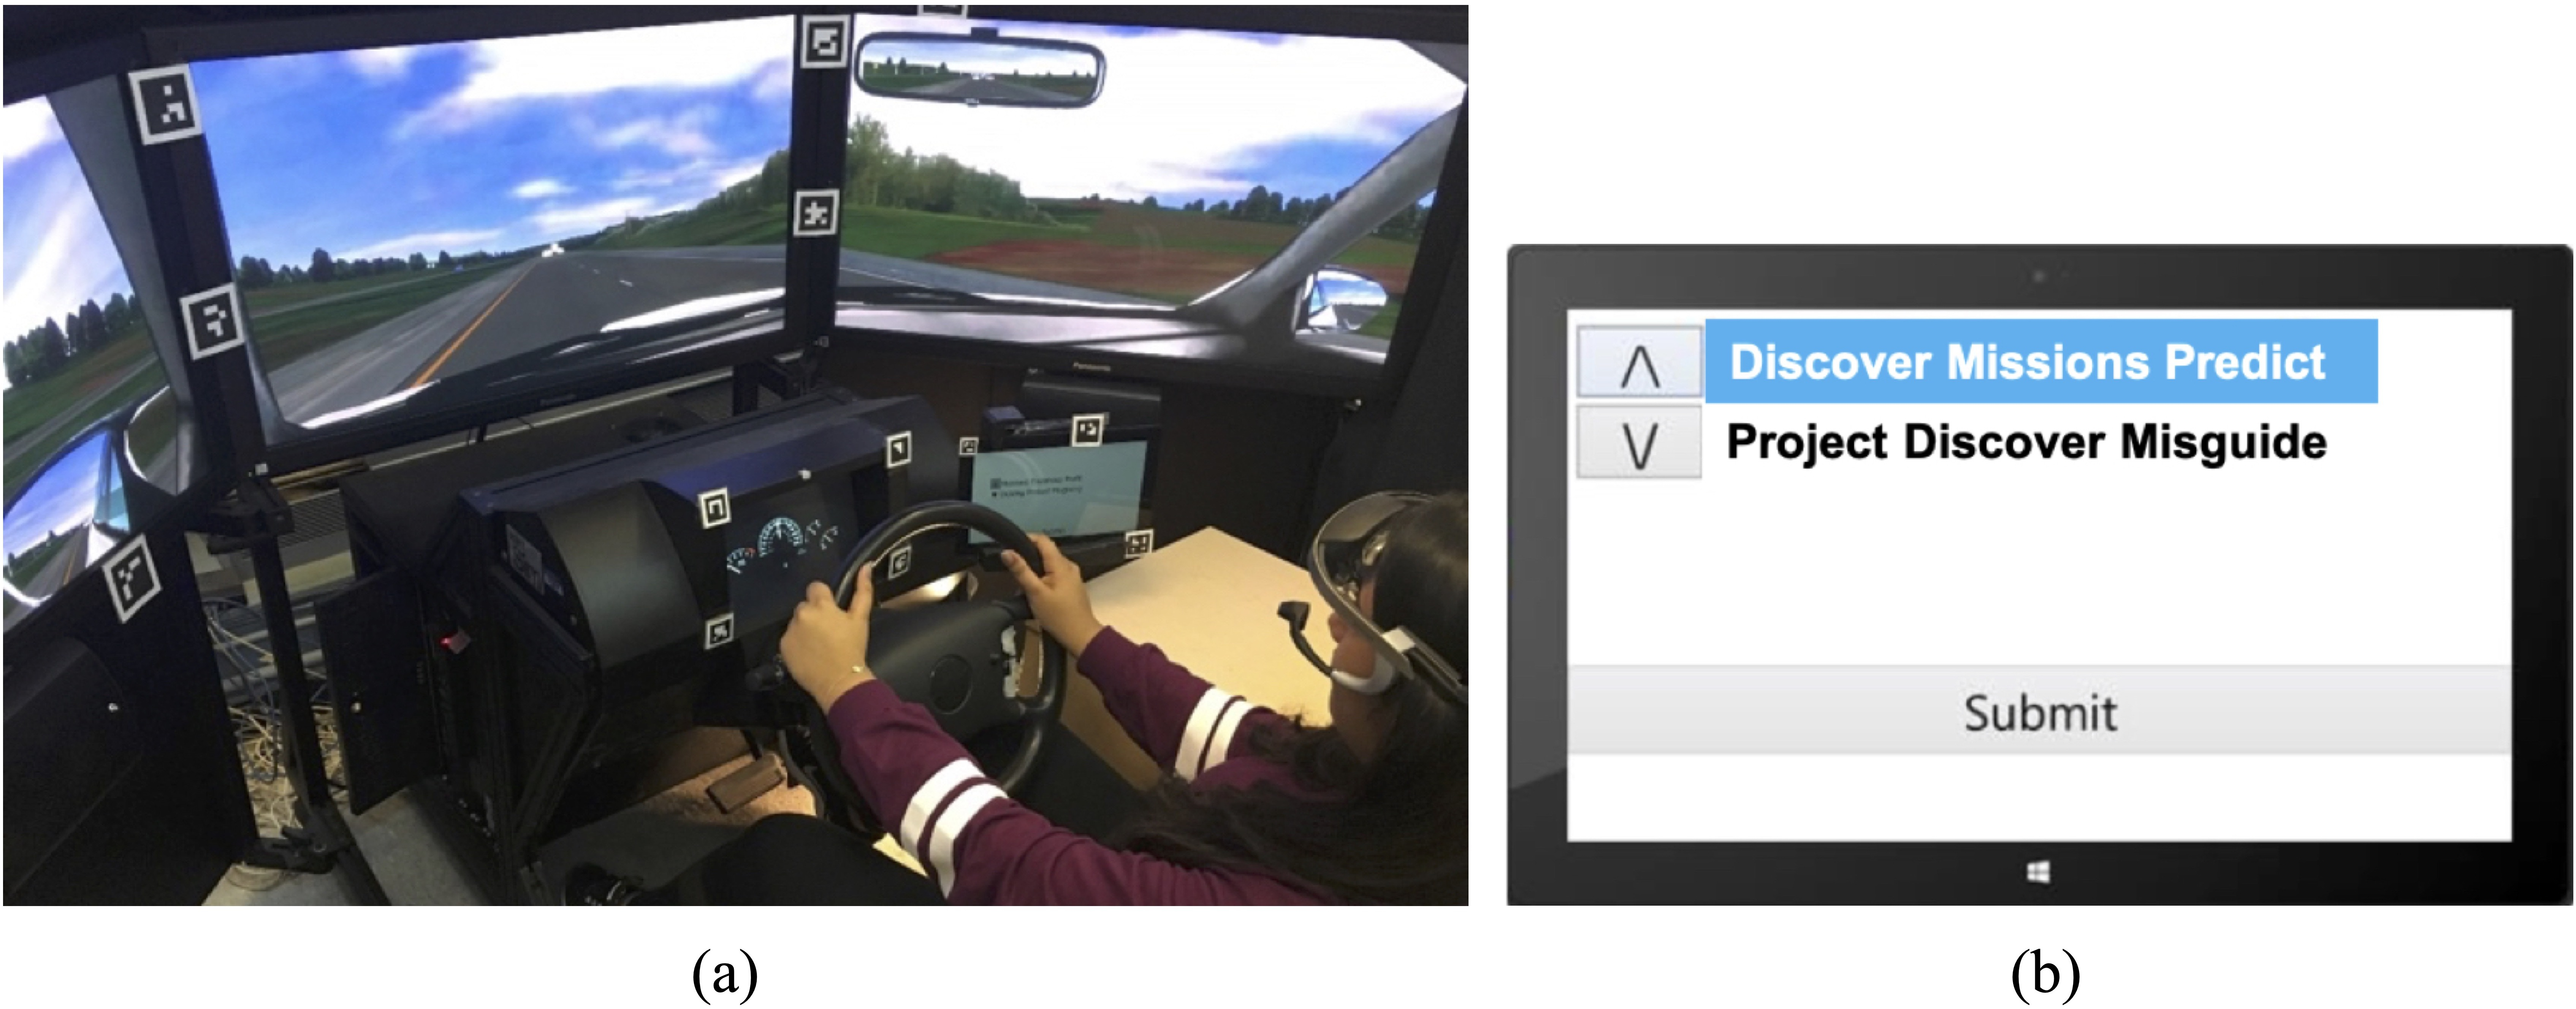
The study was conducted in a MiniSim Driving Simulator by NADS (Figure 1a), which is a fixed-base simulator with three 42-inch screens, creating a 130° horizontal and 24° vertical field at a 48-inch viewing distance, with two speakers for stereo sound and a sub-woofer simulating vibration from the road surface. Both ACC and LKA were implemented, operating simultaneously to simulate SAE Level 2 driving automation (SAE On-Road Automated Vehicle Standards Committee, 2018). The ACC maintained a constant cruise speed (which could be adjusted by the participant using buttons on the steering wheel) for the ego-vehicle and kept a minimum gap time (i.e., distance from back bumper of the lead vehicle to the front bumper of the ego-vehicle divided by the speed of ego-vehicle) to a lead vehicle if a lead vehicle existed and traveled slower than the set speed of the ego-vehicle. The gap time setting was fixed to 2 s for all participants, a value that is commonly recommended for safety consideration in highway driving (Wang & Song, 2009). The LKA controlled the steering to keep the vehicle in the center of the lane. Both ACC and LKA could be engaged and disengaged using buttons on the steering wheel. The ACC could also be disengaged by pressing the brake pedal, and the LKA could also be disengaged by turning the steering wheel over 5°. The driving data (e.g., vehicle speed, brake and accelerator pedal positions, and steering wheel angle) were recorded at 60 Hz.
(
A Surface Pro 2 laptop with a 10.6” touch screen was mounted to the right of the dashboard and presented the secondary task; the screen was off during the no secondary task condition. A Dikablis head-mounted eye-tracking system by Ergoneers was used to record eye movements at 60 Hz. A camera was mounted under the dashboard to record feet movements, and another beside the driver seat to record hand movements.
Secondary Task
The secondary task that was used in the experiment is a visual-manual task that mimics the operations of in-vehicle infotainment systems (e.g., searching for and selecting songs; Figure 1b). This task was developed by Donmez et al. (2007) and has been shown across several studies to degrade driving performance (e.g., Chen et al., 2018; Merrikhpour & Donmez, 2017). Participants scrolled through 10 three-word phrases that looked similar to each other and had to find a phrase that had either “Discover” as its first word, or “Project” as its second word, or “Missions” as its third word (e.g., “Project Discover Misguide” is not a match, whereas “Discover Missions Predict” is). Only two phrases were visible on the screen at a time; participants used up and down arrows to scroll through the 10 phrases. Once participants identified a matching phrase, they had to tap on it and then tap on the submit button. Visual feedback was provided on the correctness of the submission, and then a “start” button appeared on the screen for the participants to initiate a new task. The task was available throughout the whole drive for the secondary task condition, and the participants could decide when to engage in the task and perform it at their own pace. It should be noted that this task is not purely visual-manual. The task is also cognitively demanding to some extent, as participants are required to recall the target phrase and compare it with the ones on the screen. However, it should also be noted that this cognitive component makes the task more realistic, as in-vehicle visual-manual tasks can also be cognitively demanding (e.g., recalling the name of a song while searching for it on the infotainment system display).
Driving Task
Participants were told to drive safely, obey speed limits, maintain a comfortable distance from lead vehicles, and use both ACC and LKA when possible. Each participant completed four experimental drives (~5 min each), two on a rural road with a speed limit of 80.5 km/hr (50 mph), and two on a highway with a speed limit of 96.6 km/hr (60 mph). In each drive, participants experienced a unique scenario that enabled anticipation of an upcoming event (Table 2). The scenarios were adopted from Stahl et al. (2014), He and Donmez (2018 and 2020), and He et al. (2021), and all participants experienced the four scenarios in the same order.
Description of Anticipatory Scenarios Used in the Experiment
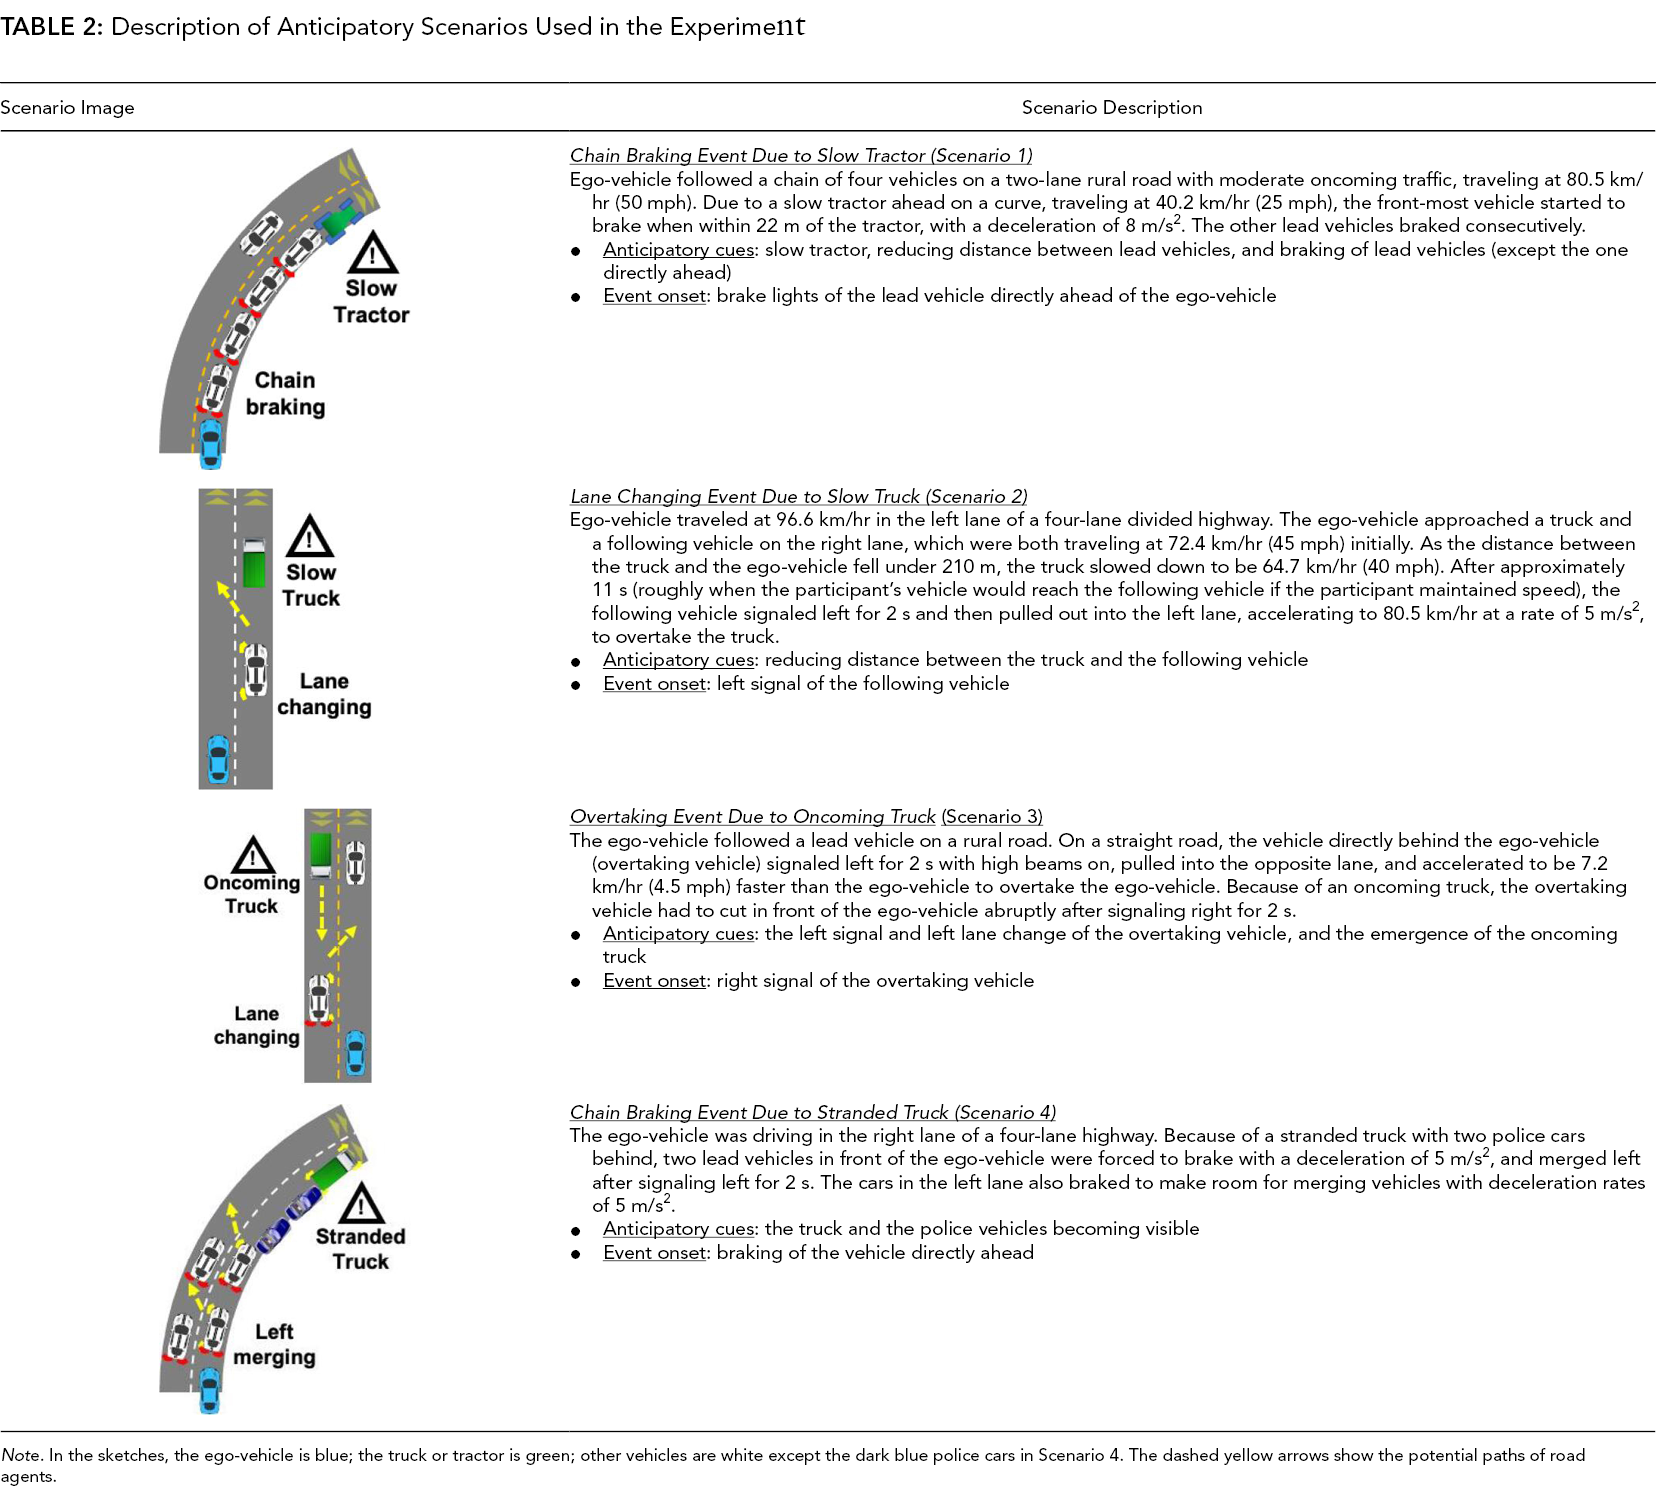
Note. In the sketches, the ego-vehicle is blue; the truck or tractor is green; other vehicles are white except the dark blue police cars in Scenario 4. The dashed yellow arrows show the potential paths of road agents.
The beginning of an event (event onset) in each scenario was marked by an action of a lead or overtaking vehicle that would unambiguously indicate the upcoming event, for example, the onset of the lane changing event in Scenario 2 (Table 2) would be the directional signal of the following vehicle. Prior to the event onset were anticipatory cues that indicated that an event may occur. For example, the diminishing distance between the truck and the following vehicle in Scenario 2 can be considered an anticipatory cue, as it indicates that the following vehicle may move to the left in front of the ego-vehicle. However, the following vehicle may also slow down to move to the left behind the ego-vehicle. Thus, the intent of the following vehicle is not yet clear before event onset. As noted earlier, the automation was able to successfully navigate all traffic events. The participants were told to disengage the automation or adjust the settings (i.e., change ACC set cruise speed) only when necessary and were not informed of the automation’s capability to handle the events in the experiment. In all scenarios, if the driver took no action, the ACC in the ego-vehicle would start to decelerate after event-onset and would safely slow down the vehicle.
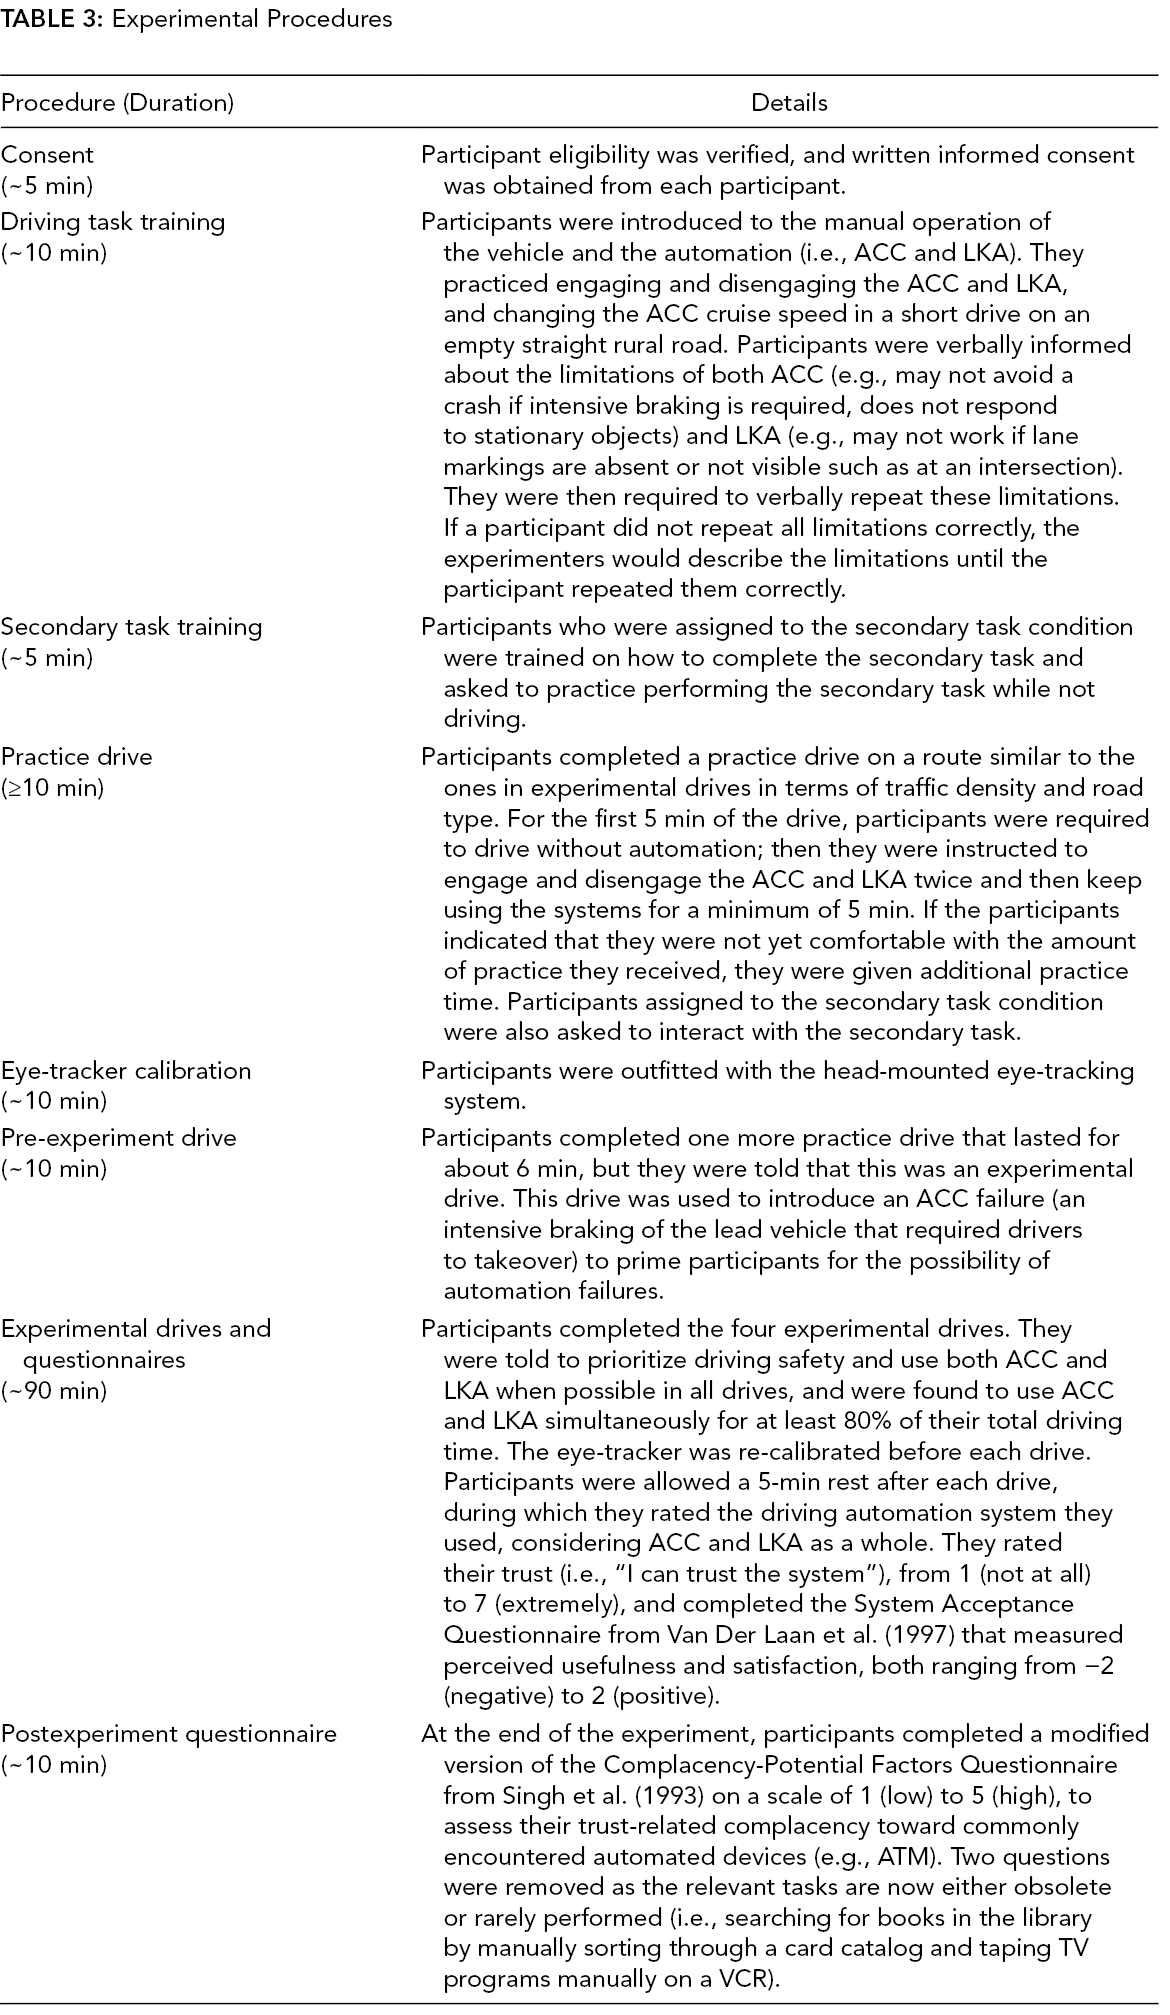
Procedures
Table 3 summarizes experimental procedures.
Experimental Procedures
Dependent Variables and Statistical Models
Three categories of data were analyzed: (1) glance behaviors in the interval from 20 s before the first anticipatory cue to the event onset; (2) anticipatory driving behaviors; (3) subjective responses.
We focused on glances to the anticipatory cues and secondary task display, as these types of glances were found to be associated with anticipatory driving (He & Donmez, 2020). Each glance was defined from the gaze starting to move toward an area of interest (AOI) to it starting to move away from the AOI, following ISO 15007-1:2013(E) (International Organization for Standardization, 2014). Glances that fell partially within a data extraction period were handled following the method in Seppelt et al. (2017) and He and Donmez (2020), for example, if 0.7 s of a 1 s glance fell on the period of interest, then this glance was counted as 0.7 glances. Glances shorter than 100 ms were excluded from the analyses (Crundall & Underwood, 2011; Horrey & Wickens, 2007). Two seconds was used as the threshold for long glances based on crash risk research conducted in nonautomated driving (Klauer et al., 2006). In order to investigate whether drivers’ behavior changed after anticipatory cues became visible (i.e., cue onset), a new independent variable, “cue-onset,” was created. The cue-onset variable divided the data into two periods: before-cue-onset (from 20 s before cue onset to cue onset) and after-cue-onset (from cue onset to event onset or when the automation was disengaged, whichever occurred first). The length of the before-cue-onset period was always 20 s, and the average length of the after-cue-onset periods for Scenarios 1, 2, 3, and 4 was 14.1, 11.0, 12.6, and 8.1 s, respectively, with the SD of 2.4, <.01, 0.9, and 0.6. Table 4 lists the glance measures that are reported in our results section. It should be noted that for the metric “time until first glance at cues” in Table 4, if a participant did not look at any cues, the time until first glance at cues was considered to be the time from the first cue becoming visible to event onset. Other metrics for glances toward the two AOIs, including the mean glance durations and rates of glances, were analyzed but not reported as they did not provide additional insights on driver monitoring; the readers are referred to He (2020) for these additional analysis.
Dependent Variables for Glance Behaviors
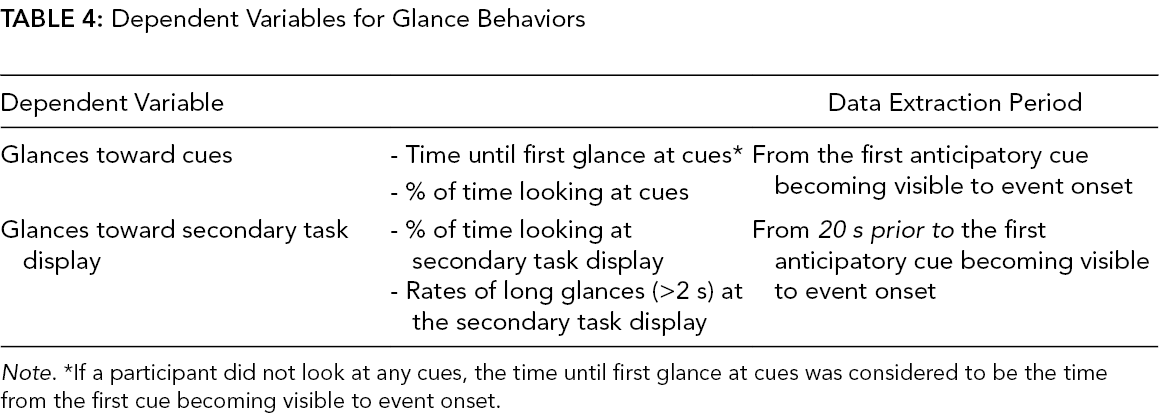
Note. *If a participant did not look at any cues, the time until first glance at cues was considered to be the time from the first cue becoming visible to event onset.
Two types of behaviors were considered anticipatory driving behaviors: pre-event actions (i.e., control actions prior to event onset; He & Donmez, 2018; Stahl et al., 2014) and pre-event preparations (i.e., driver preparations to adjust or disengage the automation prior to event onset). We previously used pre-event actions to assess anticipatory driving in nonautomated vehicles (He & Donmez, 2018; Stahl et al., 2014). However, pre-event actions may not capture all anticipatory behaviors in automated vehicles, in particular when the situation does not require driver takeover as was the case in our scenarios. Thus, it was important to expand earlier operationalizations of anticipatory driving behaviors to include preparations for a control action (i.e., pre-event preparations). The pre-event actions defined for this study were: (1) pressing the brake pedal to decelerate and disengage the ACC, or pressing the buttons on the steering wheel to disengage the ACC or decrease the set cruise speed of ACC in all scenarios; (2) accelerating by pressing the gas pedal or by pressing the buttons on the steering wheel to increase the set cruise speed of ACC in Scenarios 2 and 3; and (3) turning the steering wheel to override the LKA and to change lanes in Scenario 4. Pre-event preparations were defined as any of the following identifiable foot or hand movements to prepare for a pre-event action: moving the foot to the gas or brake pedal, moving hands toward the steering wheel, and hovering fingers above any buttons that control the automation.
Three raters blind to the driving experience level of participants labeled each scenario as having a pre-event action, a pre-event preparation, or no anticipatory behavior. The raters used eye-tracking videos and videos of participants’ feet and hands. To reduce the risk of an unintentional foot or hand movement being labeled as an anticipatory behavior, at least one glance toward the anticipatory cues was required for a pre-event action or preparation. A Fleiss’ Kappa (Fleiss, 1971) of 0.81 (i.e., almost perfect) was reached before conflict resolution, and conflicts in judgment were resolved through discussions.
The binary variables (i.e., the exhibition of anticipatory behaviors) were analyzed using logistic regression. The rate of long (>2 s) glances was modeled using negative binomial regression, with the duration of the data extraction period used as the offset. Repeated measures (i.e., four scenarios by each participant) in these models were accounted for using generalized estimating equations. All other variables were analyzed using repeated measures ANOVAs. All significant (p < .05) and marginally significant (.05 < p < .1) main and interaction effects will be reported in this paper—whether they confirm or disconfirm our hypothesis. The marginal results may reveal patterns in the data that are not conclusive but are potentially informative for future research.
Results
Glance Behaviors
As shown in Table 5 and Figure 2, compared with no secondary task, the secondary task condition was associated with longer time until first glance at cues (mean difference (∆) = 2.7 s, 95% CI: 1.7, 3.7) and lower percentage of time spent looking at cues (∆ = 16%, 95% CI: 8, 24). After cue onset, drivers spent a lower percentage of time looking at the secondary task display (∆ = 12%, 95% CI: 3, 20) and exhibited a 35% (95% CI: 21, 47) lower rate of long glances to the secondary task display.
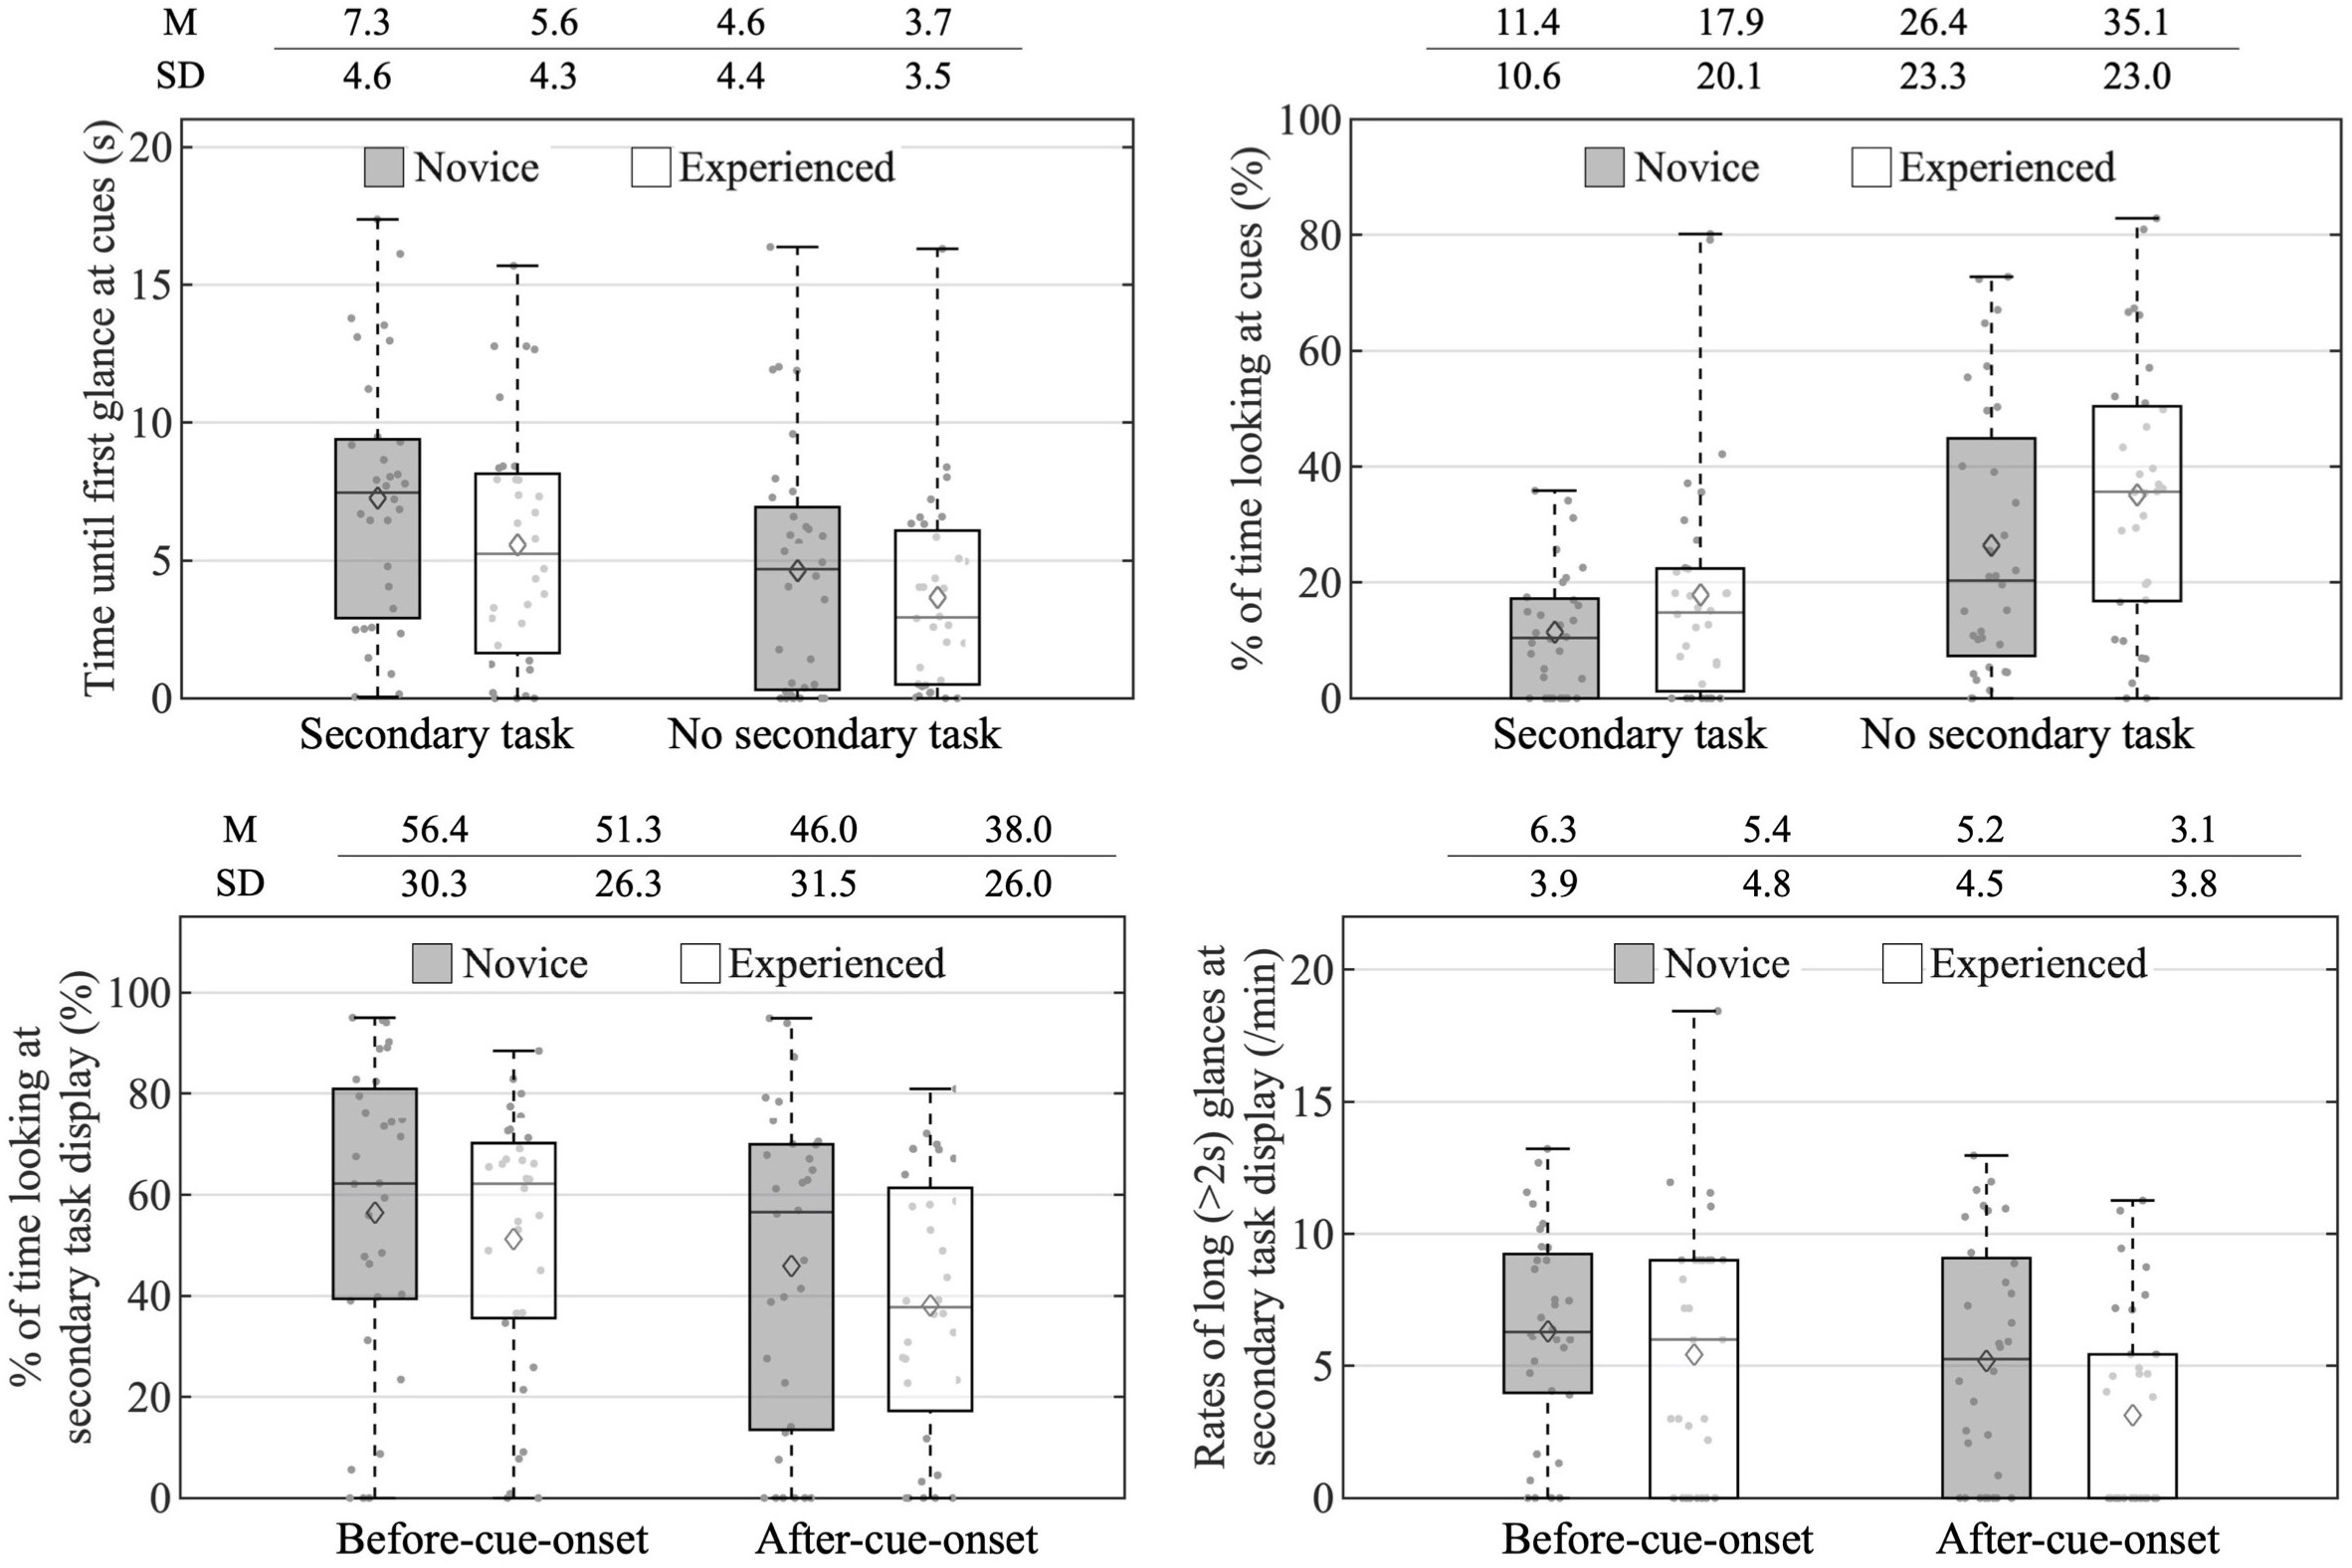
Boxplots of glances at anticipatory cues and the secondary task display. Boxplots present the five-number summary, along with the mean depicted through a hollow diamond. The mean (
Statistical Results for Glance and Anticipatory Driving Behavior Measures
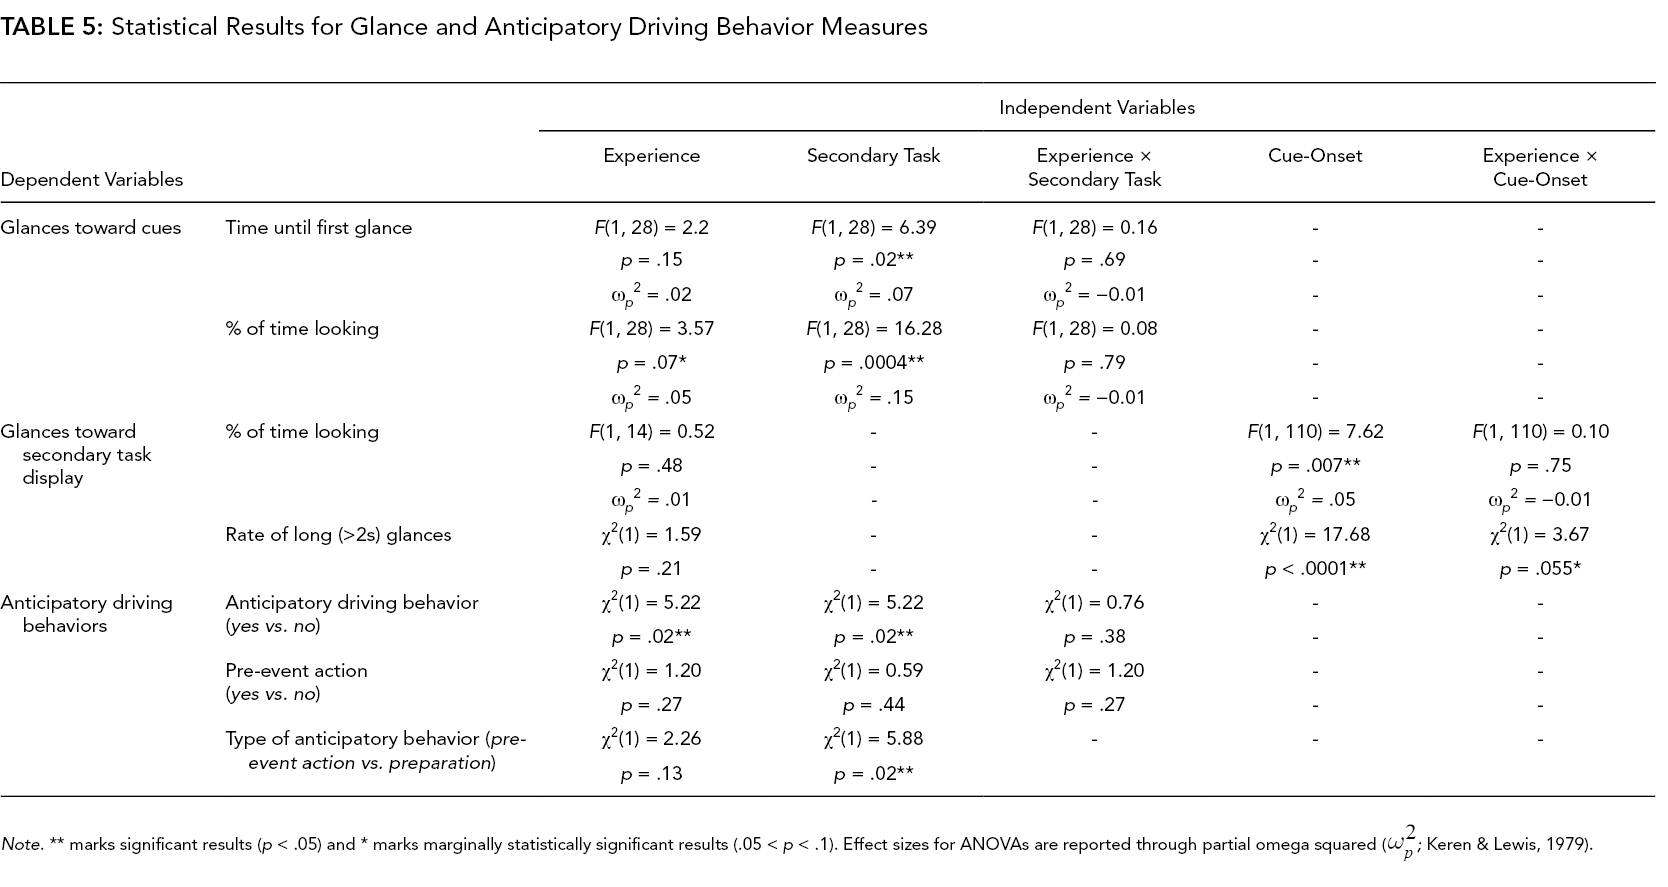
Note. ** marks significant results (p < .05) and * marks marginally statistically significant results (.05 < p < .1). Effect sizes for ANOVAs are reported through partial omega squared (
There were two marginally significant effects (Table 5). A marginally significant effect of experience was observed for percent time looking at cues, with experienced drivers looking at cues for a higher percentage of time (∆ = 8%, 95% CI: −1, 16). Further, the interaction of experience and cue-onset was marginally significant for rates of long glances toward the secondary task: for experienced drivers, the rate of long glances to the secondary task was 47 % lower (95% CI: 27, 61) after cue onset than before, χ2(1) = 15.61, p < .0001, with no significant effect for novice drivers.
Exhibition of Anticipatory Driving Behaviors
Pre-event actions were more common than pre-event preparations (25 pre-event actions compared with 13 pre-event preparations; Figure 3a). Further, two of the 25 pre-event actions (both by experienced drivers, one in the secondary-task and one in the no-secondary-task condition) and eight of the 13 pre-event preparations were hand movements (seven by experienced drivers, with one in the secondary-task and the rest in the no-secondary task condition; one by a novice driver in the no-secondary-task condition); the rest of the pre-event actions and pre-event preparations were foot movements. Twenty-one participants exhibited at least one anticipatory driving behavior across the four scenarios; 11 participants exhibited no anticipatory driving behaviors (Figure 3b).
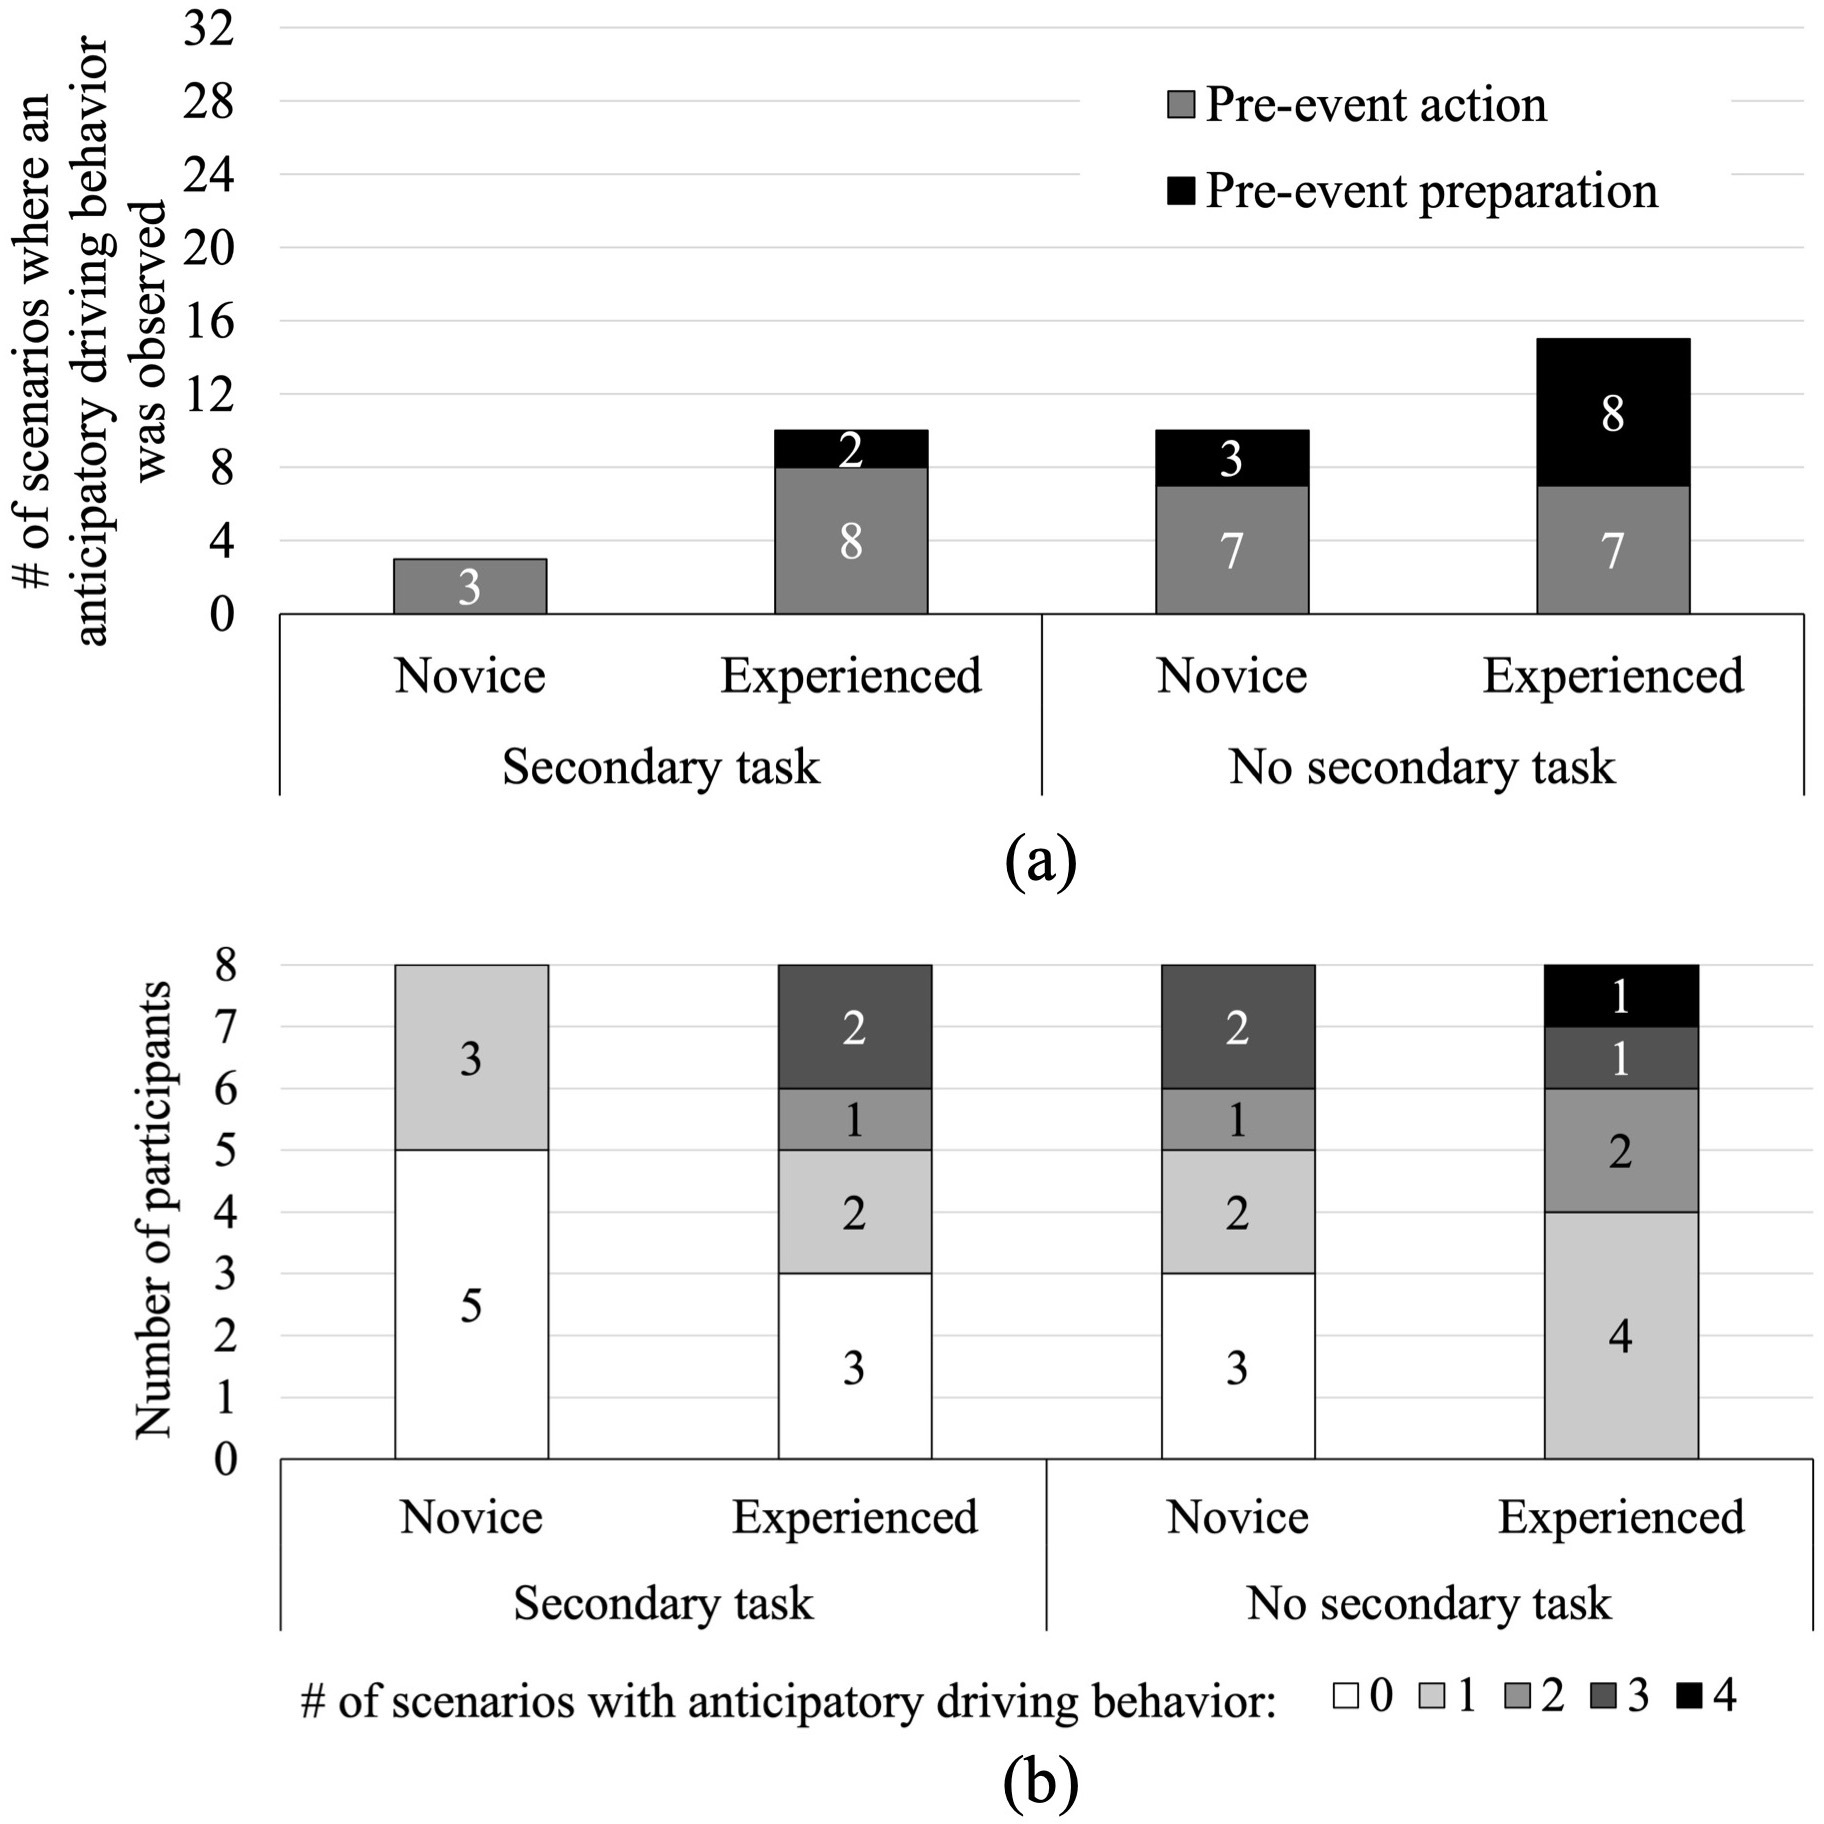
(
Statistical model results are shown in Table 5. Compared with novice drivers, experienced drivers were more likely to exhibit anticipatory driving behaviors (pre-event action or pre-event preparation), with an odds ratio (OR) of 2.92, 95% CI: 1.16, 7.32, and the presence of the secondary task decreased the likelihood of anticipatory driving behaviors, OR = 0.34, 95% CI: 0.14, 0.86. Given that prior anticipatory driving research for nonautomated vehicles (He & Donmez, 2020) focused only on pre-event actions, we conducted additional analysis to focus on the exhibition of just this type of anticipatory behavior for comparison purposes; no significant effects were found. When we analyzed the scenarios where an anticipatory behavior was observed with regard to whether the behavior was a pre-event action or pre-event preparation, we found that drivers in the secondary task condition were more likely to exhibit pre-event actions over pre-event preparation, OR = 5.49, 95% CI: 1.39, 21.71. The experience and secondary task interaction was not estimable for type of anticipatory driving behavior because there were no instances of pre-event preparation for novice drivers in the secondary task condition (Figure 3a).
To visualize the potential influence of experimental condition on drivers’ behaviors, the average timing of participants’ first responses is presented in Figure 4. Some participants exhibited no anticipatory driving behaviors (pre-event actions or pre-event preparations) but responded after event onset. Thus, in addition to the timing of pre-event responses, the timing of postevent responses is also provided in the figure: postevent preparations (driver preparations to adjust or disengage the automation after event onset) and postevent actions (control actions after event onset). Statistical models were not built due to sample size limitations, but inspection of Figure 4 reveals that, in general, experienced drivers exhibited pre-event preparations earlier compared with novice drivers, indicating that the experienced drivers may have been quicker in understanding the anticipatory scenarios compared with novice drivers. Figure 4 also indicates that experienced drivers did not necessarily disengage the automation (i.e., exhibit pre-event actions) earlier compared with novices, potentially because experienced drivers waited to see if the situation would develop as anticipated.
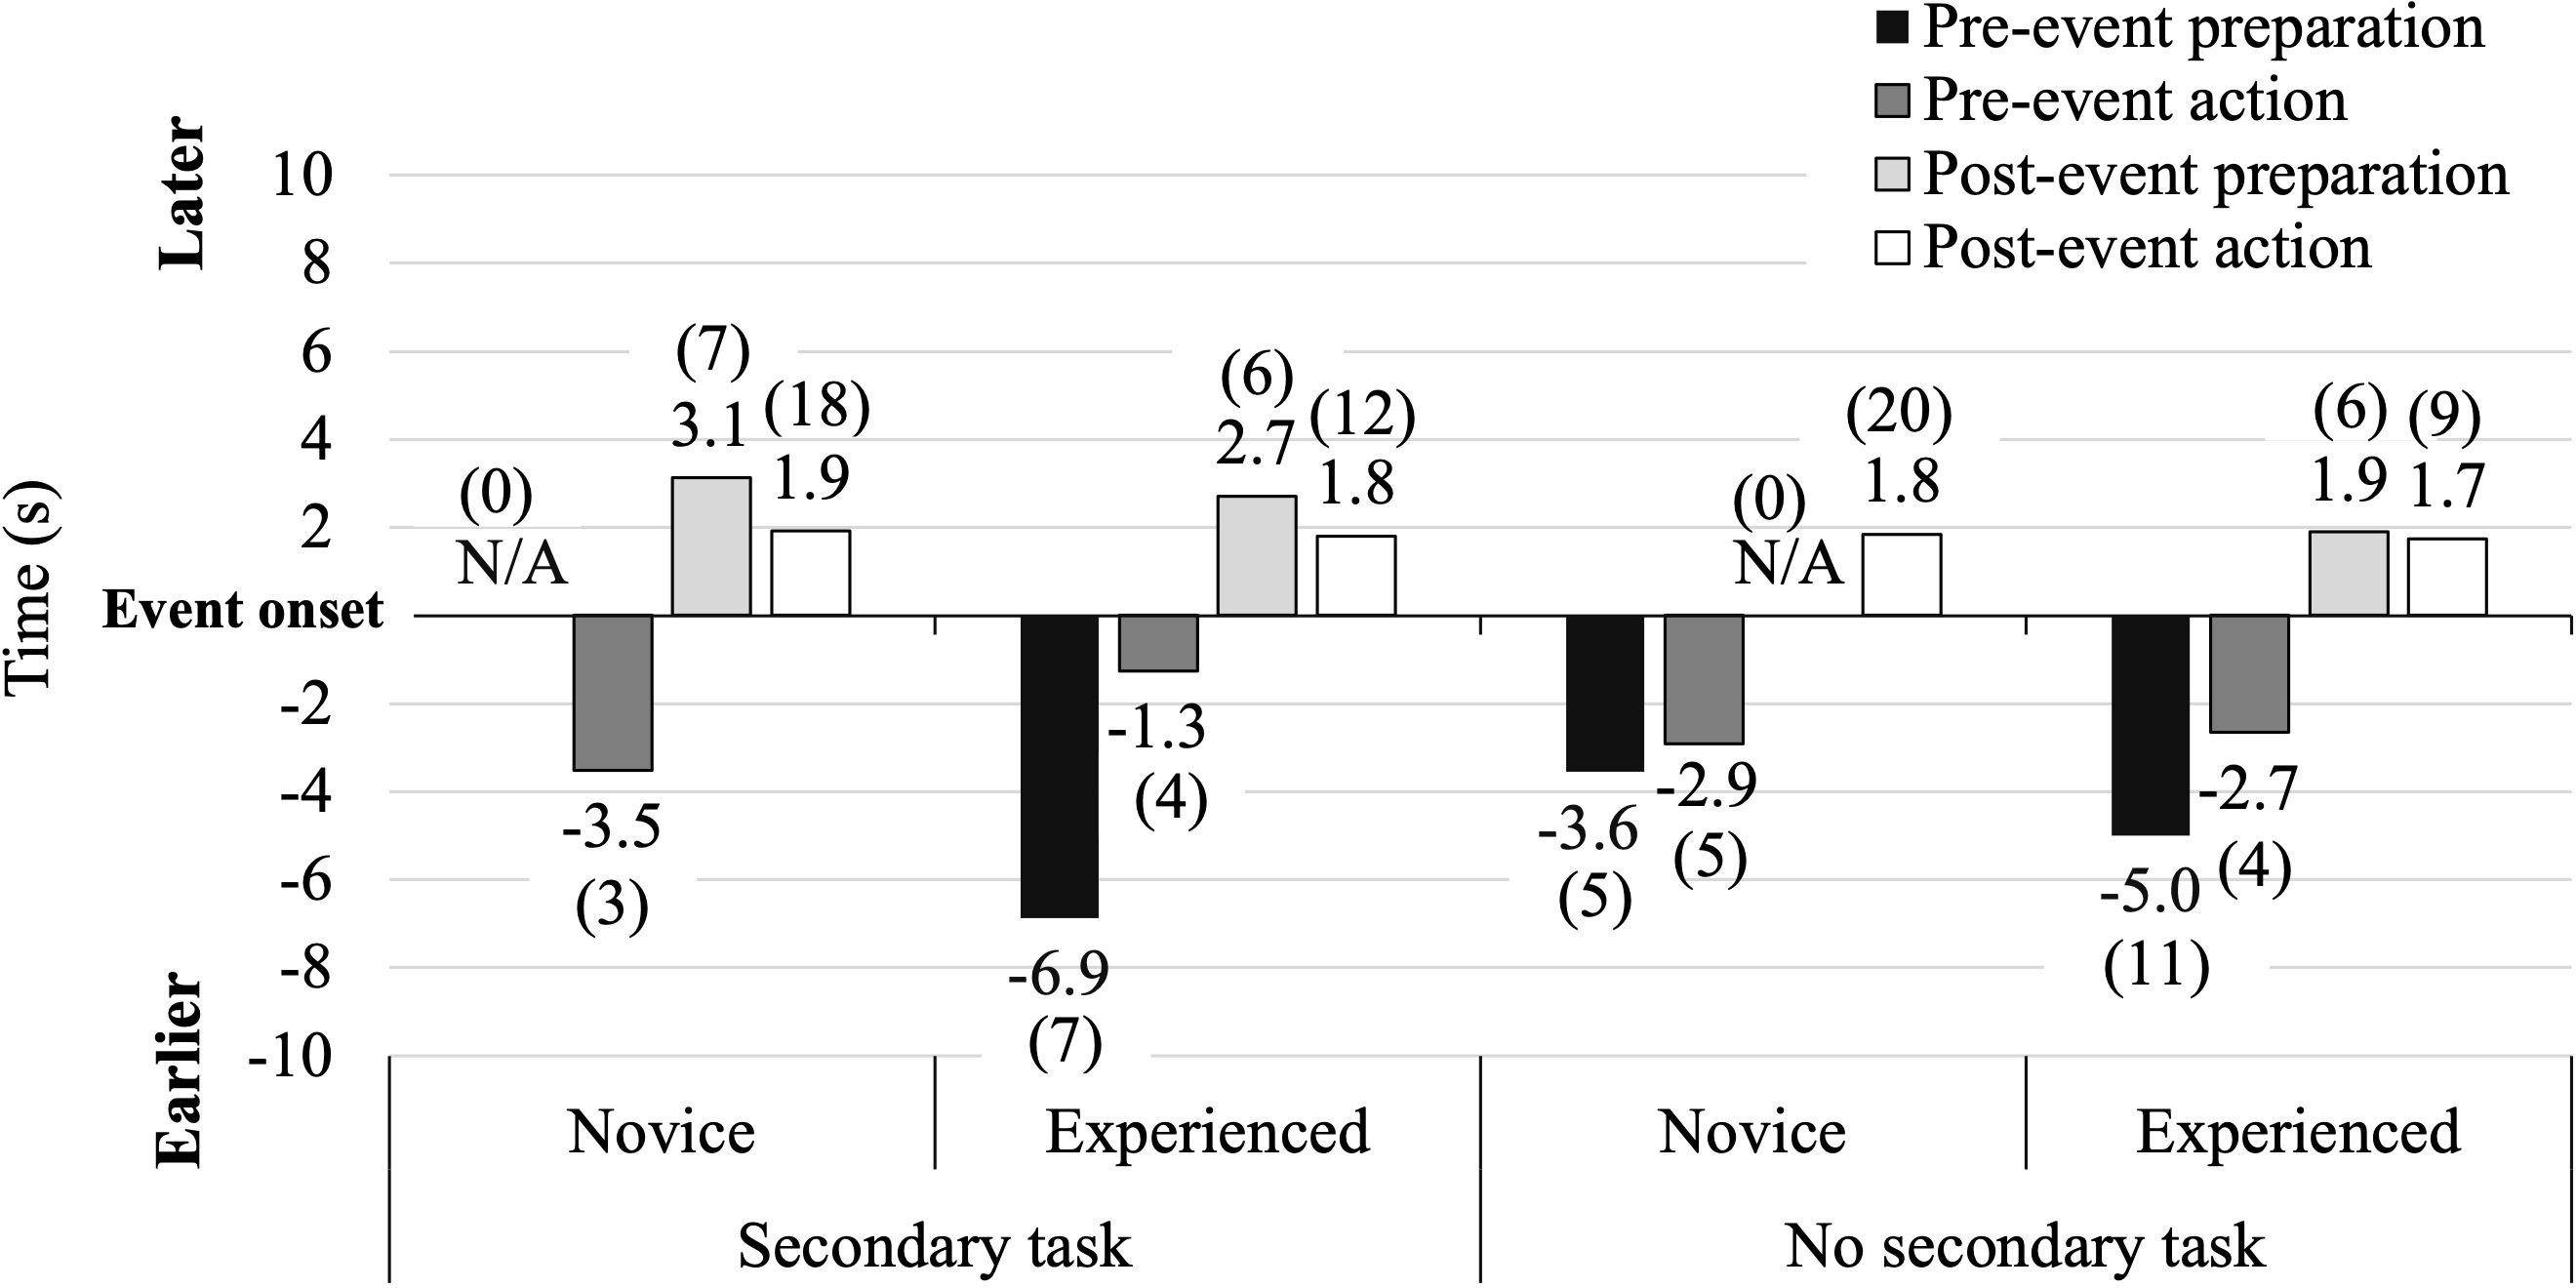
Average timing of participants’ responses relative to event onset in different experimental conditions. If participants exhibited multiple responses (e.g., pre-event preparation followed by postevent action), the timing of the first response was used (pre-event preparation in the example). On the y-axis, event onset corresponds to 0. Negative values represent responses before event onset and positive values represent responses after event onset. Numbers in brackets represent the number of scenarios where each behavior was exhibited as the first response (maximum is 32: 4 scenarios × 8 participants). N/A: timing information not available as there are no responses of the corresponding type.
Relationship Between Glances and Anticipatory Driving Behaviors
To further understand the relationship between glance behaviors and anticipatory driving behaviors, we compared glance metrics between scenarios where anticipatory driving behaviors were observed and where no anticipatory driving behaviors were observed. Admittedly, this analysis may be underpowered given that anticipatory driving behaviors were infrequent under certain conditions (Figure 3).
We observed an interaction effect between the exhibition of anticipatory driving behaviors and cue-onset for percent of time spent looking at the secondary task display, F(1, 109) = 4.13, p = .04,
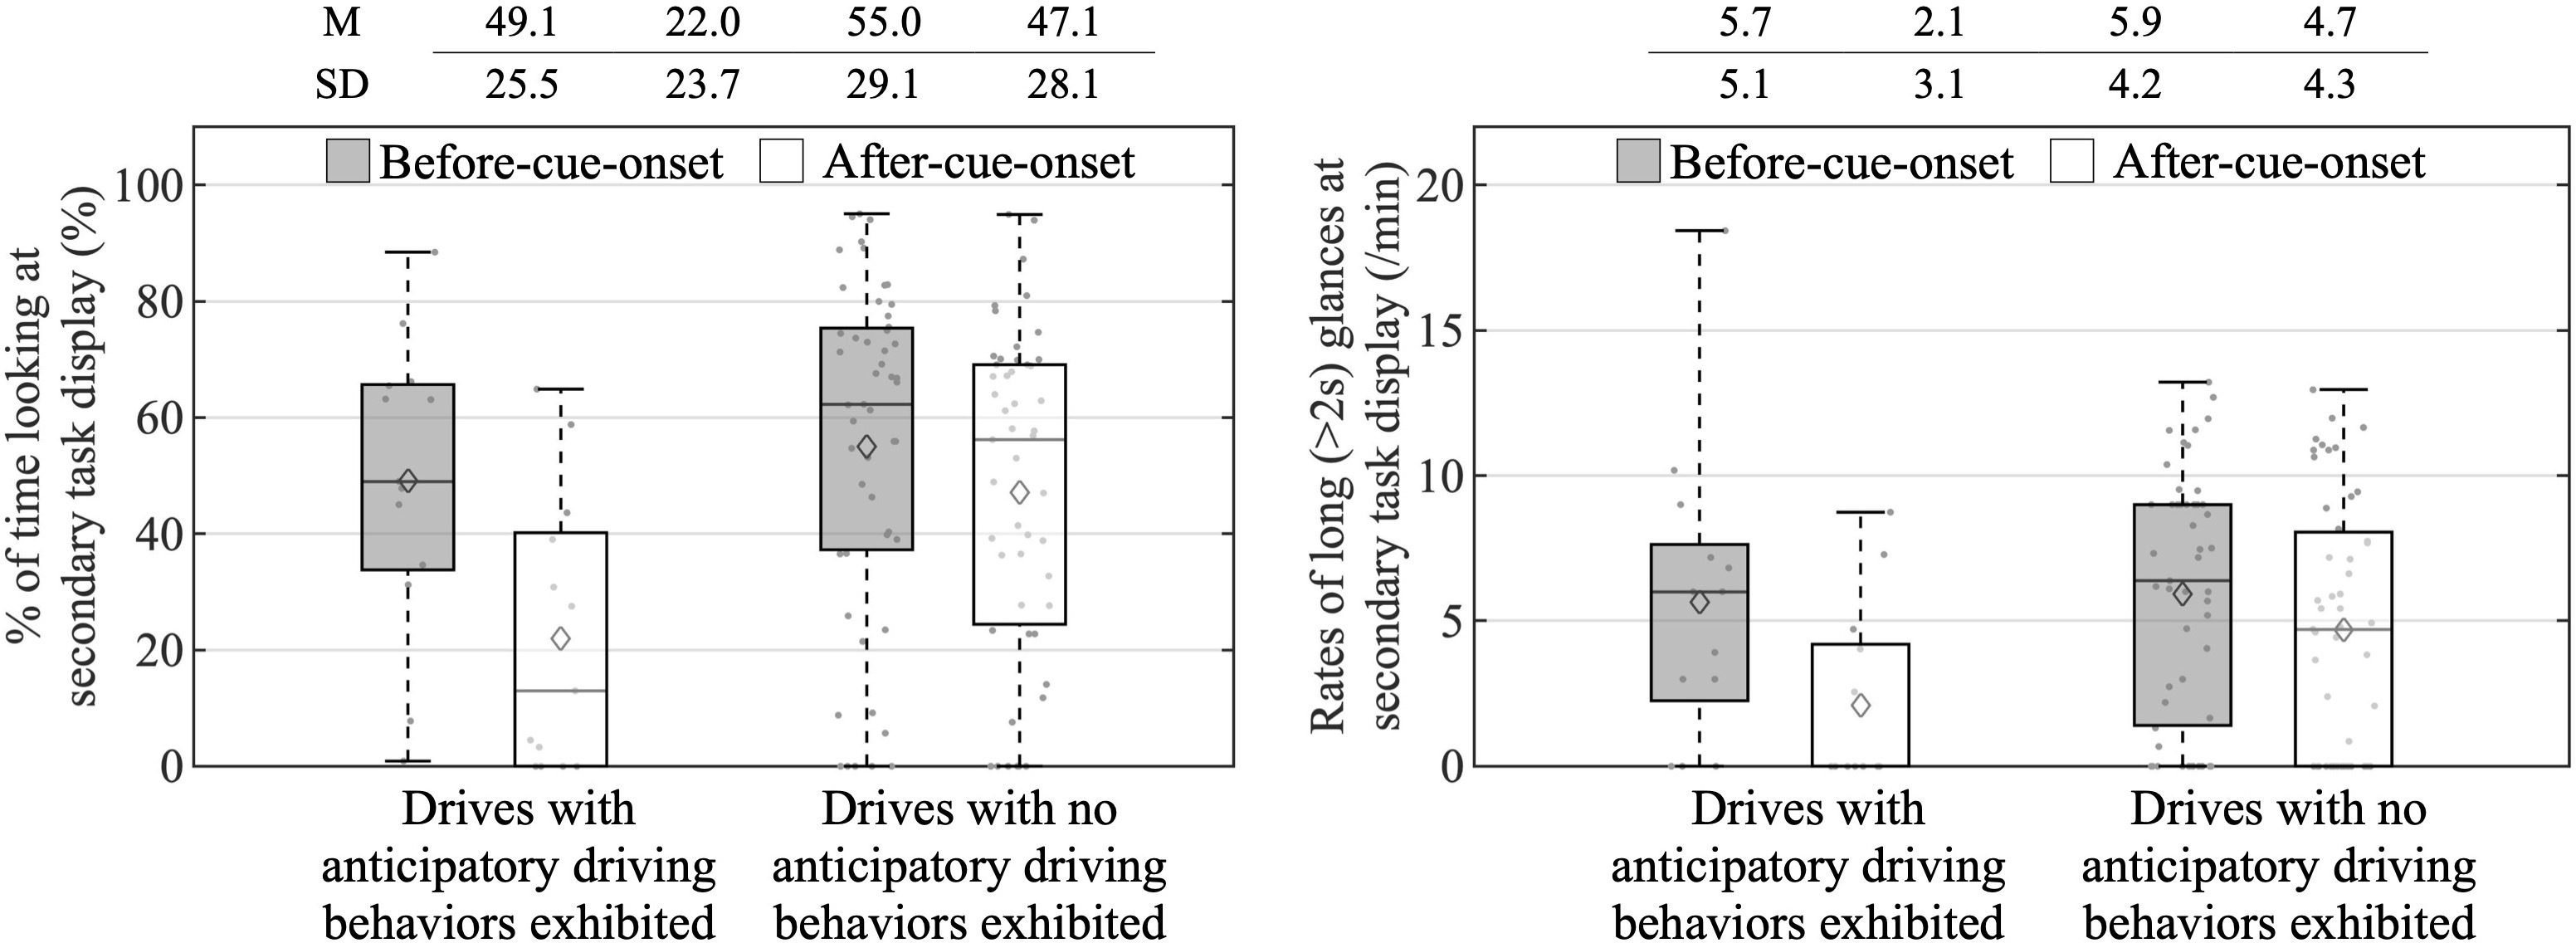
Boxplots of glances at the secondary task display for drives with and without anticipatory driving behaviors, by cue-onset. Boxplots present the five-number summary, along with the mean depicted through a hollow diamond. The mean (
An interaction between exhibition of anticipatory driving behavior and cue-onset was also observed for rates of long glances toward the secondary task display, χ2(1) = 7.24, p = .007 (Figure 5b). Overall, drivers reduced rates of long glances toward the secondary task after cue onset. However, this effect was larger for scenarios where anticipatory driving behaviors were observed (∆ = –60%, 95% CI: –75, –35, χ2(1) = 14.0, p = .0002) compared with scenarios where no anticipatory driving behavior was observed (∆ = –26%, 95% CI: –40, –8, χ2(1) = 7.25, p = .007).
Subjective Ratings
Overall, experienced drivers reported lower trust-related complacency toward commonly encountered automated devices compared with novice drivers, F(1, 28) = 8.33, p = .007, ∆ = −1.00, 95% CI: −1.71, 0.29,
Discussion
Similar to what has been observed for nonautomated vehicles (He & Donmez, 2018; He & Donmez, 2020), in automated vehicles, the presence of a secondary task impaired driver attention to anticipatory cues indicating upcoming traffic events and impeded anticipatory driving behaviors. Drivers in the secondary task condition were more likely to exhibit pre-event actions compared with pre-event preparations only. It is possible that due to their delayed first glance at the cues when the secondary task was present, drivers did not have as much time to assess the situation. As the secondary task claimed more of drivers’ attentional resources, they may have become more conservative in their choice of action.
Overall, drivers in the secondary task condition reduced their visual attention toward the secondary task after cue onset, and this effect was more pronounced in drives with anticipatory driving behaviors. A larger reduction in rates of long glances toward the secondary task display after cue onset was observed in drives with anticipatory behaviors compared with drives without anticipatory driving behaviors. Further, a significant reduction in the percent of time looking at the secondary task display after cue onset was observed in drives with anticipatory driving behaviors but not in drives without anticipatory driving behaviors. These results suggest that anticipation in automated vehicles, with the presence of a secondary task, may be influenced by drivers’ ability to manage their distraction engagement. It may also be possible that anticipatory drivers are better at adjusting their attention allocation, as they are more aware of the potential development of traffic.
Driving experience, as opposed to what has been observed in nonautomated vehicles (He & Donmez, 2018, He & Donmez, 2020; Stahl et al., 2019), was not observed to enhance driver attention to anticipatory cues in automated vehicles, except for a marginally significant effect (percent time looking at cues was marginally significantly higher for experienced drivers). The effect of experience on visual attention to cues in nonautomated vehicles may be due to the differences in manual control skill. Novice drivers are less skilled in handling nonautomated vehicles compared with experienced drivers (Bjørnskau & Sagberg, 2005) and therefore may focus more of their cognitive resources on executing the manual control of the vehicle. Manually controlling the vehicle is less effortful for experienced drivers, giving them more spare attentional capacity to attend to anticipatory cues. In automated vehicles, however, as automation frees up drivers from manually controlling the vehicle, both novice and experienced drivers may have a similar level of spare attentional capacity to monitor the road.
While experienced and novice drivers attended to the anticipatory cues to a similar extent, experienced drivers may still be better at interpreting these cues to anticipate upcoming traffic events as we found experienced drivers to be more likely to exhibit anticipatory driving behaviors. Jackson et al. (2009) similarly suggested that experienced drivers are better able to interpret cues to predict road hazards. In the current study, a marginally statistically significant effect was found with experienced drivers reducing their rates of long glances to the secondary task display after the appearance of anticipatory cues while novices did not. Further, visual inspection of the data indicates that when the average timing of pre-event preparations is compared across drivers who exhibited pre-event preparations, experienced drivers’ responses were earlier than novices. Thus, compared with novices, experienced drivers may have been better at anticipating the upcoming events based on the cues and adjusting their attention allocation accordingly. However, a larger sample size is needed to further test these marginally significant effects, which are smaller in effect size.
Trust in automation may also have influenced experienced drivers’ anticipatory behaviors. We did not find a relationship between drivers’ trust in the driving automation systems and whether they exhibited anticipatory driving behaviors. However, considering that drivers in our experiment had limited experience with the driving automation systems both in the experiment and in their daily life, their initial trust in and reliance on the systems might be based on their attitudes toward automation in general (Lee & See, 2004; Lee & Kolodge, 2020). Experienced drivers reported lower trust-related complacency toward commonly encountered automated devices compared with novices, which might in part explain their higher likelihood of taking over or preparing to take over from the automation prior to an event. Further, as mentioned previously, experienced drivers made fewer long glances to the secondary task after anticipatory cues appeared, a result that approached significance, suggesting that their lower trust may have led to lower reliance on automation before traffic events; lower secondary task engagement has been used as an indicator of lower reliance on driving automation (Körber et al., 2018). However, research with larger samples is needed to further explore the relationship between trust, anticipation, and reliance in automated vehicles.
In summary, the findings from this study provide new insights on the role of driving experience and secondary task engagement in automated vehicles. Previous research showed that driving experience impacts drivers’ behaviors at the operational level in automated vehicles (e.g., speed control; Young & Stanton, 2007). Our research extends this finding by investigating the influence of driving experience and the presence of a secondary task on drivers’ behaviors at the tactical level (i.e., the anticipation of upcoming traffic events). Engagement in a secondary task was found to impede anticipation, which can in turn lead to safety degradations. Adaptive interfaces that limit the availability of secondary tasks based on an estimation of driving demands may help improve driving safety in automated vehicles (DeGuzman et al., in press). For example, connected vehicle technology can be leveraged to gain information about traffic situations ahead that may require driver action. If such a situation is detected, the system can lock in-vehicle interfaces to reduce distraction. Driving experience was found to facilitate anticipation, potentially because experienced drivers are better able to interpret cues in the environment that indicate upcoming traffic events. Thus, training or in-vehicle interfaces that aim to improve drivers’ ability to identify and interpret cues in the environment may improve driving safety in automated vehicles by facilitating anticipation. For example, similar to what has been proposed in nonautomated vehicles (e.g., Stahl et al., 2016; Unverricht et al., 2018), interfaces for automated vehicles could direct drivers’ attention to potential hazards and/or anticipatory cues (He et al., 2021).
It is important to reiterate that in all of our scenarios, the automation could handle the event without intervention from the driver. Thus, it is possible that some drivers could have anticipated the upcoming events but chose not to disengage the automation or prepare to take an action. These drivers may be those who have higher trust in and reliance on the automation. Future research can try to identify anticipatory but nonreactive drivers by incorporating additional measures (e.g., postexperiment questionnaires regarding understanding of the scenarios). Further, we used a limited range of scenarios, and in these scenarios a change of speed was always an appropriate response, whereas steering was appropriate only in one scenario. Thus, it is not surprising that most of the anticipatory driving behaviors were foot movements, as drivers are likely more inclined to accelerate or decelerate using the gas and brake pedals than changing the automation setting via the steering wheel buttons. Future research may explore a wider variety of scenarios, for example, scenarios where swerving or changing lanes would be a better choice compared with a change of speed, to assess whether similar results are found in scenarios where hand movements are preferred. Each participant experienced one automation failure in the practice drive in order to prime them for automation failures. In reality, drivers would have different levels of exposure to automation failures, which may lead to varied responses. Future research should consider varying the amount and type of exposure to automation failures (e.g., firsthand experience or verbal instruction), as how failures are experienced can determine drivers’ trust and reliance on the automation (Beggiato & Krems, 2013). Lastly, in the current experiment, the automation could handle potential traffic conflicts without driver intervention. Driver behaviors might differ in more critical situations where driver intervention is necessary to avoid a collision (Eriksson & Stanton, 2017), and thus future studies need to investigate anticipatory driving behaviors in such critical situations.
Key Points
In a simulated automated vehicle, the presence of a visual-manual secondary task was associated with a lower percentage of time looking at anticipatory cues that indicated an upcoming traffic event and a longer time to first glance at these cues, as well as a lower likelihood of exhibiting anticipatory driving behaviors.
Experienced drivers exhibited more anticipatory driving behaviors than novice drivers; however, they were not found to allocate more visual attention toward anticipatory cues suggesting that they may have been more effective in interpreting these cues.
In scenarios where an anticipatory driving behavior was observed, drivers spent a lower percent of time looking at the secondary task compared with scenarios where no anticipatory driving behaviors were observed. There appears to be a relation between reliance on automation and anticipatory driving.
Footnotes
Acknowledgments
The funding for this study was provided by a Natural Sciences and Engineering Research Council of Canada (NSERC) Discovery Grant (RGPIN-2016-05580). We gratefully acknowledge Wenyi Peng, Songhui Xu, Meining Ji, and David Dongsoon Min for their help in data processing.
Author Biographies
Dengbo He is a postdoctoral fellow at the University of Toronto, Department of Mechanical & Industrial Engineering. He received his PhD in mechanical and industrial engineering from the University of Toronto in 2020.
Chelsea A. DeGuzman is a PhD student at the University of Toronto, Department of Mechanical & Industrial Engineering. She received her MASc in mechanical and industrial engineering from the University of Toronto in 2017.
Birsen Donmez is a professor at the University of Toronto, Department of Mechanical & Industrial Engineering, and is the NSERC Canada Research Chair in Human Factors and Transportation. She received her PhD in industrial engineering from the University of Iowa in 2007.