
Abstract
The current approaches to explaining black box machine learning models have primarily been based on the intuition of model developers, rather than being informed by end-user needs or existing literature. Our goal is to utilize existing cognitive science and human factors research to design explanation displays. To achieve this, we used the Cleveland Heart Disease Data Set to create an eXtreme Gradient Boosting heart disease prediction model. We established an initial context of use to inform the design of a prototype explanation display. Our design choices were based on cognitive chunk organization, and we used SHapley Additive exPlanation to generate instance-level explanations for our model. Model evaluation showed good performance, and we developed four prototype explanation displays. Our work demonstrates that it is feasible to design multiple prototype explanation displays for complex machine learning models by organizing features in a structured manner. We also provide a set of steps that can be followed for designing and evaluating user-centered explanations in healthcare.
Keywords
Introduction
Machine learning (ML), a subset of artificial intelligence (AI), continues to gain traction in various fields of medicine (Beam & Kohane, 2018). However, advances in ML have involved black box models whose algorithms do not provide human-understandable explanations in support of their decisions (Panigutti et al., 2020). The field of eXplainable AI (XAI) aims to address this problem by providing visibility into how black-box ML models make predictions (Rai, 2020).
Context of Use of Explainable ML
The context of use for a product or system, which consists of users, user needs and environment in which it is used (Maguire, 2001), determines its usability (Harvey et al., 2011). For explainable ML to be effective, it is crucial to identify the intended context of use, that is, who the users are, why these users require explanations, and where these users will use the explanations (Barda et al., 2020). Explainable ML users may be characterized based on their expertise, functional role (Bhatt et al., 2020), and knowledge and the contexts in which knowledge manifest (Suresh et al., 2021). User needs may be distilled into high-level domain goals (e.g., building trust in the model) and low-level specific tasks (e.g., assessing reliability of a given prediction) (Suresh et al., 2021). Depending on users and their needs, explanations may be designed to explain the decisions of the machine learning (ML) model at the local or global level. Model explanations should be defined by how much they augment users’ abilities to complete various tasks.
Explainability Techniques for Complex ML Models
Techniques to develop explanations may be categorized as either intrinsic or post-hoc (Arrieta et al., 2019; Rudin, 2019). Intrinsic models (e.g., decision trees, linear and logistic regression models) are inherently interpretable (Rudin, 2019). Post-hoc methods use outputs of trained complex ML models (e.g., tree ensembles, support vector machines, neural networks) to explain why certain predictions are made (Arrieta et al., 2019). Post-hoc methods may be applicable to all types of models (i.e., model-agnostic) or certain model types (i.e., model-specific) (Arrieta et al., 2019). Further, these methods may aim to explain a single prediction (i.e., local) or the entire model (i.e., global) (Belle & Papantonis, 2021).
Various methods, including feature relevance explanation, visual explanation, and local explanation, have been proposed to produce post-hoc explanations from black box ML models (Arrieta et al., 2019; Belle & Papantonis, 2021). These methods explain a model’s decision by ranking the relevance of each input feature (Arrieta et al., 2019). Locally Interpretable Model-agnostic Explanations (LIME; (Ribeiro et al., 2016)) and SHapley Additive exPlanations (SHAP; (Lundberg & Lee, 2017)) are two popular feature relevance explanation techniques. Whereas LIME trains local surrogate models to explain individual predictions SHAP unifies several local explanation methods into a single approach to explain model predictions (Molnar, 2018).
Related Studies
Prior studies have utilized several approaches to explain predictions of complex ML models in the health care domain (Lundberg et al., 2018; Pan et al., 2019). For example, Lundberg et al. (2018) developed an explainable ML system using SHAP to enable anesthesiologists predict hypoxemia risk during general anesthesia. Pan et al. (2019) used LIME to develop a predictive model to diagnose central precocious puberty.
While previous studies have explored alternative approaches to model explanation, most have not been informed by end-user needs and insights from the literature (Abdul et al., 2018; T. Miller, 2019). XAI developers can build on existing research in cognitive science and human-computer interaction to design effective explanations that are interpretable for users (T. Miller, 2019).
Cognitive Chunks
Of particular interest in the present study is how cognitive chunks are organized. Chunking is a process by which humans break down and group information into a meaningful whole (G. A. Miller, 1956). A chunk represents an organizational unit in the short-term memory of humans. Factors that correspond to explanation needs and thus may influence the presentation of an explanation include (1) the form of cognitive chunks, (2) the number of cognitive chunks, (3) how the cognitive chunks are organized, and (4) interaction among cognitive chunks (Doshi-Velez & Kim, 2017). Organizing chunks into meaningful groups can potentially reduce cognitive load and processing time.
Objective
Humans typically seek for explanations of events that they find abnormal, and prefer those that reveal causes that are abnormal or controllable (T. Miller, 2019). The term abnormality concerns the ability to identify abnormal events (T. Miller, 2019), while controllability concerns the extent to which an event can be altered (Girotto et al., 1991). Grouping factors by abnormality and controllability can help provide a causal explanation of an event (T. Miller, 2019).
Our objective is to leverage the organization of cognitive chunks to design prototype explanation displays for a heart disease prediction model. In this study, an explanation display refers to the graphical interface designed to help users understand the contribution of each feature to the prediction of an instance made by the model.
Methodology
The Cleveland Heart Disease Data Set
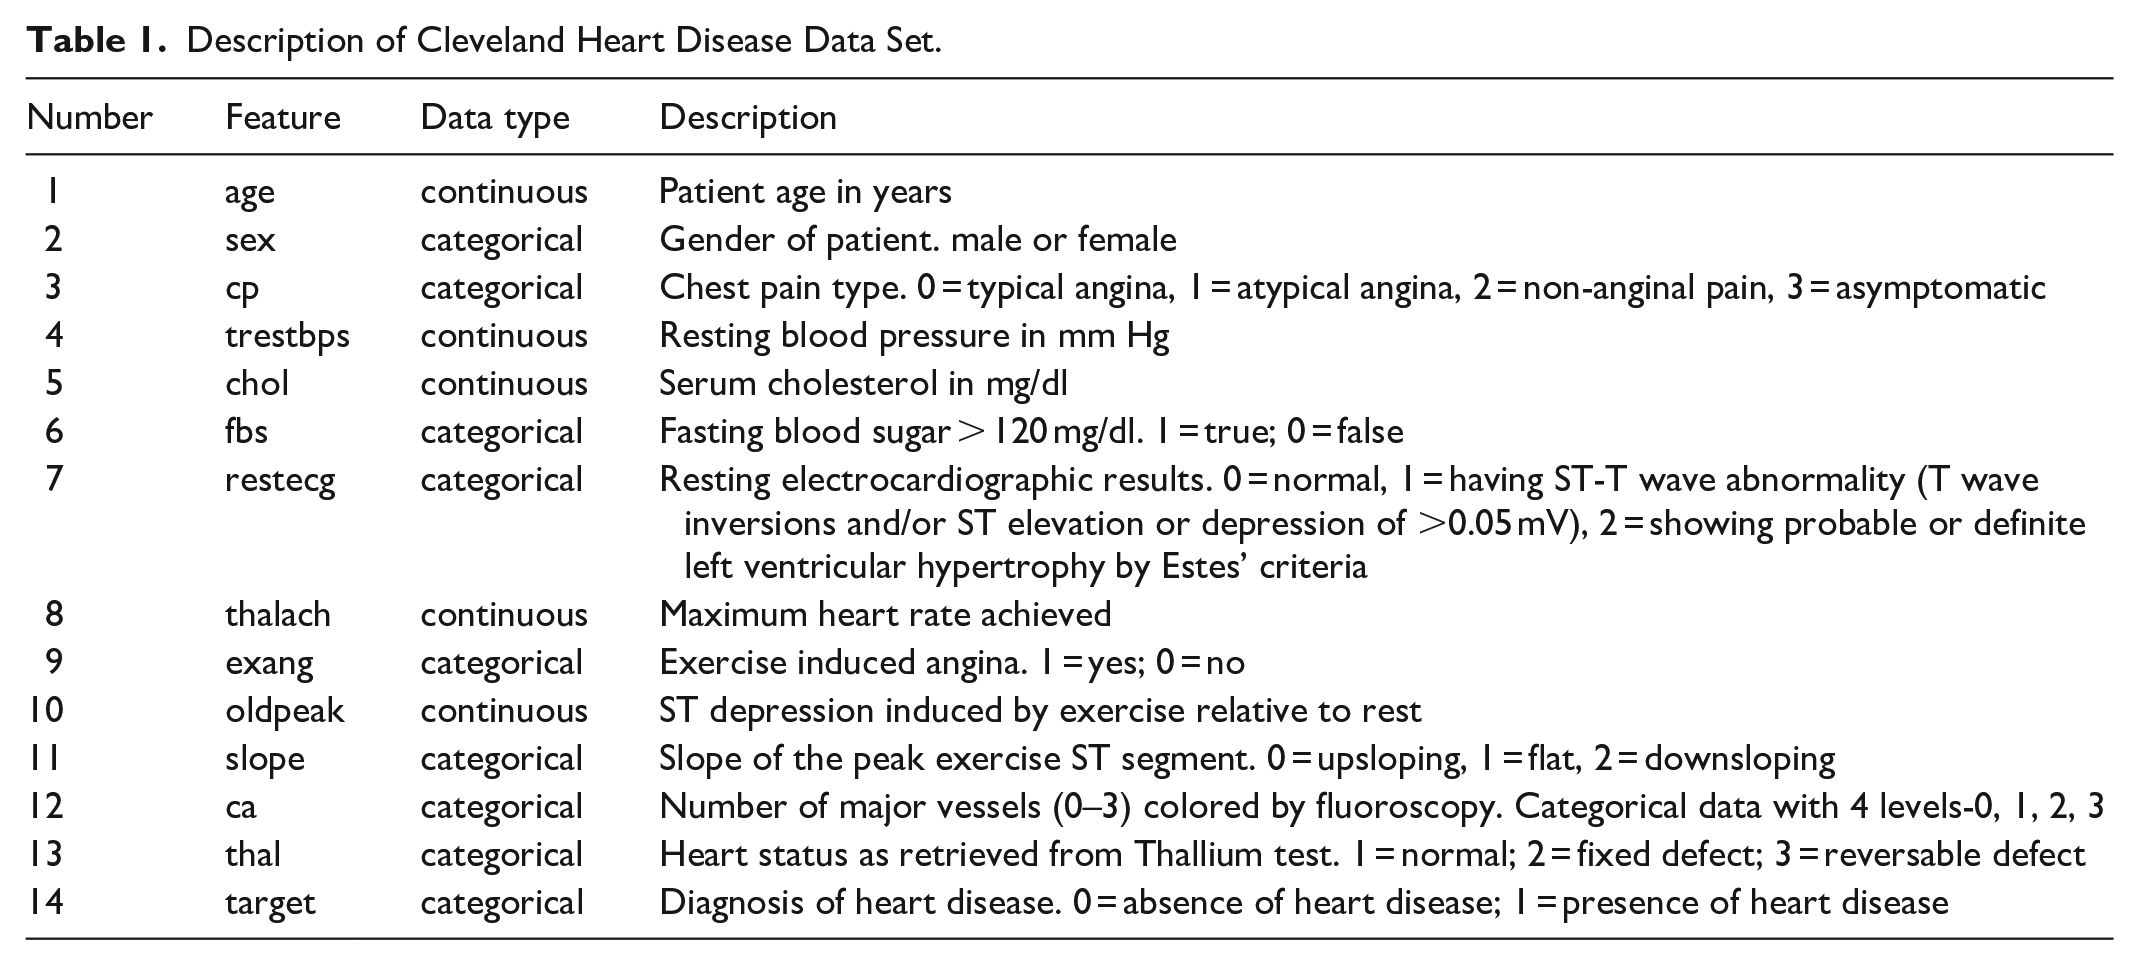
We utilized the Cleveland Heart Disease Data Set (Aha & Kibler, 1988) available on the Kaggle website (Heart Disease UCI, n.d.). This data set contains 303 instances. Although the data set has 76 features, majority of the published studies use only 14 of them. We used these 14 features as described in Table 1. We predicted whether a person has heart disease or not based on first 13 features. Since our main aim was to design user-centered explanation displays, we made no attempt to learn a best performing model.
Description of Cleveland Heart Disease Data Set.
Extreme Gradient Boosting
We used extreme gradient boosting (XGBoost), a decision-tree-based ensemble ML algorithm, implemented in Python in the XGBoost open-source library (Chen et al., 2015). XGBoost was chosen because of its ability to handle multivariate attributes and its support for explainability (Ravaut et al., 2021). Also, XGBoost has been used in prior health care studies, including prediction of diabetes (Ravaut et al., 2021; L. Wang et al., 2020), chronic kidney disease (Ogunleye & Wang, 2019), emergency department disposition (Barak-Corren et al., 2021) and disease course in COVID-19 patients (Montomoli et al., 2021).
Data Preprocessing
There were neither outliers nor missing values in the dataset. Further, there was no data imbalance problem to handle since the dataset is relatively balanced; 54.46% positive heart disease instances and 45.54% negative heart disease instances. We did not encode the categorical variables (i.e., sex, cp, fbs, restecg, exang, slope, ca, thal) because they have already been encoded by the data provider (see Table 1). We used min-max transformation to rescale each continuous feature (i.e., age, trestbps, chol, thalach, oldpeak) to the [0, 1] interval.
Model Development
We split the dataset into 80% for training and 20% for performance evaluation. We applied 10-fold cross-validation on the training set to tune the hyperparameters of the XGBoost classifier. We employed the grid search method to find optimal hyperparameters for optimal model performance. Hyperparameters specified to guide the learning process included minimum sum of instance weight needed in a child node (“min_child_weight” = [1, 5, 10]), threshold of gain improvement to keep a split tree (“gamma” = [1, 2, 5]), subsample proportion (“subsample” = [0.6, 0.8, 1.0]), subsample ratio of columns when constructing each tree (“colsample_bytree” = 0.6, 0.8, 1.0]), maximum tree depth(“max_depth” = [3, 4, 5]).
Model Evaluation
We applied the optimal model to the testing dataset to evaluate its performance. Based on Figure 1 we evaluated model performance using the following metrics: accuracy ((TP + TN)/(TP + FP + FN + TN)), specificity (TN/(FP + TN)), sensitivity (TP/(TP + FN)), positive predictive value (PPV; TP/(TP + FP)), negative predictive value (NPV; TN/(FN + TN)), and F1 score (2TP/(2TP + FP + FN)). Further, we evaluated the model’s area under the receiver operating characteristic (AUROC).
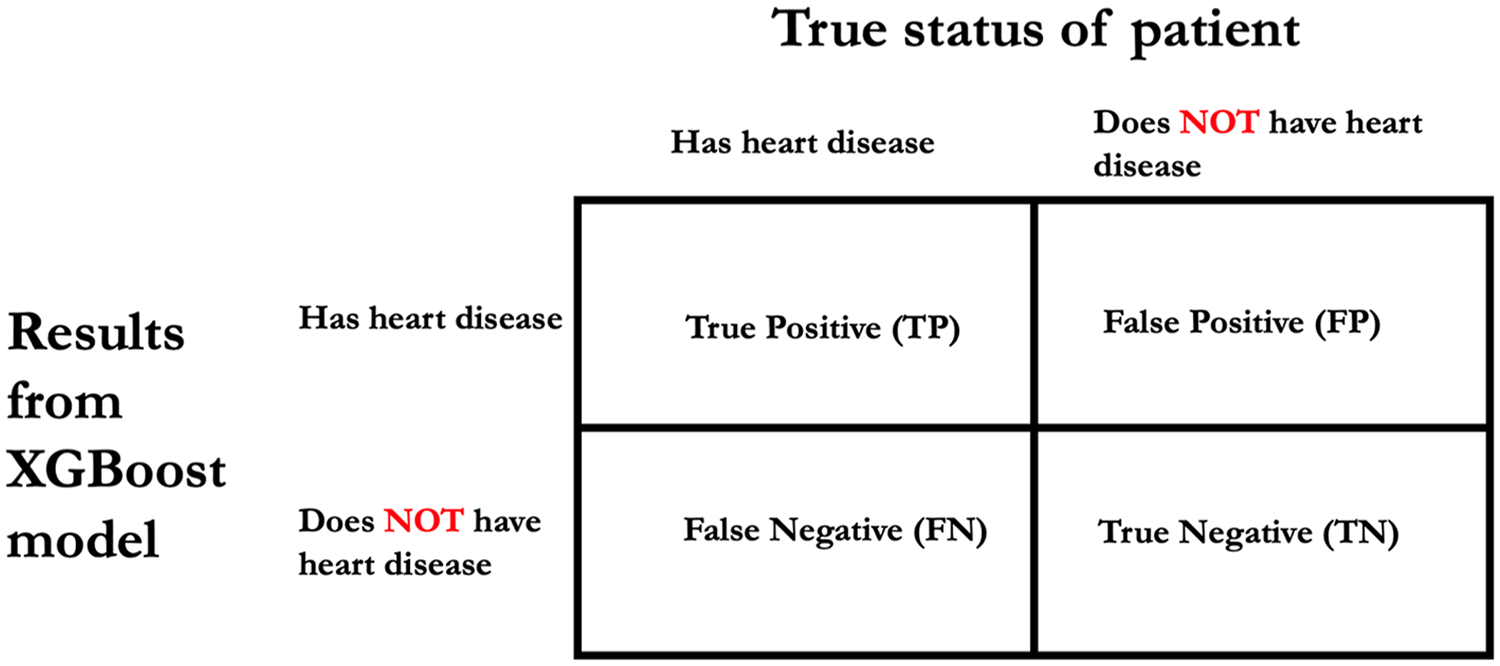
Basis for deriving accuracy, specificity, sensitivity, positive predictive value, negative predictive value and F1 score.
Framing the Context of Use
We defined an initial context of use for explanations for our heart prediction model by identifying who might need the explanation, where they might need the explanation, and why they might need the explanation. Our intended users are cardiology-care providers (e.g., residents, fellows, cardiologists) with varying clinical experience and limited statistical and ML knowledge. We intend for our predictive model to be integrated into an electronic health record or a clinical decision support system to support existing clinical workflows and clinical decision-making in the cardiology care setting.
Design of Prototype Explanation Displays
Our defined context of use informed the design of our prototype explanation displays. We envisaged our intended users, cardiology-care providers, will have limited ML knowledge and might use explanation displays in cognitively demanding environments. Thus, we designed the explanations to help our intended users assess model credibility and minimize the cognitive effort required to process the content they present. Further, for specific predictions, we envisaged that cardiology-care providers would likely seek explanations that highlight features that are pushing a prediction toward one outcome in contrast to another. A model-agnostic feature relevance explanation technique would allow for the design of explanation displays that meet our initial context of use requirements.
We utilized SHAP to generate instance-level explanations of feature influence for our heart disease prediction model. We chose SHAP because of its ability to explain local accuracy and consistency (Lundberg et al., 2020). SHAP, a game theoretic approach, computes Shapley values and uses that as a basis to explain the prediction of an instance. The Shapley value of a feature is the average marginal contribution of that feature, considering all possible combinations of features.
Recall that cognitive chunks are the basic units of explanation. By grouping features in a structured way rather than presenting them individually, large cognitive chunks can be obtained for instance-level explanations of feature influence (Barda et al., 2020). We utilized design options based on cognitive chunk organization for the design of four prototypes. Design options were none, group by influence, and group by assessment. The none option implies cognitive chunks were not organized in a structured. The group by influence (or abnormality) option means cognitive chunks were organized in a structured way to show their contribution, positive or negative, to the prediction of an instance by our predictive model. The group by assessment (or controllability) option implies cognitive chunks were organized by whether they are modifiable (e.g., laboratory test results) or not (e.g., demographics). After consulting with a cardiologist, we categorized the 13 features into demographics, diagnoses and physical assessment, and laboratory test results (see Table 2).
Categorization of Features.
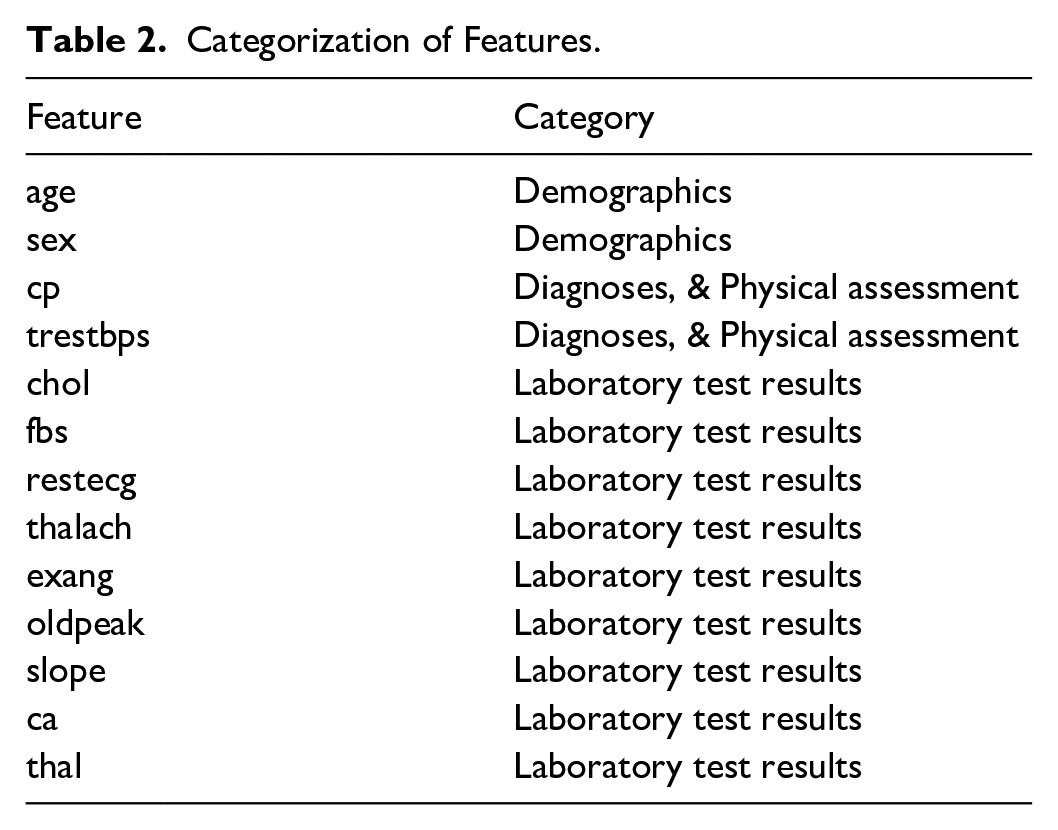
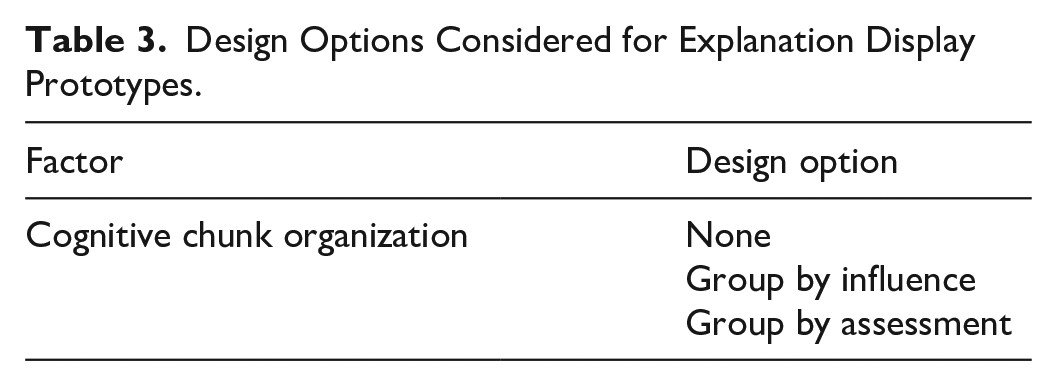
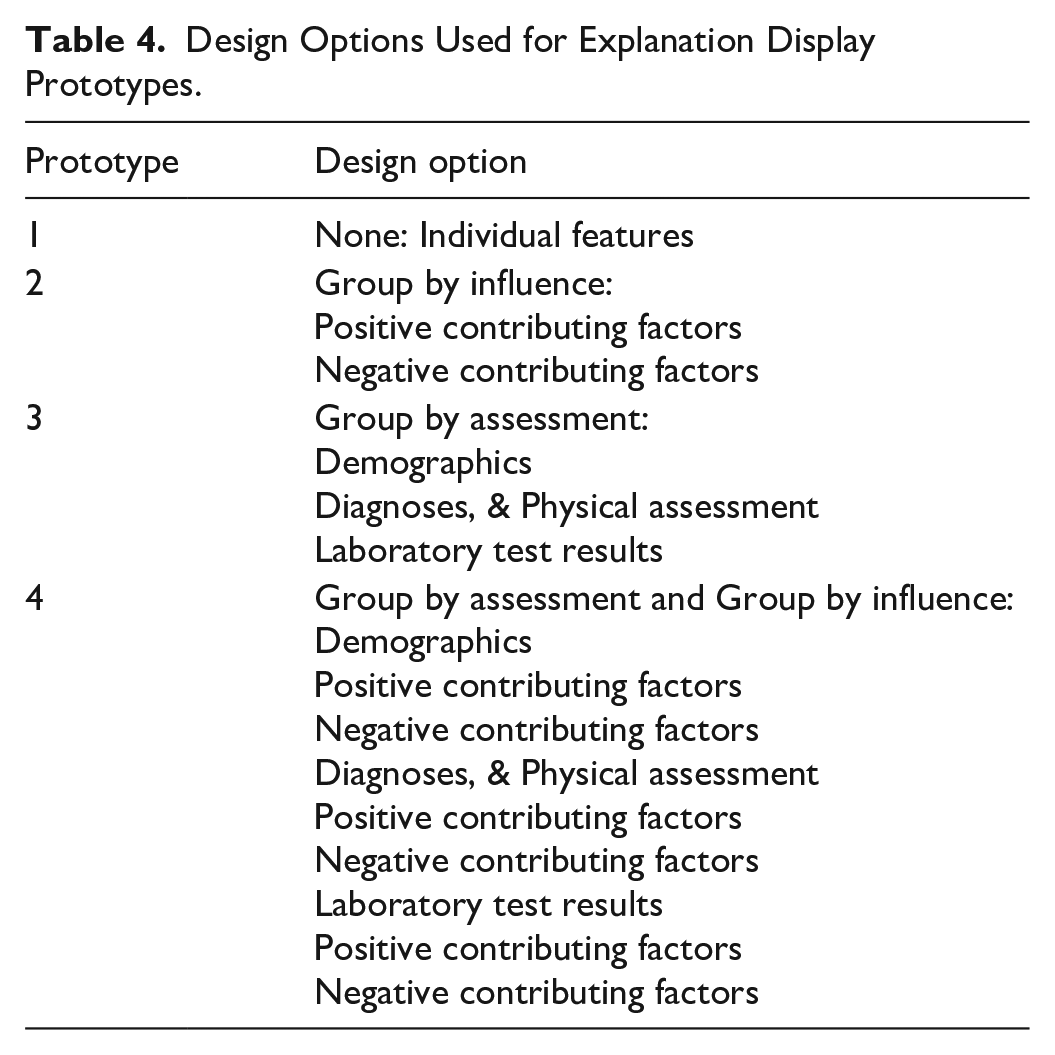
Table 3 describes the options considered for design of the four explanation display prototypes in this study. Table 4 shows the specific design option chosen for each prototype. Prototype 1 was designed to display individual features, with features not organized in a structured way. Prototype 2 was designed to display features grouped by influence into positive contributing factors and negative contributing factors. Prototype 3 was designed to display features grouped by assessment into demographics, diagnoses and physical assessment, and laboratory test results. Prototype 4 was diagnosed to display features first grouped by assessment, and each subgroup was then grouped by influence.
Design Options Considered for Explanation Display Prototypes.
Design Options Used for Explanation Display Prototypes.
The display format of each prototype is tornado plot, an intuitive technique of depicting the influence of each feature on the model’s prediction of an instance (D. Wang et al., 2021). Also, as suggested by D. Wang et al. (2019), we supported each explanation plot with additional information, and raw feature values.
Results
Modeling and Parameter Tuning
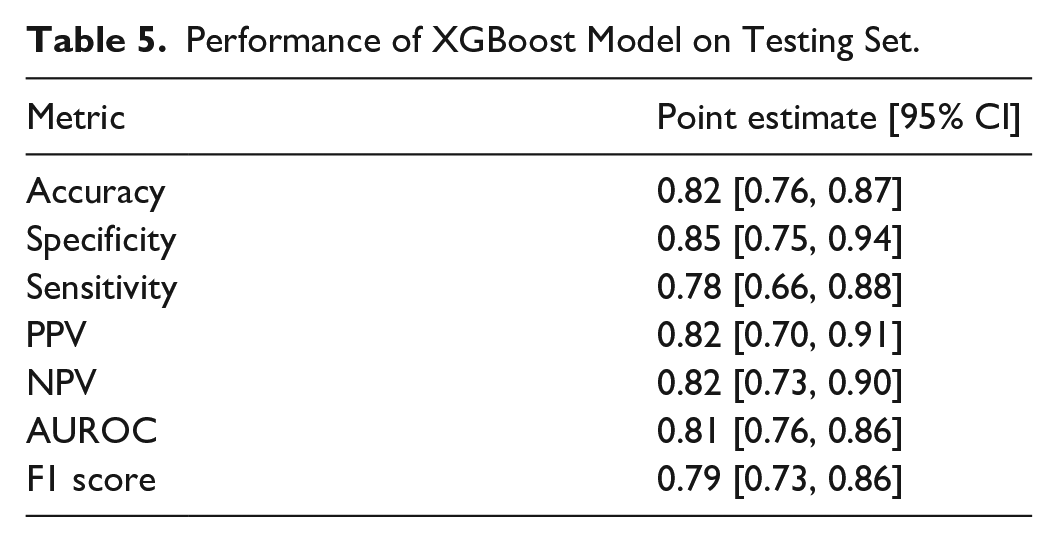
Our optimal model had the following hyperparameters: colsample_bytree = 0.6; max_depth = 3; gamma = 2; min_child_weight = 5; subsample = 0.6. Model performance on the testing set is shown in Table 5.
Performance of XGBoost Model on Testing Set.
Prototype Explanation Displays
Figures 2 to 5 describe and provide two instance-level explanation display examples for each of the four prototypes. For each explanation plot, the abscissa is SHAP values (impact on prediction), and the ordinate is different features. Each explanation plot is supported with additional information, and raw feature values.
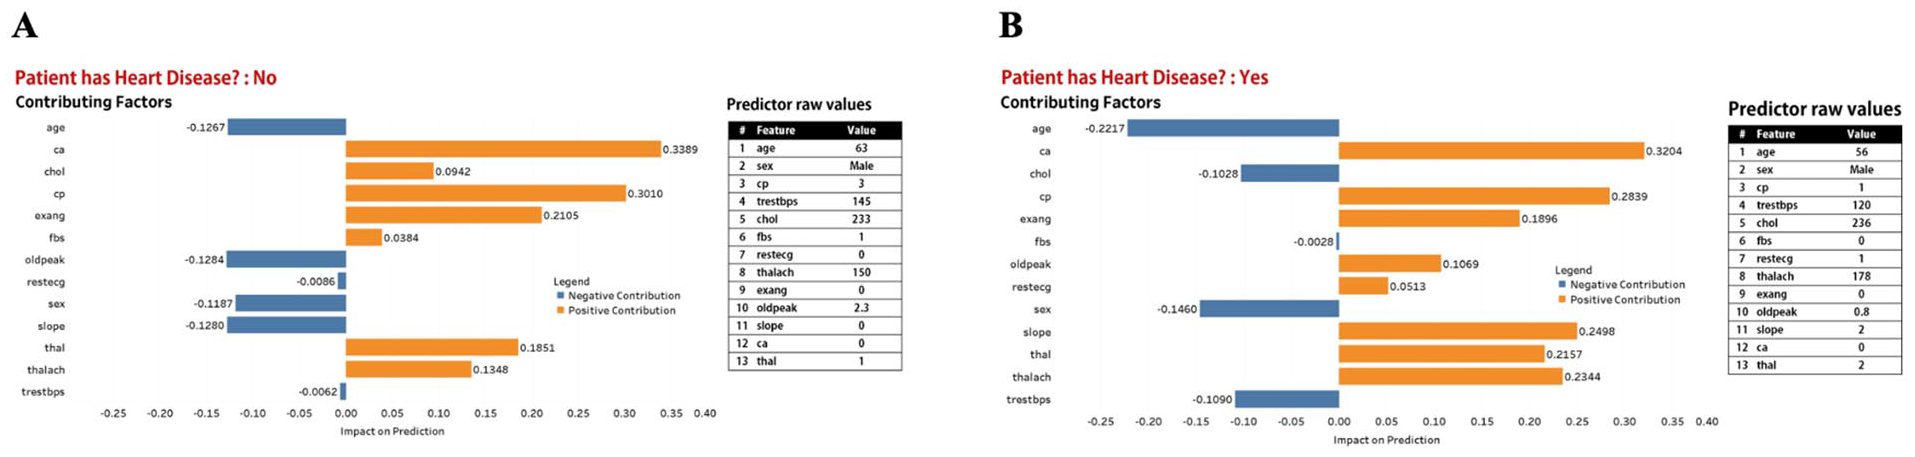
Prototype 1. Explanation display made up of explanation plot and table of raw values of features used in our XGBoost model. (A) Predicted outcome is “Patient does not have heart disease,” (B) Predicted outcome is “Patient has heart disease.”
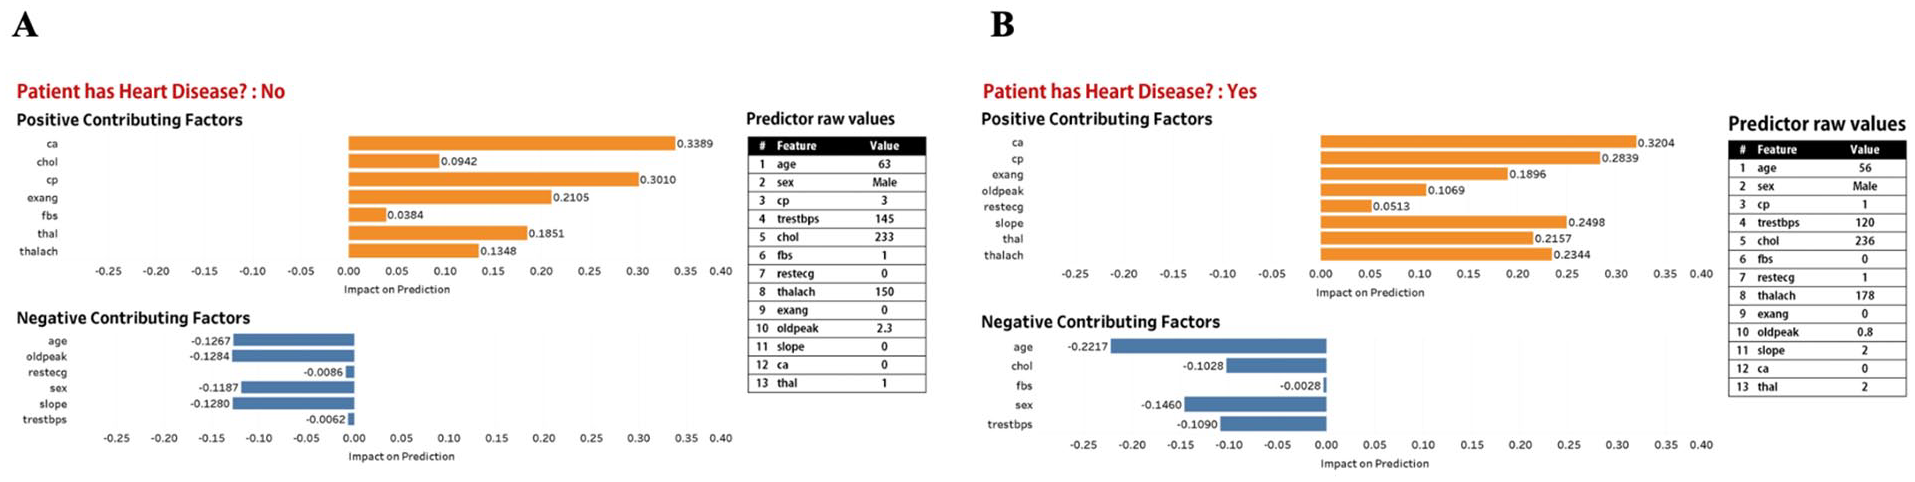
Prototype 2. Explanation display made up of explanation plot and table of raw values of features used in our XGBoost model. (A) Predicted outcome is “Patient does not have heart disease,” (B) Predicted outcome is “Patient has heart disease.”
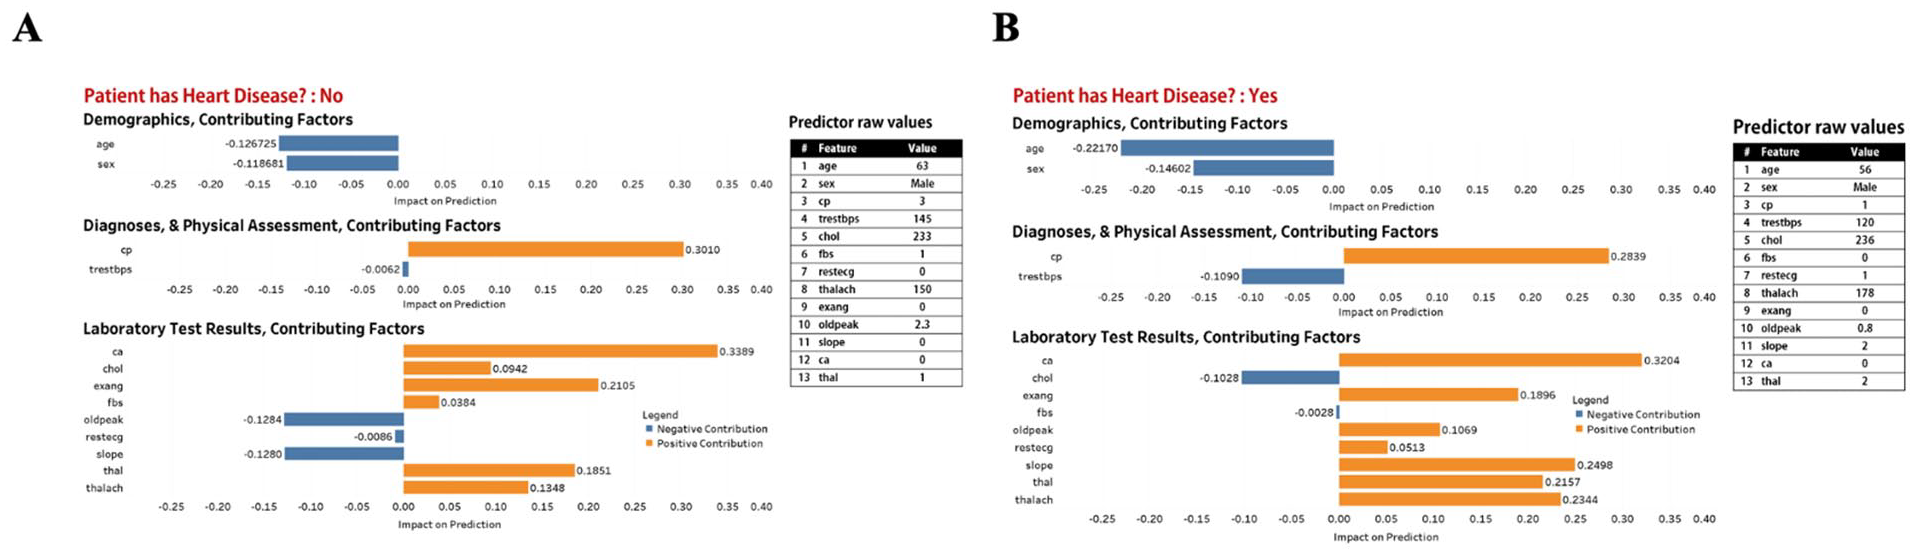
Prototype 3. Explanation display made up of explanation plot and table of raw values of features used in our XGBoost model. (A) Predicted outcome is “Patient does not have heart disease,” (B) Predicted outcome is “Patient has heart disease.”
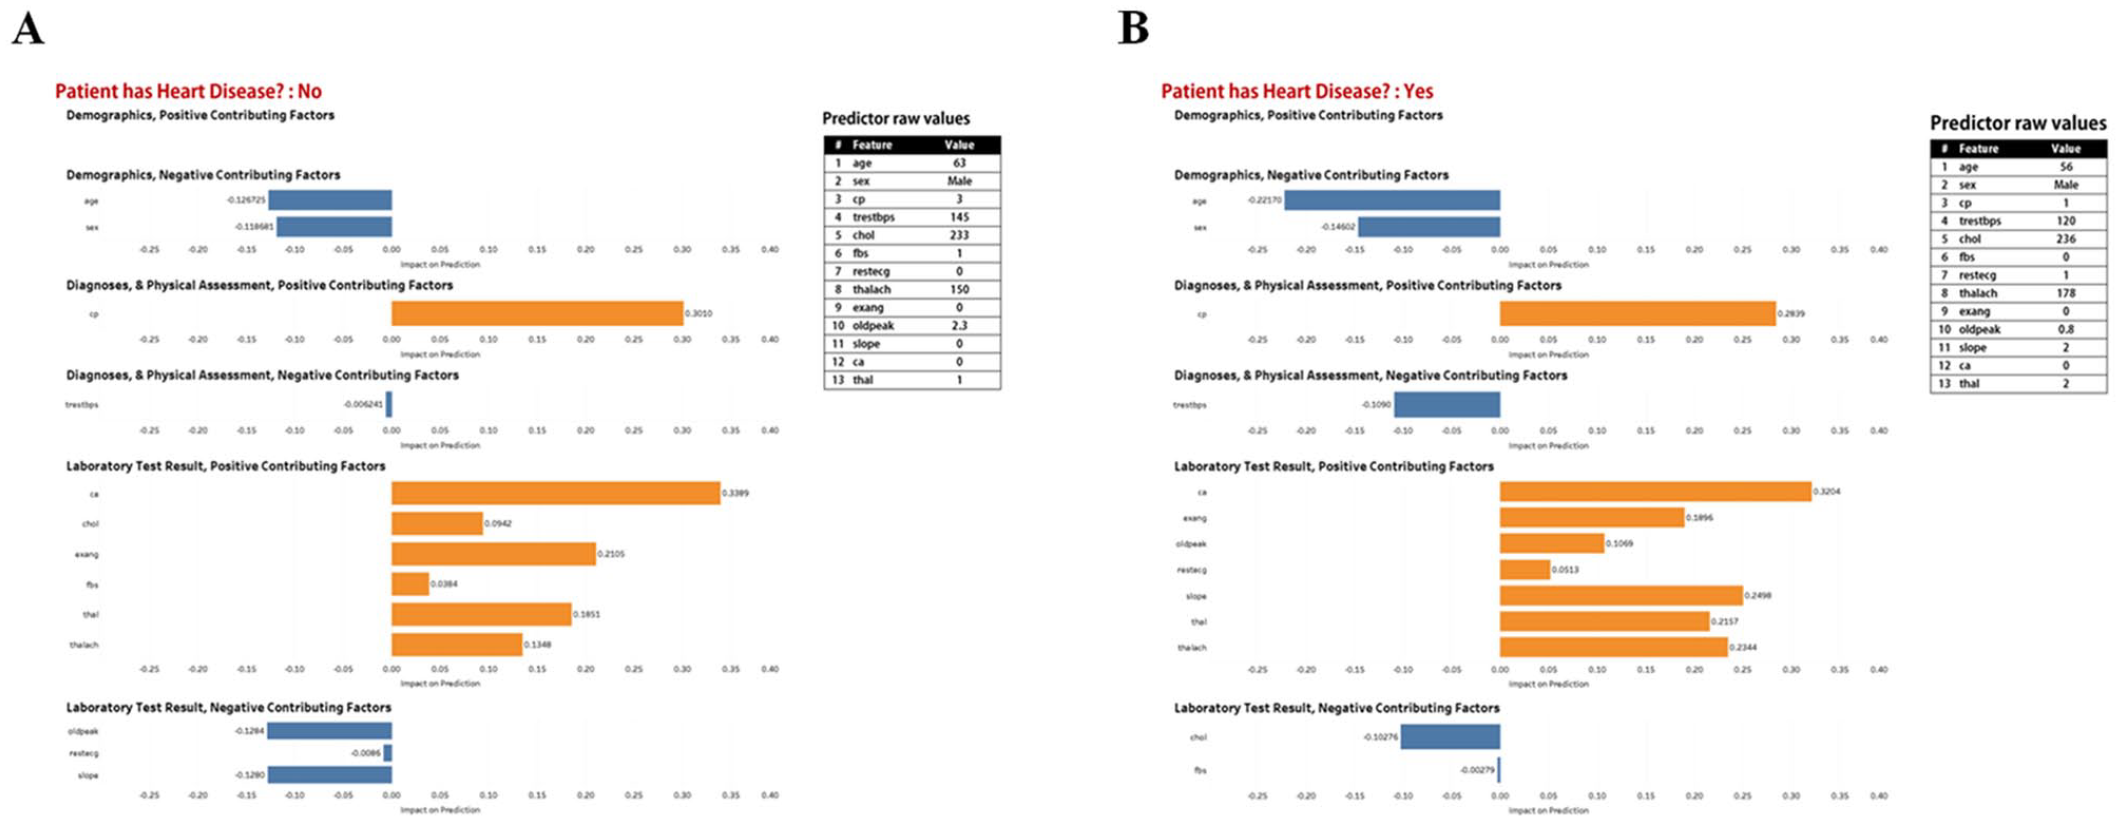
Prototype 4. Explanation display made up of explanation plot and table of raw values of features used in our XGBoost model. (A) Predicted outcome is “Patient does not have heart disease,” (B) Predicted outcome is “Patient has heart disease.”
Discussion
We developed an XGBoost heart disease prediction model, after which we framed an initial context of use that informed the design of four prototype explanation displays. Accuracy of 0.82 (0.76–0.87), specificity of 0.85 (0.75–0.94), sensitivity of 0.78 (0.66–0.88), PPV of 0.82 (0.70–0.91), NPV of 0.82 (0.73–0.90), AUROC of 0.81 (0.76–0.86), and F1-score of 0.79 (0.73–0.86) reveal good performance of our model in predicting heart disease. We utilized SHAP to generate instance-level explanations of our model and employed design options based on cognitive chunks organization to design our prototypes. We demonstrate that it is possible to design multiple prototype explanation displays for a black box ML model based on structured organization of features. Our prototype explanation displays may be presented to a representative group of cardiology-care providers to solicit their feedback on which is best at enabling them to assess model credibility with the least cognitive effort.
Toward a User-centered Design of Prototype Explanation Displays
What constitutes a “good” explanation is often based on the intuition of model developers whose knowledge and background are mostly not representative of the end-user expertise (T. Miller, 2019; T. Miller et al., 2017). However, this is a suboptimal approach as failing to design user-centered explanations may translate into reduced usability and user acceptance (Abdul et al., 2018). User-centered design (UCD), a design approach that focuses on users and their needs, holds considerable potential for improving the design and implementation of XAI within health care (Dopp et al., 2019).
The first logical step toward the design of user-centered explanation displays is to refine our initial context of use. We will conduct focus groups with a convenient sample of cardiology-care providers to solicit their feedback on our prototype explanation displays. We will seek their perceptions of the explanation displays for explaining predictions from our heart prediction model and explore their preferences on the design options. Insights from the focus group will inform the design of a final user-centered explanation display.
Next, we will conduct a mixed-methods within-subjects laboratory study to evaluate our user-centered design. This will be a human-grounded evaluation (Doshi-Velez & Kim, 2017) in which cardiology-care providers will use the explanations to perform simplified tasks. Experimental conditions will be: (1) feature data only, (2) feature data and model prediction of the data, and (3) feature data, model prediction of the data, and user-centered explanations from the model. We aim to utilize hypothesis testing to evaluate the utility of our user-centered explanations and how they impact the speed and accuracy with which cardiology-care providers assess patient condition.
Conclusion
This study drew on existing cognitive science and human-computer interaction research to design prototype explanation displays for a heart disease prediction model. We employed design options based on cognitive chunk organization and utilized SHAP, a post-hoc explainer, to generate instance-level explanations for model predictions. Finally, we provided steps that can be followed toward the design and evaluation of user-centered explanations in health care.
Footnotes
Declaration of Conflicting Interests
The author declared no potential conflicts of interest with respect to the research, authorship, and/or publication of this article.
Funding
The author disclosed receipt of the following financial support for the research, authorship, and/or publication of this article: This research was supported in part by the U.S. National Science Foundation under Award Number 2232869.