
Abstract
The NASA Aeronautics Research Mission Directorate created the High Density Vertiplex (HDV) project to integrate and evaluate a prototype Urban Air Mobility (UAM) ecosystem. Part of the HDV testing environment included a prototype operator user interface called the Fleet Manager Interface (FMI). In 2023, HDV conducted flight testing with the FMI during which a user experience (UX) study was performed to assess the quality of UX and elicit design recommendations. As a result, a large database of open-ended, qualitative responses was generated and then coded using a new qualitative data coding technique called Directive String Coding. The key themes that arose from the coded responses showed that the UX was pleasant, system notifications should be more salient, and information across multiple screens should be integrated into a central display. As the Fleet Manger operational role is still being defined, it is vital to increase our understanding of the tools and capabilities needed for such a role. The results from HDV work will eventually feed into standards for vertiport operations that will enable safe and scalable UAM operations in the United States.
Keywords
Introduction
In the future, a market boom is projected in electric vertical takeoff and landing (eVTOL) as well as Unmanned Aerial Systems (UAS) aircraft transportation (Federal Aviation Administration [FAA], 2020, 2023). Advanced Air Mobility (AAM) is a concept that predicts an increasing demand for services such as passenger transport (i.e., air taxis; Northeast UAS Airspace Integration Research Alliance [NUAIR], 2021), cargo transport (Wolter et al., 2023), and public services (i.e., wildfire response; Martin et al., 2021), among others. It is envisioned that human and autonomy teams (HAT) will be used to perform flight operations in an AAM world. Rather than the traditional 1:1 operator to aircraft mapping, a HAT could be responsible for the aggregate management of an organization’s entire fleet. Through increased use of autonomous systems, it is likely that there will be a progressive need for Fleet Managers (FMs) to manage multiple aircraft simultaneously.
High Density Vertiplex Project
To address some of the issues of the emerging AAM concept, the NASA Aeronautics Research Mission Directorate created the High Density Vertiplex (HDV) project. The purpose of HDV was to conduct both virtual and live aerial flight tests to study terminal area eVTOL flight operations within a prototype Urban Air Mobility (UAM) ecosystem (i.e., routine air-taxi operations at a dense, urban vertiport; Glaab et al., 2022). To do this, HDV implemented a highly automated airspace management system along with several automated tools to aid human operational roles. One of the tools developed for the FM was a prototype traffic management system called the Fleet Manager Interface (FMI).
Human Factors Assessment of Fleet Manager Interface
Throughout the multiyear project, user experience (UX) assessments were performed on the FMI to identify information requirements and to improve situational awareness and decision support for FMs. Early human factors work was centered on the self-reported experience of FMs using classic human factors dimensions (i.e., workload, situational awareness, perceived risk, and usability; Hodell et al., 2022). Although useful for obtaining a global sense of the FMI’s acceptability, numerical ratings fell short of highlighting the specific aspects of the user interface (UI) that could be improved. The follow-up UX assessment in 2023 aimed to take a more grounded approach, by having the FM participants self-report their UX and design recommendations through open-ended questionnaires. This data collection method generated a large qualitative dataset which was analyzed using a new data coding technique that aimed to convert each comment into actionable feedback.
Qualitative Data Coding
Qualitative data coding is the process of methodically labelling language-based data with either a word or phrase, resulting in an organized summary of the dataset which readily highlights patterns and trends (Linneberg & Korsgaard, 2019; Williams & Moser, 2019). Although pre-established data coding techniques provide researchers with valuable tools and strategies, it may be necessary to modify these techniques to suit the needs of specific studies and datasets (Blair, 2015). Therefore, researchers should refine and optimize these techniques to maximize the quality of their analyses.
Broadly, there are two main coding techniques: inductive and deductive coding. Inductive coding is a technique where codes are developed based directly on the language used in the original dataset (Linneberg & Korsgaard, 2019). Conversely, deductive coding uses pre-defined codes that are developed by researchers prior to scoring the original dataset. Generally, qualitative data coding involves a combination of inductive and deductive techniques, which is known as a blended approach (Graebner et al., 2012).
The data coding technique developed for analyzing the HDV dataset, Directive String Coding (DSC), used a blended approach to systematically generate actionable heuristics that stakeholders (e.g., researchers, UI designers, software developers) could use to answer specific research questions and make future design decisions.
Methods
Participants
Six participants acted as Fleet Managers for this study. Their professional backgrounds included aeronautics engineering, aeronautics user research, software development, and flight operations, with an average of 3.75 years of experience (range: 2–5 years). Participants were recruited from the staff at NASA Ames Research Center.
Apparatus
The FMI (see Figure 1) was designed to integrate with external systems and make operational context available to the human operator (Hodell et al., 2024). In this study, the FMI was used as the primary workstation for the FM position. Some of the key features of the FMI included (a) a map display of the airspace, (b) a tool to schedule flights called “schedule page,” (c) status updates about flights called “operations page,” (d) a tool designed to partially automate a nominal flight procedure called “missed approach,” and (e) alert notifications indicating that an action is required.
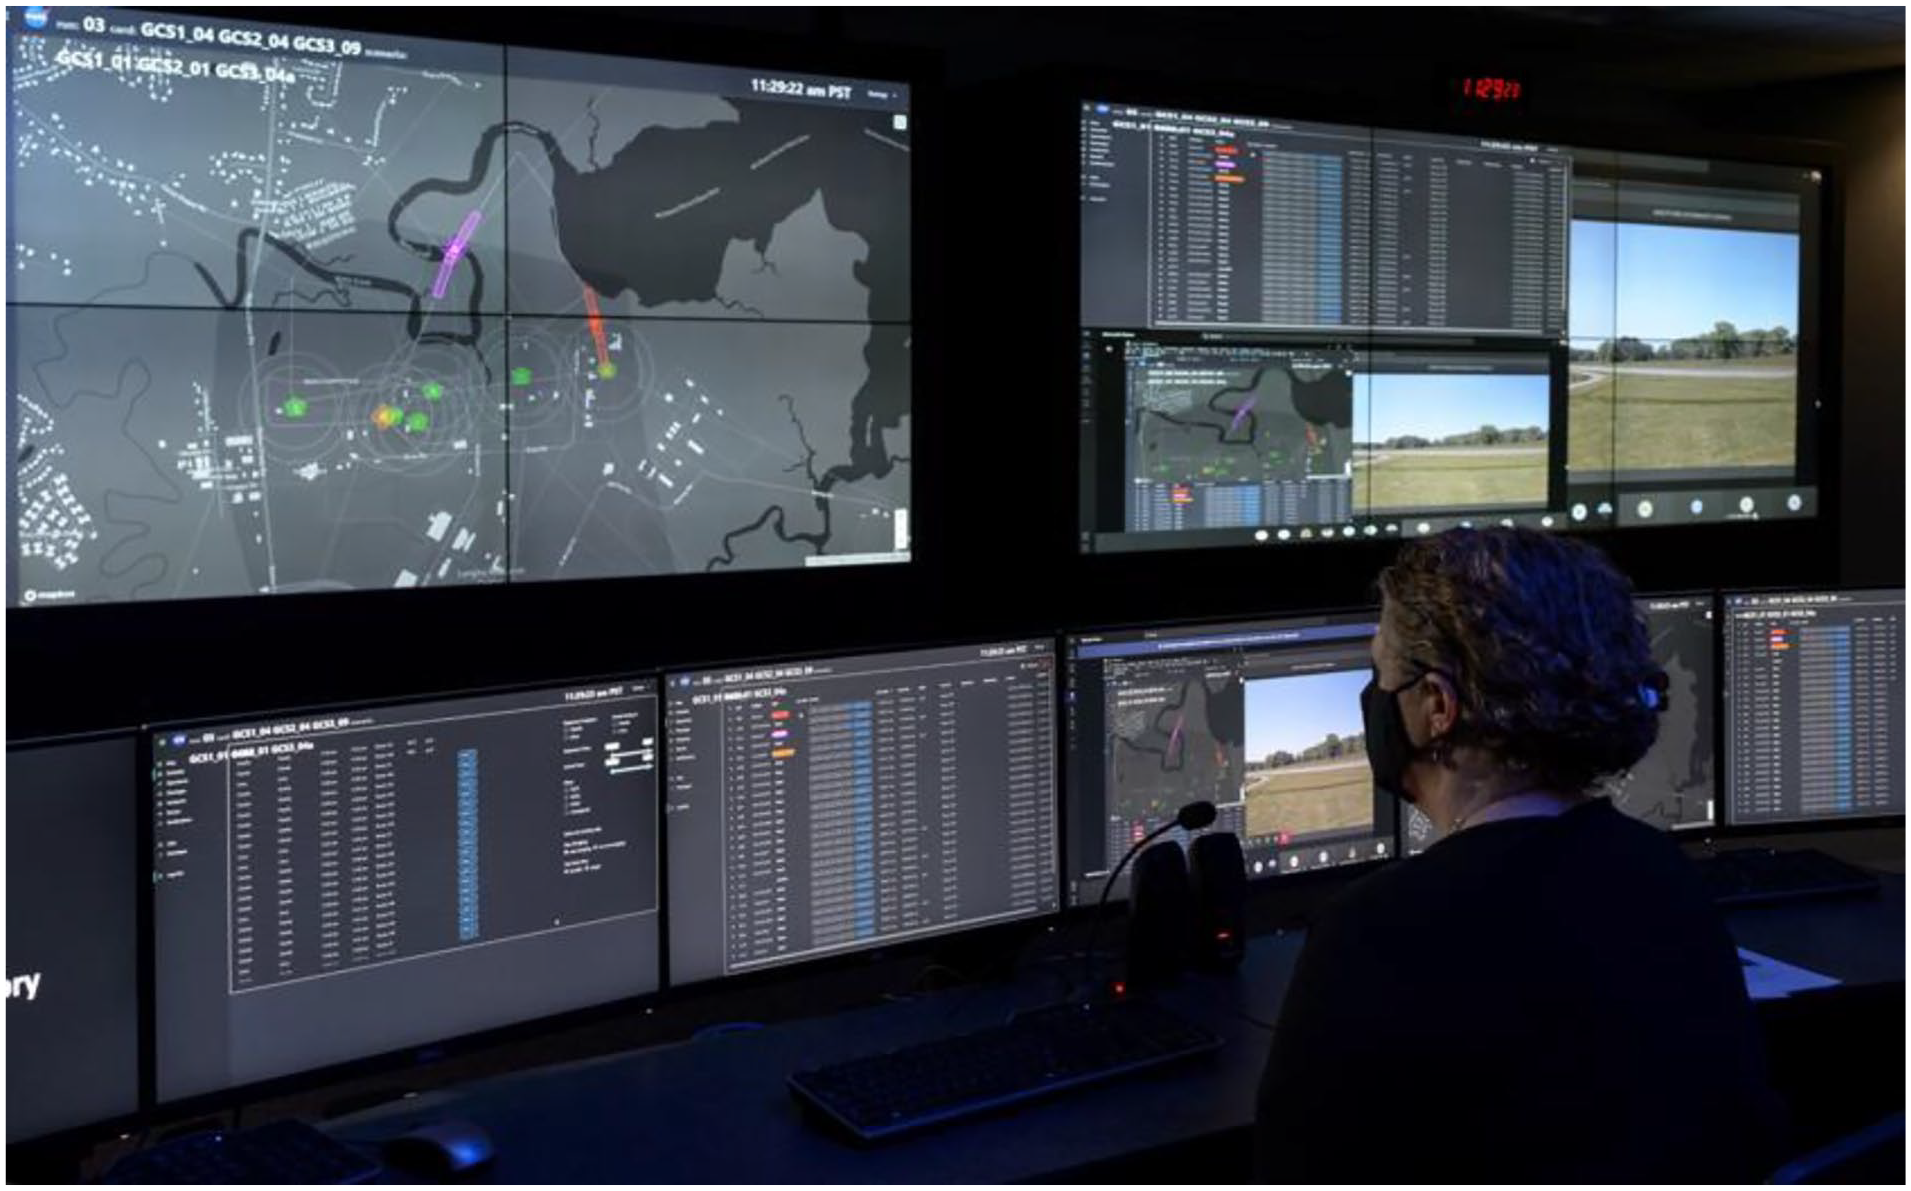
The Fleet Manager Interface in a laboratory setting.
Measures
To evaluate the FMI UX and generate design recommendations, self-report surveys were administered to participants between-runs and post-runs. The between-runs survey was customized to whichever scenario was run last, such that the questions were targeted toward the specific tools in the FMI that the participant recently interacted with. The between-runs questionnaire prompted participants to comment on (a) tool acceptability, (b) understandability, (c) amount of available information, (d) confidence in decision making, (e) level of confusion, (f) features they would like modified or removed, and (g) any general additional comments. The post-run questionnaire was adapted from the Post-Study System Usability Questionnaire (PSSUQ; 16 items, α = .97; Lewis, 1992), which is a Likert-type rated response questionnaire that assesses users’ perceived satisfaction with a system. In addition to rating items on a scale from 1 to 7 (1 = strongly agree, 7 = strongly disagree), open-ended response boxes were provided for participants to expand on their ratings.
Procedures
Six FM participants completed a total of five 30 min runs over the course of 2 days (by completing two or three runs per day). Each flight scenario took approximately 20 min to complete, followed by a 10 min interval to fill out questionnaires. Upon arrival at the laboratory, participants completed a demographic and background information form. Before the study runs began, participants were given a 1 hr training session to ensure that they were comfortable using the FMI. Participants were asked to interact with the UI as a supplement to their standard traffic management tasks while researchers observed the participants’ interactions with the FMI under five simple flight scenarios:
1. Nominal: Nominal flight.
2. Missed Approach: A vehicle executed a missed approach holding pattern.
3. Speed Change: Minor delay to the vehicle (<60 s).
4. Divert: Two vehicles were diverted away from their scheduled vertiport.
5. Multi-Aircraft Divert: Three vehicles were impacted by an emergency landing. The first vehicle executed a missed approach and then diverted. The second vehicle was diverted and the third was slowed down.
Once the start of the simulation was announced, FMs reviewed the schedule table and found an acceptable takeoff time at the departure vertiport, then assigned the correct route to the target aircraft. Once the operation reached takeoff time, automation took over the execution of takeoff, flight, approach, and landing. If executing a nominal, automated landing at a scheduled vertiport, automation controlled the descent and landing sequence. If executing an unscheduled diversion, missed approach, or speed change, FMs were issued a warning message and then engaged the appropriate tool to resolve the issue. A more detailed account of the HDV flight test facilities, scenarios, and procedures can be found in McSwain et al. (2024).
Directive String Coding
The data coding technique developed for analyzing the HDV dataset, called Directive String Coding (DSC), used a blended approach to generate actionable heuristics that stakeholders (e.g., researchers, UI designers, software developers) could use to answer specific research questions and make future design decisions. To do this, a “string” of parent codes and subcodes were assigned to each survey question and response. The four parent codes were (a) Action, (b) Point of Interest, (c) Keyword, and (d) Description. For a taxonomy of the parent and subcodes, see Table 1.
Taxonomy of data codes.
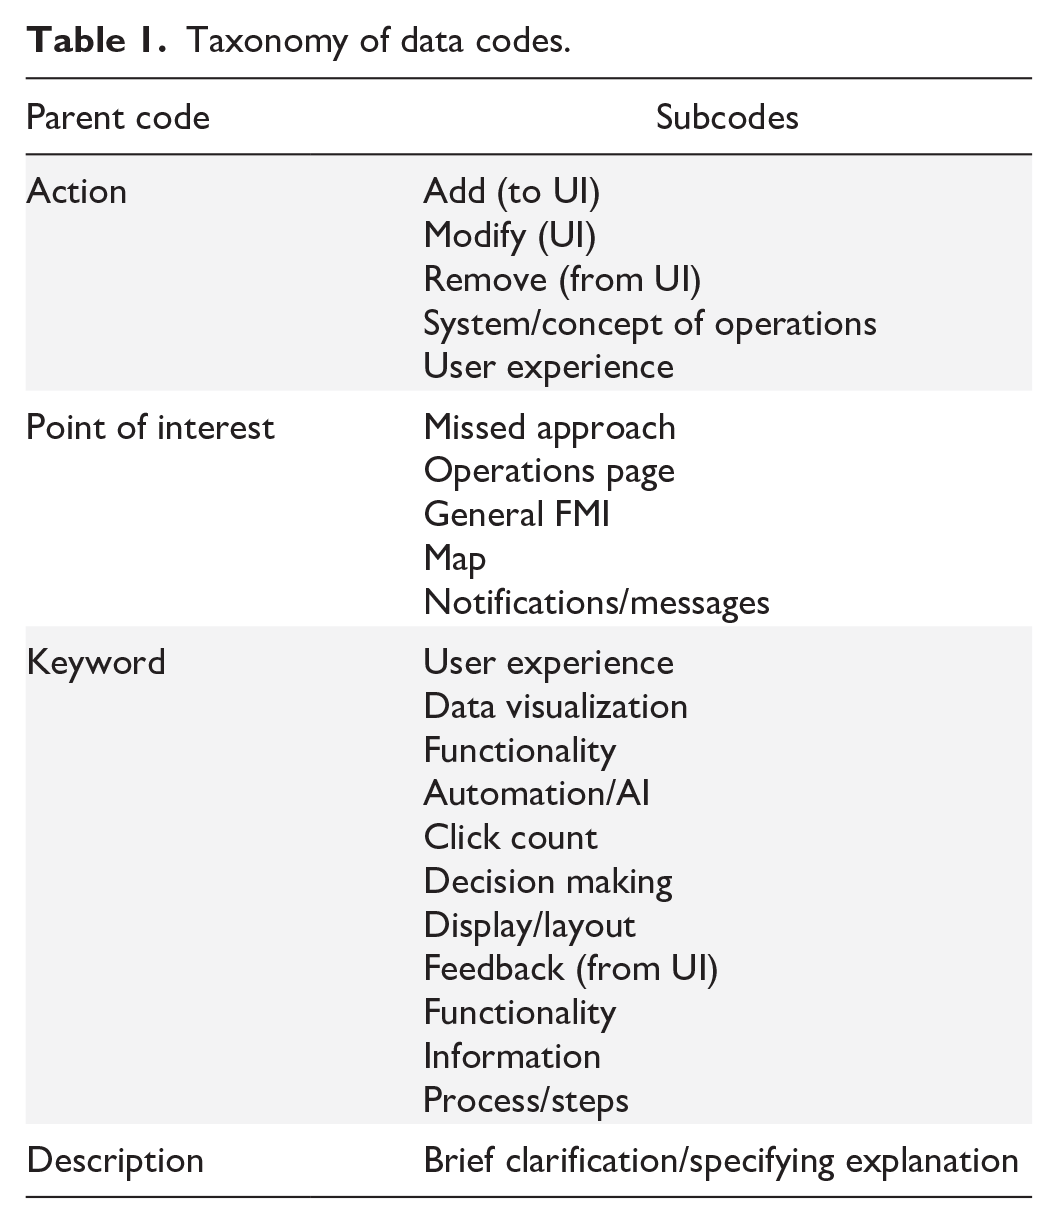
The primary category of the string, Action, coded data based on what steps stakeholders should consider taking. The codes associated with Action were developed using the deductive technique, meaning that they were pre-established based on what actions were possible for stakeholders to consider. There were five codes for the Action category:
1. Add: Participant wanted something added to the interface.
2. Modify: Participant wanted something modified in the interface.
3. Remove: Participant wanted something removed from the interface.
4. Systems/Concept of Operations: A category used for responses to questions asking if the system needed to be changed or if the operation needed to be performed differently.
5. User Experience: A category used for responses to UX questions.
The second category in the string, Point of Interest, described which feature, characteristic, or part of the UI the response addressed. Point of Interest codes were developed using an inductive-style technique in which the aspect of the UI that the participant’s response addressed was used to generate the code. Even if the exact language was not present, if a comment referred to, for example, the map, the Point of Interest code for the comment would be “map.” However, if a participant specifically addressed a particular feature or characteristic within the map, for example, the data-tags associated with each vehicle, then the Point of Interest code would be “data-tags.” This ensured that comments were categorized accurately based on which aspect of the UI participants responded to.
The third code in the string, Keyword, was the main subject of the participant’s response. An inductive-style technique was used to generate the codes for the Keyword category. To do this, each comment was coded based on a dynamic list of terms, or keywords, and their definitions. Keywords were developed based on the emergent patterns in the participant responses, therefore the keyword was most subject to the researcher’s interpretation. For example, if a comment was something they wanted to “see” on the interface, the “data visualization” code was applied. If a comment was something they wanted the tool to “do,” the “functionality” code was applied.
Once the Action, Point of Interest, and Keyword codes were generated, the fourth category, Description, provided a brief memo regarding necessary details. Although an effort was made to keep the language used in the descriptions consistent, descriptions were generally more open-ended in nature and provided critical information for completing the directive string. For example, if participants indicated that they wanted specific pieces of information on the vehicle data-tags, the Description provided the specific information they wanted included. In situations where participants provided positive feedback in which there was no action to take, the Description was labelled as “Good.”
Consistent with Blair’s (2015) data coding methodology, the current dataset was systematically scored three times before being reviewed by a second researcher. During each pass of the data, the codes were refined and consolidated when appropriate to maximize the usefulness of the data without creating too many codes. Additionally, the coding structure allowed researchers to sort and filter the information by any of the four parts of the code.
Once the string was generated for a particular response, reading the string in sequential order provided an information summary that could be used to guide future UI design. For example: Action: Add > Point of Interest: Map > Keyword: Information > Description: Vehicle callsign
In the above example, the participant’s comment indicated that they wanted to add, to the map, information, specifically, the vehicle’s callsign.
After the coding process was completed, the raw frequency of each comment code was calculated. That is, no distinguishment was made between comments that were made multiple times by the same participant and comments that were made once by multiple participants.
Results
The DSC technique was used to analyze FM open-ended survey responses collected during the HDV flight tests in 2023. The codes with the highest frequency are reported with a summary of the key findings in this section.
Within the Action parent code (see Figure 2), the largest proportion of responses were coded as User Experience (35.2%), followed by Modify (32%), Add (27.7%), Systems/Concept of Operations (4%), and Remove (1.6%). The distribution of responses indicated that very little should be removed from the FMI, rather, the existing UI should either be modified or added to.
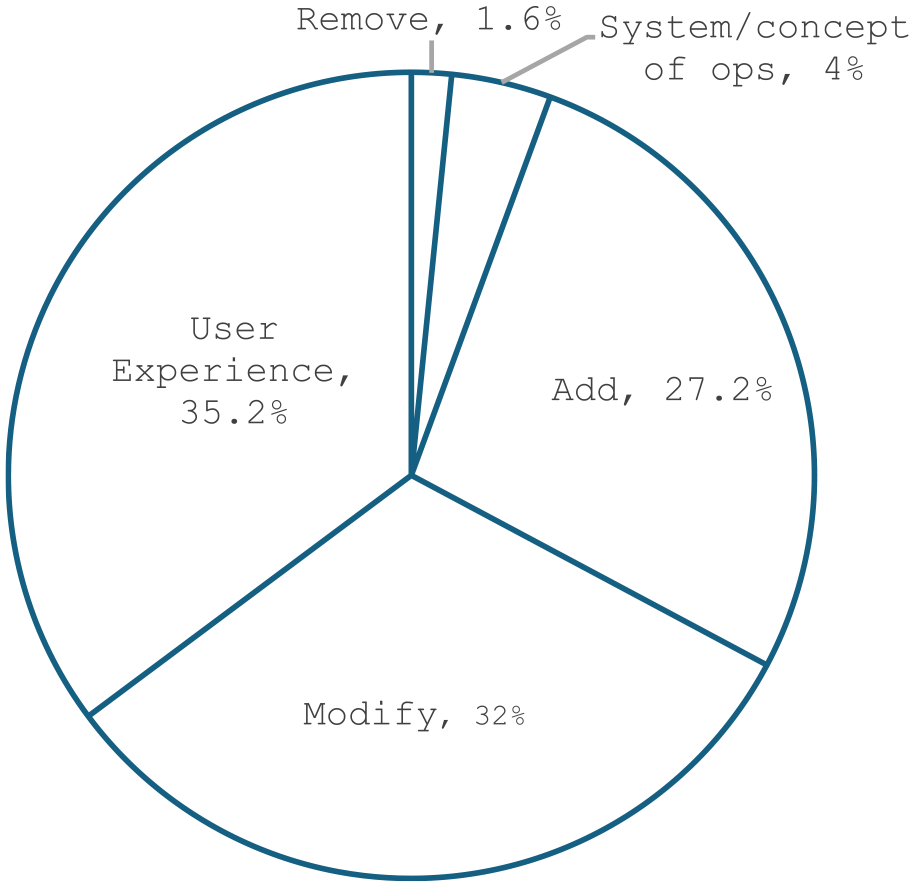
Proportional distribution of subcodes within the Action parent code.
Of the responses coded as User Experience, 86.5% were positive comments, indicating FM participants had a pleasant experience using the interface and that learning to use the FMI became easier over time (see Figure 3). This finding is corroborated by the interpretation of the numerical scores from the PSSUQ, in which the overall usability score for the FMI (M = 2.6, SD = 1.21) was found to be better (i.e., lower) than the normalized overall PSSUQ rating of 2.82 (z = −.18; Sauro & Lewis, 2016).
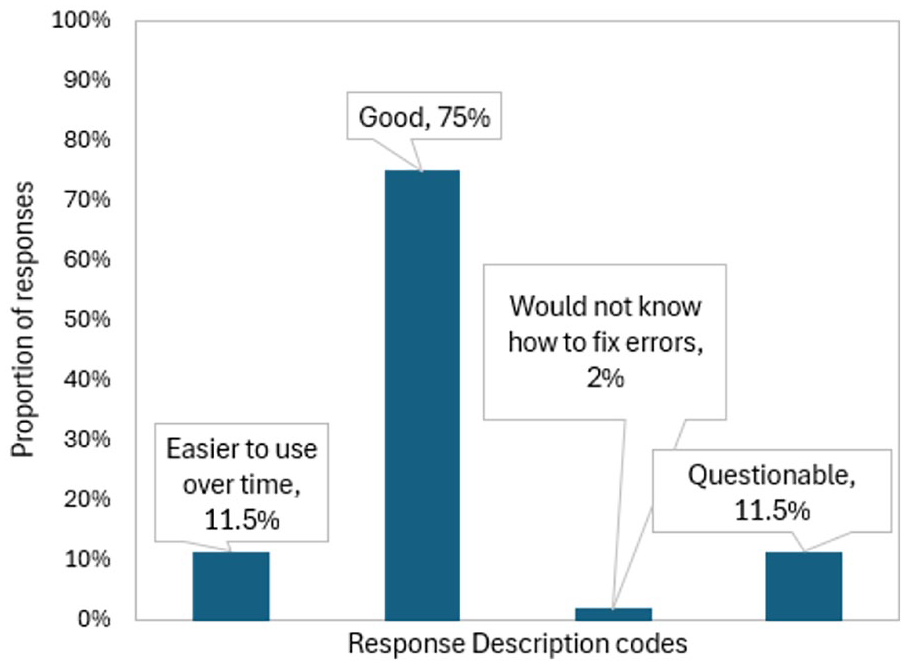
Frequency of response description codes within the user experience axis.
The second largest proportion of responses within Action was Modify. Within Modify, the number one Point of Interest code was Notifications/Messages (36.1%). Within Notifications/Messages, the primary response Keywords were Display/Layout (84.6%), and the primary Description was to increase salience (72.2%; see Figure 4). Therefore, the results of the DSC analysis indicated that the most frequently reported issue across all FM participants was that they wanted to modify notifications and messages by increasing their display salience.
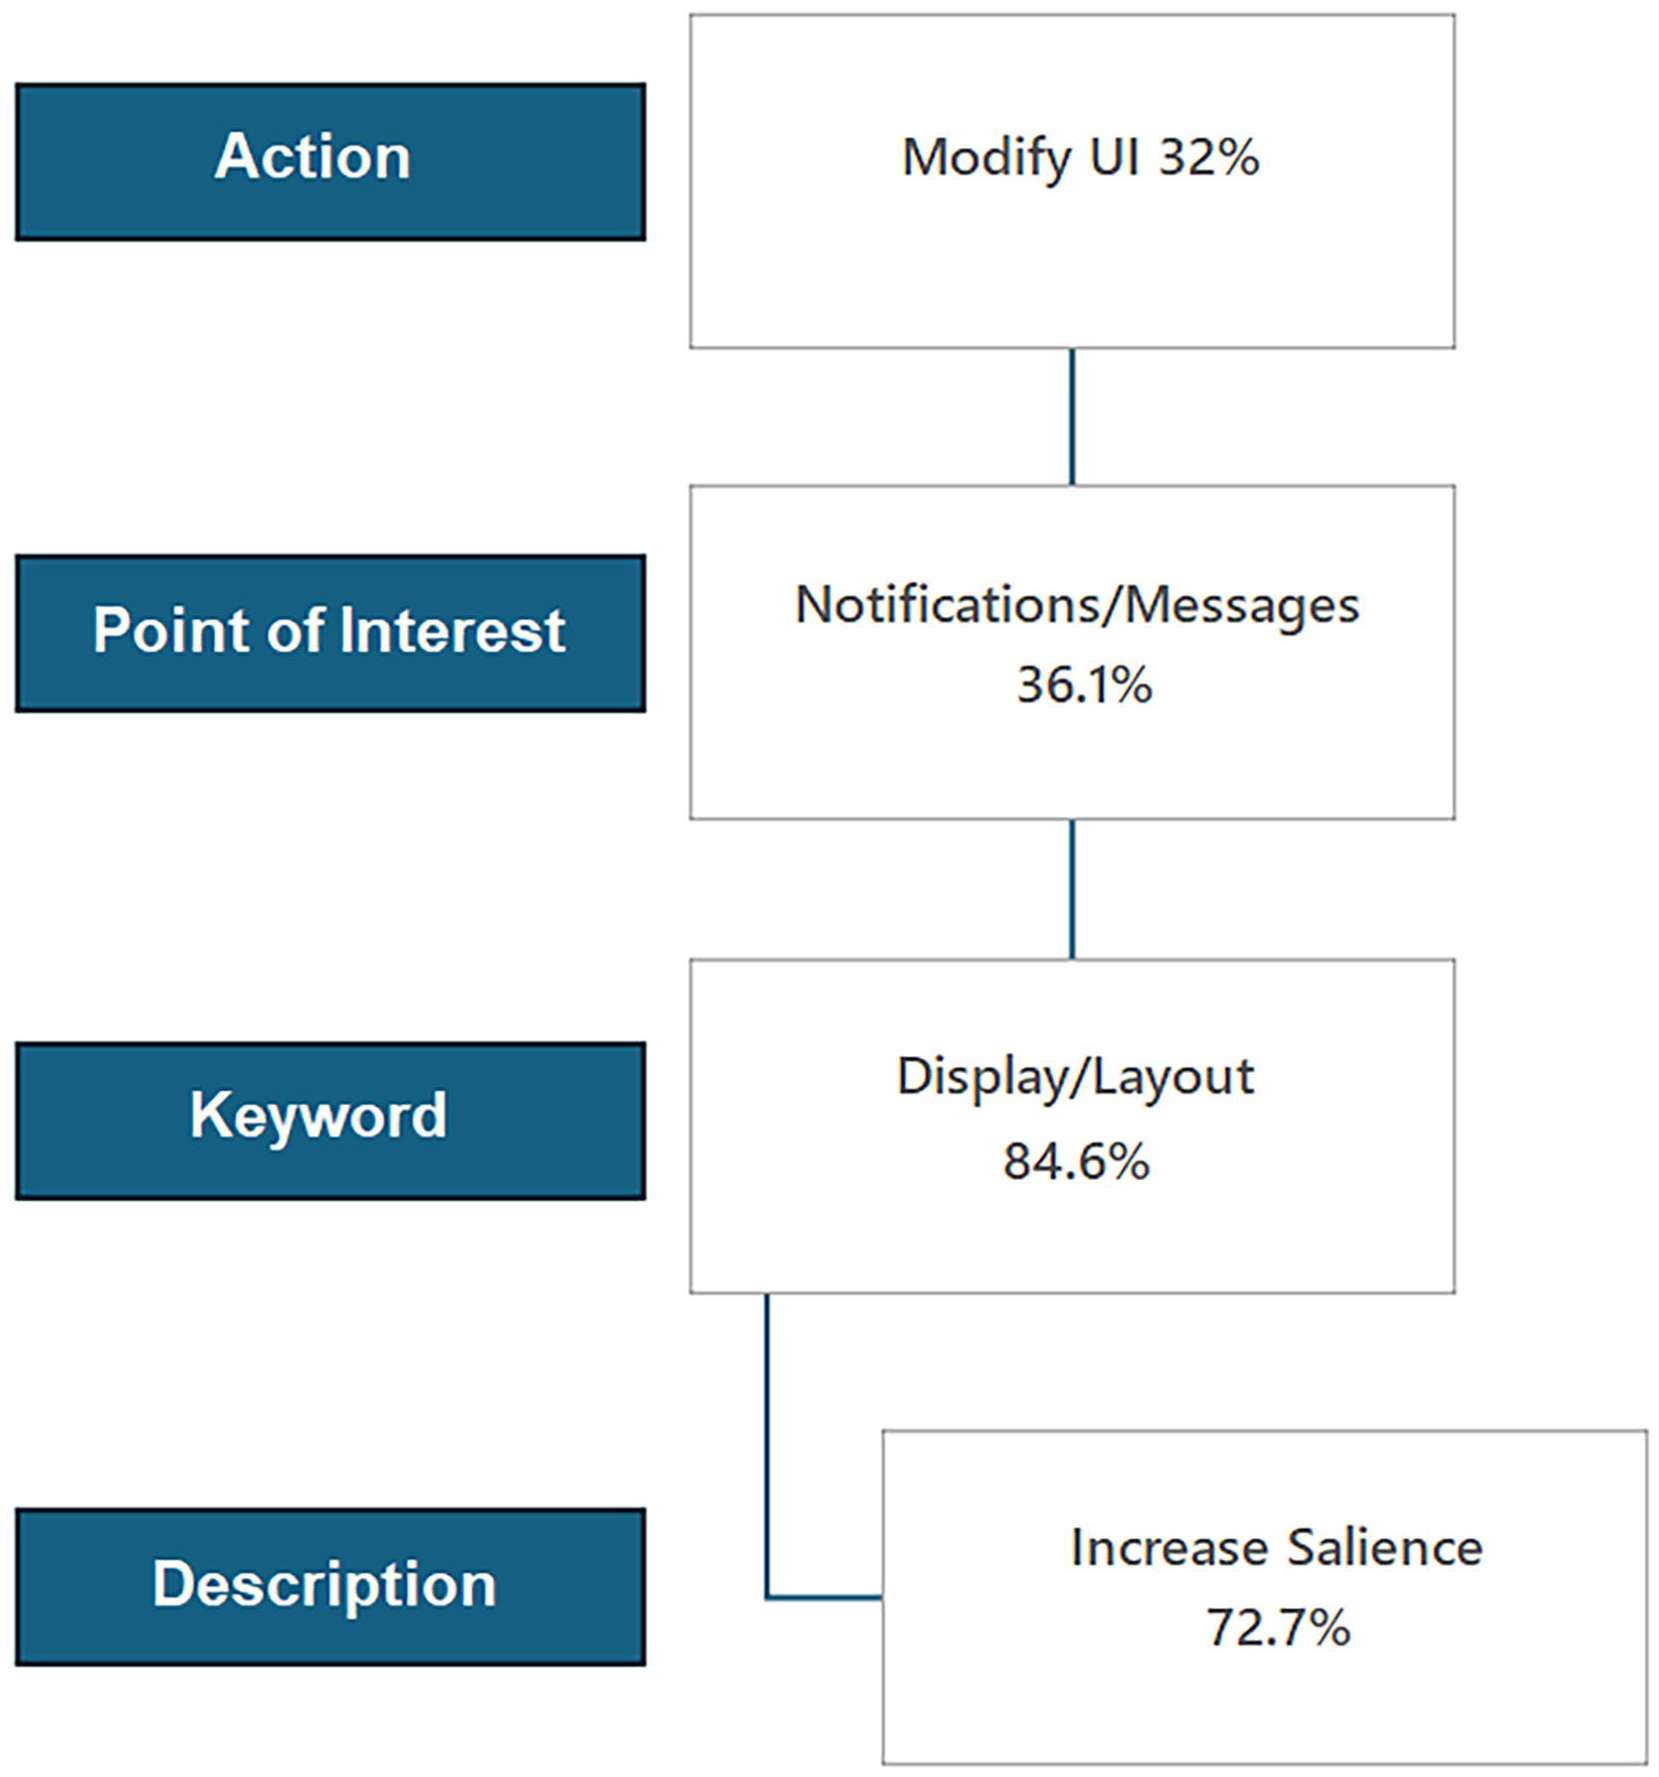
Flowchart of full string code within the Modify subcode. Percentages reported indicate the proportion of responses within each nested category, such that each successive subcode wholly contains the antecedent code string. Therefore, among all responses that contained the string Modify > Notifications/Messages > Display/Layout, 72.7% mentioned increasing salience.
The second largest Point of Interest code within Modify was General FMI (27.8%). Within General FMI, the primary response Keywords were Display/Layout (70%), and the primary Description was to better integrate information across all UI windows (57%). As such, the second most frequently reported issue was to improve the interface by integrating more information from the schedule, operations, and map pages, rather than having them spread across three different windows.
Discussion
The choice to analyze a large set of qualitative data over standard human factors scales or a general summary of open-ended feedback was made for three reasons. First, researchers sought to generate a large list of design recommendations for the novel FMI tool. Second, adding string codes into a database allows for the rapid sorting and filtering of comments by researchers seeking to answer specific questions. Third, string codes enable researchers to determine the magnitude, or frequency, of comments that reference specific aspects of the UI. Through this technique, it is possible to numerically represent qualitative information. In this study, we chose to represent the data from the top two Action subcodes: User Experience and Modify. Ultimately, the data could be sorted along any desired axis making the feedback for any chosen feature easily accessible.
One of the main findings of the study was that the overall user experience for FMs was overwhelmingly positive. This indicated that at a prototype level, the FMI could be a suitable asset for continued research in the domain of high density, UAS fleet management.
The top two recommended modifications to the FMI were that the display of notifications and messages should be made more salient to the user and that information across three separate operator pages should be more consolidated. Regarding the first recommendation, participants expressed that the notifications could be mistaken as irrelevant pop-up windows and, in some cases, overlooked entirely. It is important to develop highly effective notifications because it is predicted that as human operators become responsible for the management of multiple aircraft, there will be a heavier reliance on automated notifications over traditional voice communication (Federal Aviation Administration (FAA), 2023). Regarding the second recommendation, through discussions with FMs, it was observed that the map was the most monitored page of the three displays. Maps of live airspace are more dynamic and less cluttered than operations or schedule pages. Rather than having to switch modes to look at information on another page, FMs wanted access to operation planning controls and information at their fingertips via the map.
The DSC technique should be viewed as a strategy for organizing qualitative data in a way that creates actionable feedback for stakeholders to consider. DSC has not been formally compared to other qualitative data coding techniques or against validated rating scales or surveys. Consistent with previous qualitative data coding methodology (e.g., Blair, 2015; Linneberg & Korsgaard, 2019), it should be assumed that modifications to the DSC technique will be necessary to meet the needs of different studies and datasets. Future studies implementing DSC should compare their findings to other qualitative data coding techniques and quantitative data.
In conclusion, the NASA developed HDV FMI was used to conduct UAS flight operations in 2023. FM participants were surveyed on their user experience with the FMI, and their open-ended responses were coded with the intent of providing meaningful feedback to FMI designers and developers. Overall, using the DSC technique allowed researchers to develop a rich and detailed understanding of the FMI user experience. By organizing comments into concise, actionable feedback, researchers could systematically produce guidelines to consider when developing future iterations of the FMI.
Footnotes
Declaration of Conflicting Interests
The author(s) declared no potential conflicts of interest with respect to the research, authorship, and/or publication of this article.
Funding
The author(s) received no financial support for the research, authorship, and/or publication of this article.