
Abstract
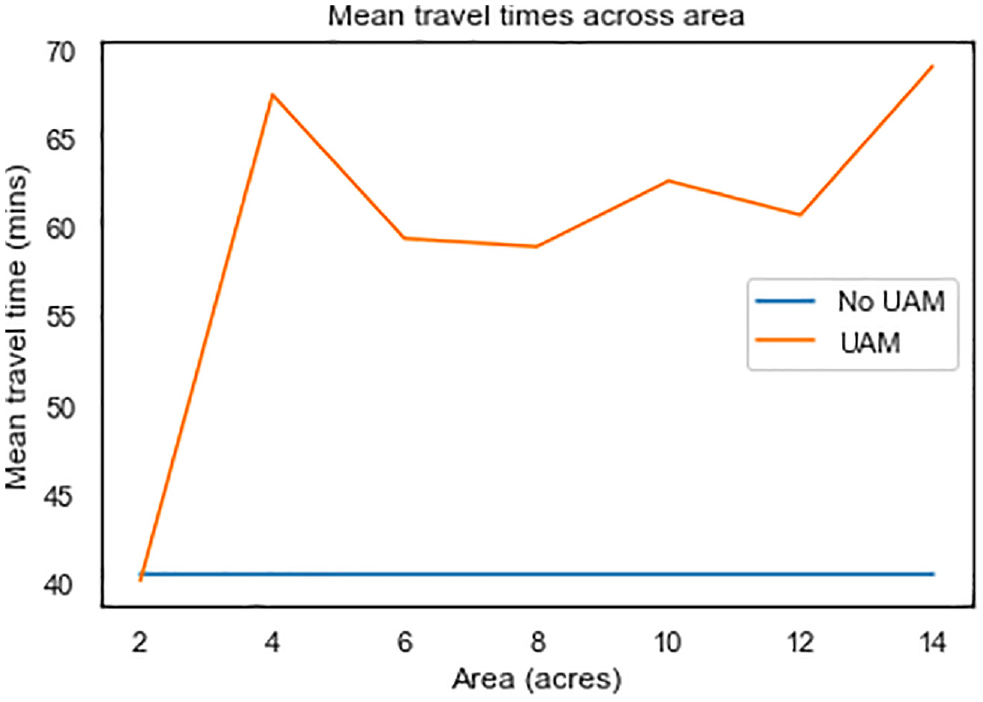
Urban air mobility (UAM) is a concept envisioning safe, sustainable, affordable, and accessible air transportation for passenger mobility, cargo delivery, and emergency management within or traversing a metropolitan area. While the deployment of UAM will require a network of infrastructure (i.e., vertiports), this emerging concept could face a variety of barriers, such as local opposition, infrastructure costs, and multimodal integration. This paper presents a novel simulation methodology using k-medians clustering and sensitivity analysis to model potential vertiport locations in the San Francisco Bay Area. When controlling for land use characteristics (i.e., parcel size and zoning), the simulation and sensitivity analysis finds that as the number of vertiports increases, the average travel times of trips taken by UAM decrease. The analysis also identifies an inflection point of the number of vertiports at which UAM becomes competitive with driving. The analysis concludes that with respect to size, parcels of 2 acres or smaller are the only locations that allow UAM travel times to be competitive with driving. The paper concludes that neither quantitative nor qualitative factors alone will be sufficient to determine the feasibility of vertiports and overcome community concerns associated with vertiport siting. Metropolitan planning organizations, local governments, and other public agencies will likely need to augment technical analysis with robust stakeholder and community engagement throughout the planning process.
Urban air mobility (UAM) is a concept that envisions safe, sustainable, affordable, and accessible air transportation for passenger mobility, cargo delivery, and emergency management within or traversing a metropolitan area ( 1 – 5 ). In recent years, developments in electric and hydrogen propulsion, vertical and short takeoff and landing (VTOL/STOL) aircraft, and other technologies have created renewed interest in on-demand urban aviation ( 1 , 2 ).
While UAM may be enabled by the convergence of many factors, several challenges, including community acceptance, safety, equity, planning and implementation, airspace management, and operations, could create barriers to mainstreaming ( 5 , 6 ). The deployment of UAM will require a network of landing facilities, charging and/or refueling infrastructure, and digital infrastructure for advanced air traffic management. While UAM may be able to use existing helipads initially, growth of the sector will likely require additional facilities for aircraft (e.g., takeoff and landing, parking, and maintenance) and passengers (e.g., waiting, boarding, access, and egress) ( 2 , 7–10). However, establishing new facilities could face a variety of barriers, such as local opposition, infrastructure costs, and multimodal integration ( 5 , 11 , 12 ).
Several market studies conducted before the global pandemic estimate a market potential for UAM passenger service between US$2.8 and US$4 billion in the United States by 2030 ( 13 , 14 ). However, Johnston et al. ( 13 ) and Lineberger et al. ( 14 ) found that limited infrastructure has the potential to constrain the growth of UAM.
Several studies have attempted to develop a standardized classification for UAM takeoff and landing facilities ( 13 , 14 ). Generally, these studies classify three types of facilities, from largest to smallest: 1. vertihubs; 2. vertiports/vertibases; 3. vertipads/vertistations. Table 1, adapted from Cohen et al. ( 5 ), provides additional information on these facilities. Other terms include skyports and aerodromes. UAM may also be able to use existing infrastructure such as heliports, airports, and waterways (for amphibious operations). In this paper, UAM infrastructure will be referred to as vertiports ( 15 ).
Taxonomy and Definitions of Urban Air Mobility (UAM) Infrastructure.
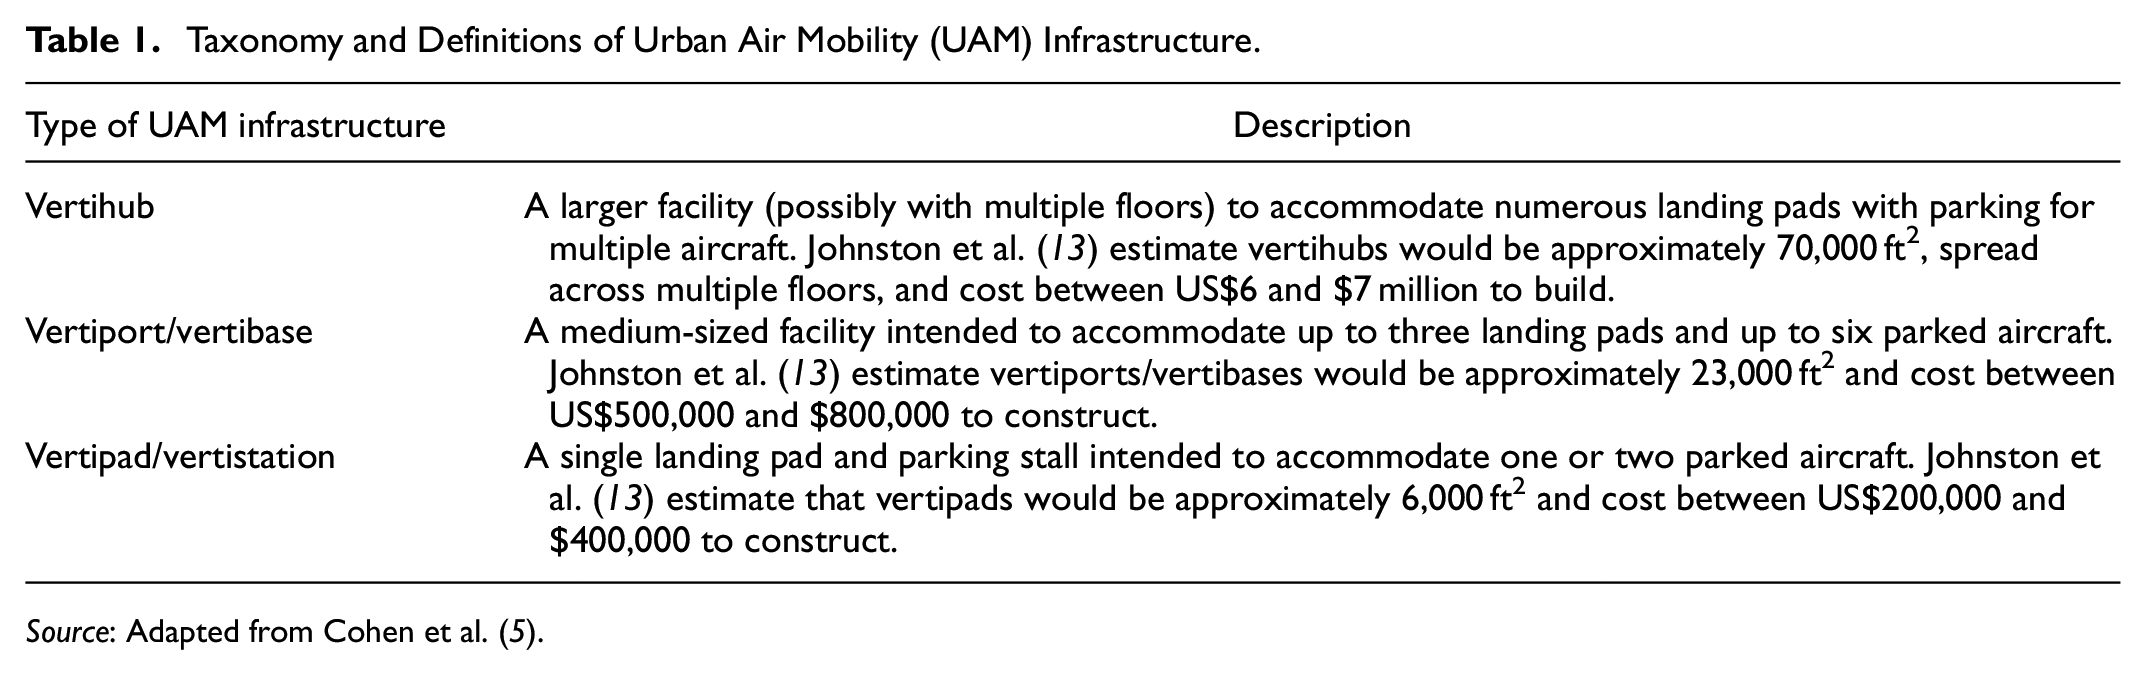
Source: Adapted from Cohen et al. ( 5 ).
The deployment of UAM will require a growing network of vertiports as services are deployed. While UAM may be able to use existing aviation facilities such as helipads and airports, new infrastructure close to traveler origins and destinations will likely be needed to reduce the number of modal connections and travel times associated with first- and last-mile connections to vertiports. In urban centers, this can present several notable challenges caused by limited land for new vertiports, heights of existing buildings that could affect airspace to and from new vertiports, availability of supporting infrastructure (e.g., charging/fueling, information technology, etc.), and the impacts of vertiport operations on surrounding communities. These issues could be magnified if vertiports are exclusively available to one service provider (i.e., exclusive-use) in markets with multiple services. As such, the construction of an urban vertiport network may face several challenges.
In a fully mature network, Johnston et al. ( 13 ) estimate that large cities (e.g., London, New York City, and Tokyo) could require 85 to 100 takeoff and landing pads comprised of three to five vertihubs, 10 to 15 vertiports, and five to 10 vertipads. The study concludes that UAM infrastructure will likely be smaller scale during initial service deployment and will require a combination of private sector investment, public sector subsidies, and non-aeronautical revenue sources (similar to revenue generated by airports from retail, landside access, and other sources) ( 13 ).
Vertiport Siting and Network Design
Several studies qualitatively and quantitatively examine vertiport siting and network design. Fadhil et al. ( 16 ) utilized a weighted linear combination method to identify potential vertiport locations in both Los Angeles and Munich using qualitative data from subject matter experts. Rothfeld et al. ( 17 ) used a similar weighted combination based on qualitative location suitability and a location-allocation optimization algorithm ( 9 , 17 , 18 ). The study used MATSim, an agent-based simulation framework for travel behavior analysis. Daskilewicz et al. ( 19 ) analyzed the spatial distribution of jobs, income, and population in the San Francisco Bay Area and Los Angeles to maximize travel time savings. The study concluded that optimal vertiport locations would likely be in higher income census tracts.
Uber Elevate ( 2 ) developed a k-means clustering method using long-distance Uber rides to identify potential vertiport locations in Los Angeles and London. However, because the study uses proprietary data from one service provider, the results are limited. Bulusu et al. ( 20 ) also used a k-means clustering model to explore the San Francisco Bay Area. However, demand data for the study were not comprehensive for the entire metropolitan region, an important consideration to understand the broader impacts across the transportation network ( 21 ). Lim and Hwang ( 22 ) and Syed et al. ( 23 ) also used k-means clustering in Seoul and Washington D.C., respectively. Both studies found that the location of vertiports is more important than the number of vertiports. One notable limitation of k-means clustering is that vertiport locations are susceptible to outliers, which may place vertiports further away from the majority of demand. If vertiports are further away, then demand for UAM may change altogether. Additionally, some vertiport locations considered suitable in the model may be impractical in the real world when considering noise, equity, and other concerns.
Several studies have found that UAM adoption could be influenced by vertiport placement and feasibility constraints, such as zoning and parcel areas of potential locations ( 4 , 18 , 24 ). Robinson et al. ( 25 ) used vacant land parcel information in South Florida to understand the potential for STOL aircraft. However, the larger parcels required for STOL operations may not be needed for VTOL aircraft ( 25 ). Wu and Zhang ( 26 ) developed a single-allocation hub-and-spoke optimization formulation for Tampa, Florida. The study used LiDAR and geographic information systems (GIS) to identify potential vertiport locations based on available ground spaces and land use restrictions ( 26 ).
Antcliff et al. ( 27 ) suggested that the San Francisco Bay Area could be an early adopter market for UAM because of the high percentage of long-distance or “super” commuters, weather, and geography. In addition, the existence of multiple urban centers in the region tends to result in bidirectional traffic patterns that could reduce “deadhead” flights without paying passengers and improve the operational efficiency and profitability of early operations ( 28 ).
The remainder of this paper is organized into three sections. The next section introduces a novel modeling methodology that could be used to estimate the number of recommended vertiports using fast, high-fidelity, regional-scale microsimulation. The third section highlights the results of the model. The final section concludes with a discussion of limitations of the study and proposes recommendations to help advance UAM infrastructure planning, implementation, and community integration.
Methodology
Vertiport network design requires determination of the location of every vertiport in the metropolitan area with all the other locations of vertiports in mind. This paper presents a clustering algorithm for optimal vertiport locations, based on existing travel demand in the San Francisco Bay Area. These locations are made feasible by introducing land use and zoning constraints. In this section, the microsimulator, street network, demand, network optimization, land use constraints, and overarching simulation procedure are described.
Microsimulator
This paper uses Microsimulation Analysis for Network Traffic Assignment (MANTA), a fast, parallelized, GPU-based regional-scale traffic microsimulator. MANTA can simulate millions of trips along a given street network in only a few minutes, using the intelligent driver model, gap acceptance, and lane changing algorithms to move the vehicles on each edge as they interact with other vehicles ( 29 ). This version of MANTA also leverages a priority queue Dijkstra’s algorithm for the routing of trips. MANTA has been calibrated and validated with open source Uber Movement data ( 29 ).
MANTA is used over existing simulators for several reasons. In transportation simulation, tradeoffs exist across granularity, spatial scale, computational time, and simulator costs. While many simulators exist that satisfy several of these, none is able to satisfy all four to enable quick scenario planning. A high granularity is necessary for UAM analysis because of the sensitivity of UAM demand to variations in travel time ( 2 ). The spatial scale also needs to encompass greater metropolitan regions since UAM is expected to address longer trips by distance and time ( 2 , 4 ). The high granularity and large spatial scales necessary for analysis means that computational times of existing simulators are too long—in the order of days—for fast sensitivity analysis ( 29 ). Since MANTA is a GPU-based simulator, the cost of the processors is also more affordable than more powerful machinery such as high-performance computing architectures, which allows it to be accessible to researchers ( 29 ).
Network
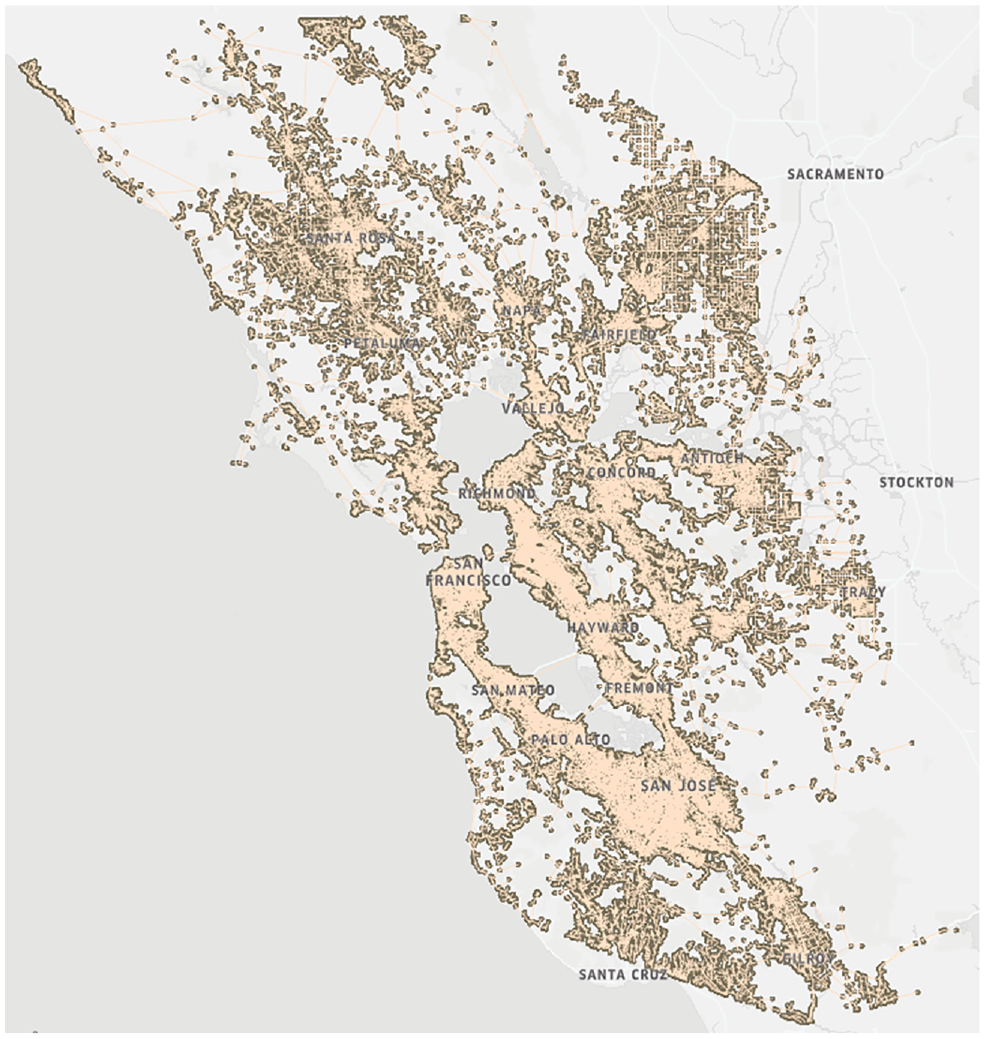
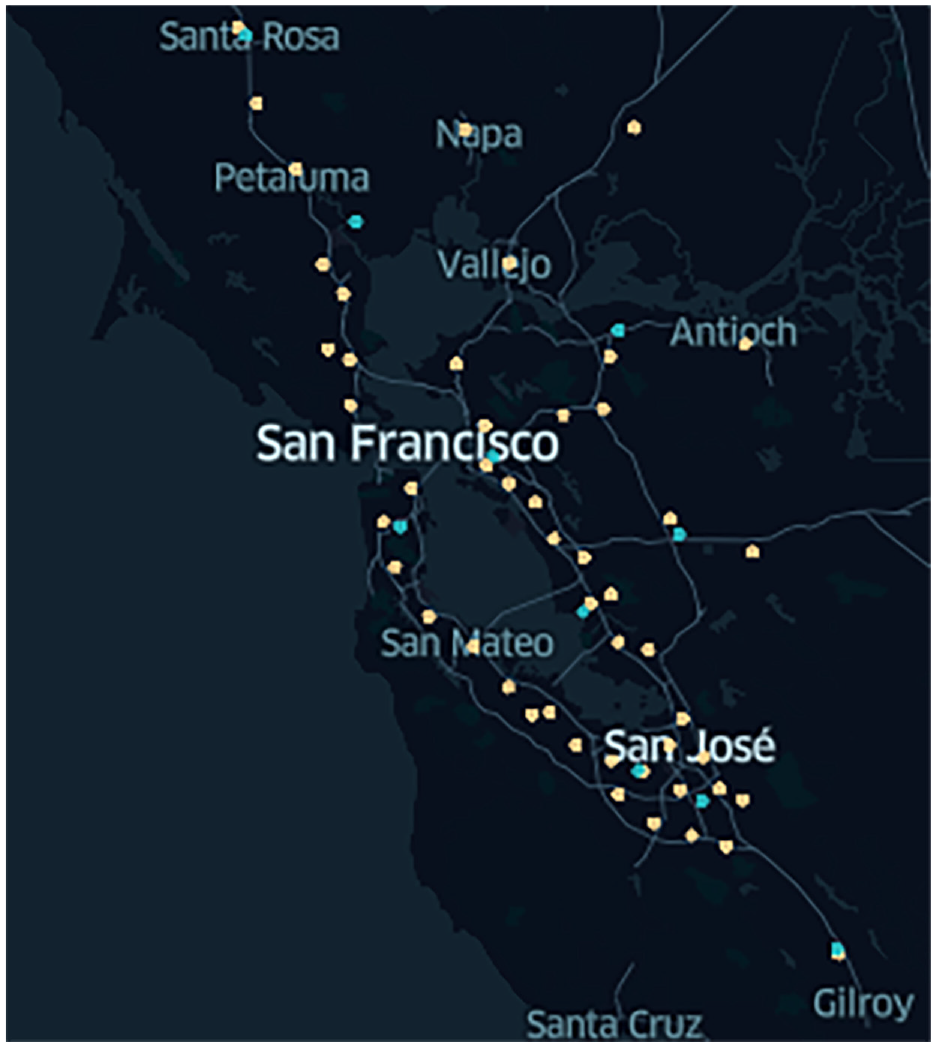
The street network is constructed from the OpenStreetMap (OSM) network of the San Francisco Bay Area using the OSMnx library. The network is cleaned to remove nodes at curves or bends in edges in OSM that are not topologically accurate ( 30 ). The resulting network contains 224,223 nodes and 549,008 edges. The metropolitan region’s nodes are shown in Figure 1.
Demand
This study uses the San Francisco Bay Area Metropolitan Transportation Commission’s (MTC) Travel Demand Model One. The MTC model uses a population synthesizer that locates households based on the 2000 Decennial Census Public Micro-sample, where each traffic analysis zone (TAZ) typically has a similar population and can range from the size of a block to several square miles ( 31 ). It is then validated across years 2000, 2005, 2010, and 2015. Using this behavioral data, this study uses a granular microsimulation that randomly assigns origins and destination, sampled from a uniform distribution, within a TAZ to a network node in that TAZ ( 32 ).
A simplified method is used to determine demand for UAM, by filtering automobile trips with travel times
Network Optimization
The vertiport network design problem can be viewed as an uncapacitated variant of the facility location problem (FLP), a common formulation in transportation and operations research ( 35 ). This problem is uncapacitated because the maximum number of aircraft is not specified for each facility. The objective is to minimize the sum of the distances traveled to and from every traveler’s nearest vertiport, based on every traveler’s origin and destination. The uncapacitated FLP is shown in optimization.


where
In this study, this linear programming problem is reformulated using an unsupervised k-medians clustering approach. Thus, for each cluster, the objective function transforms into Algorithm 1. The first step of the algorithm is to select
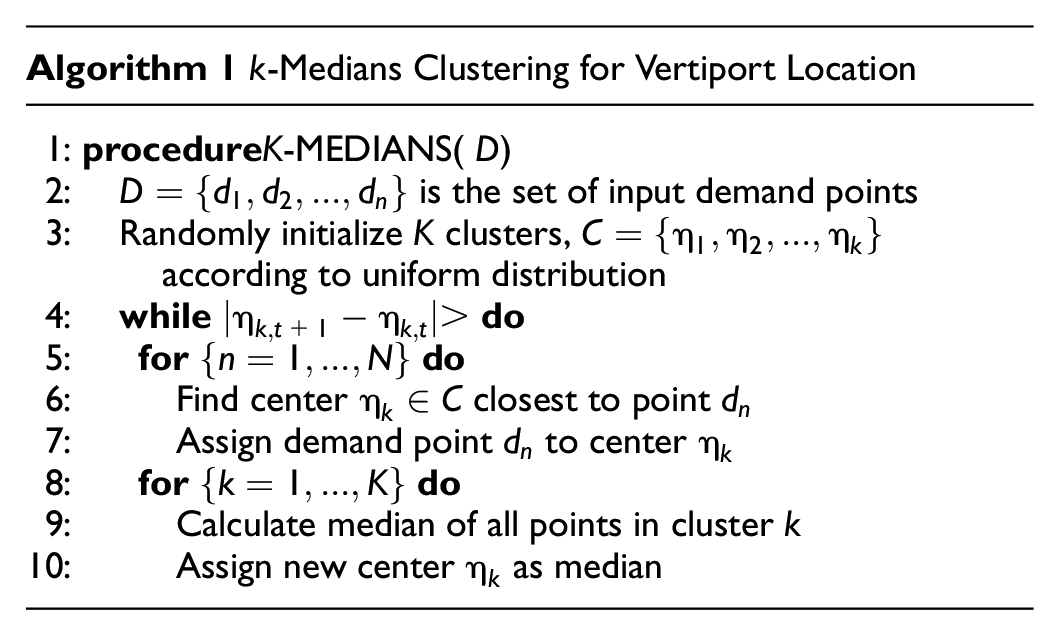
The
Land Use Constraints and Parcel Assignment
As previously discussed, land use and zoning requirements can limit vertiport placement ( 32 ). To plan a vertiport network, additional factors should be considered in addition to UAM demand. A holistic optimization must be executed to understand not only what is efficient, but also what is possible.
Using parcel level data from the San Francisco Bay Area, land use is constrained to parcels that are zoned office or mixed-use office space, light and heavy industrial (including warehouses), retail, and parking structures ( 2 , 12 , 37 ). These parcels are believed to have compatible zoning for vertiports and minimum requirements that allow for takeoff and landing operations at a feasible scale. The nearest vertiport parcels that satisfy these land use constraints are assigned using a fast BallTree nearest neighbor search. This technique recursively divides the data into nodes defined by a centroid to perform a single distance calculation for lower and upper bounds ( 38 ). The decision was made to exclude constrained parcels in the linear program for clarity of the formulation’s results, specifically that the parcels chosen are simply the closest in distance to the nodes that are output from the formulation; however, additional research could consider this different formulation. Additional enhancements could include the inclusion of available parcels and their associated land uses, and other constraints, such as noise, airspace, and infrastructure availability, in the linear program.
Additionally, the parcels that support larger vertiports are also considered. Cohen (
39
) suggests that the area needed for helicopter takeoffs and landings should be
Simulation
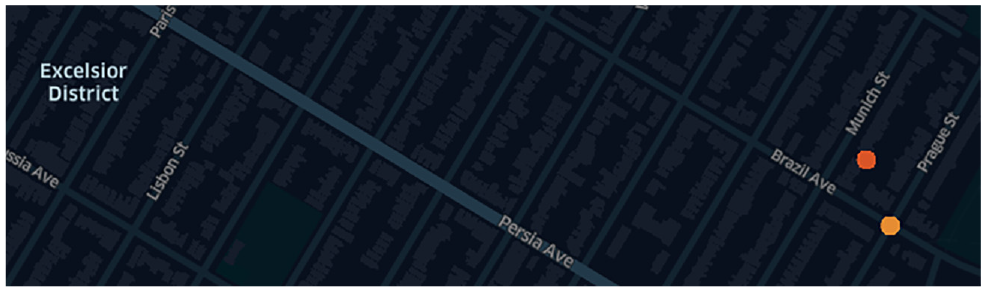
After potential eligible vertiport parcels are identified, the model simulates how the parcel locations may affect travel behavior. The nearest node to each vertiport parcel is used as a proxy point for later input into the MANTA traffic microsimulator; refer to Figure 2 for an example. Trips that have the same origin and destination vertiports are eliminated and assumed to be a driving trip (e.g., the trip is too short to be served by UAM). The subsequent analysis assumes that the remaining eligible trips have been assigned as UAM trips.
The demand used in the original ground travel simulation run in MANTA is parsed into trips from (i) the origin to its nearest origin vertiport, (ii) the origin vertiport to the destination vertiport, and (iii) the destination vertiport to the destination. The travel time of the first leg from the origin to the nearest vertiport is computed with an initial run in MANTA. The travel time from vertiport to vertiport is calculated using the Haversine distance, which is the great-circle distance between two points on a sphere given their longitudes and latitudes. The aerial travel time is then calculated assuming a flight speed of 150 mph ( 2 ). The travel time from the destination vertiport to the final destination is then simulated in MANTA. To calculate an accurate departure time for those trips requires both the previous legs’ travel times and estimated transfer delays at the vertiports, as shown in Equation 2.

where
Modeling Results
This section details the results from both the clustering and the simulation processes. The clustering process determines the location of the vertiports from the k-medians algorithm, and then maps that parcel to the nearest feasible parcel—and subsequently, node—based on the land use constraints. The regional-scale simulation uses the MANTA traffic microsimulator to calculate the final congested travel times of each driving and multimodal UAM trip.
Clustering
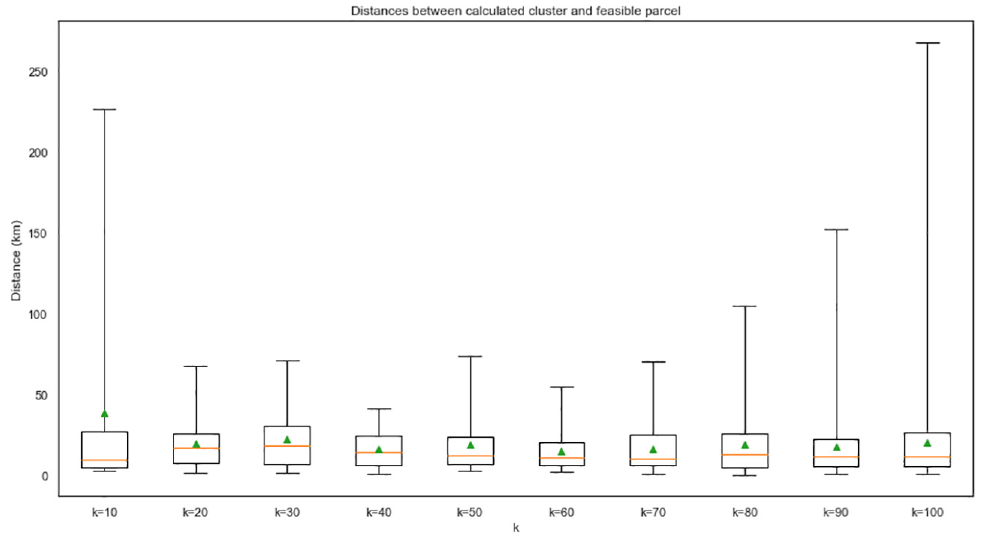
Because of the randomization of the initial points, several trials are run to determine the final convergence points for the
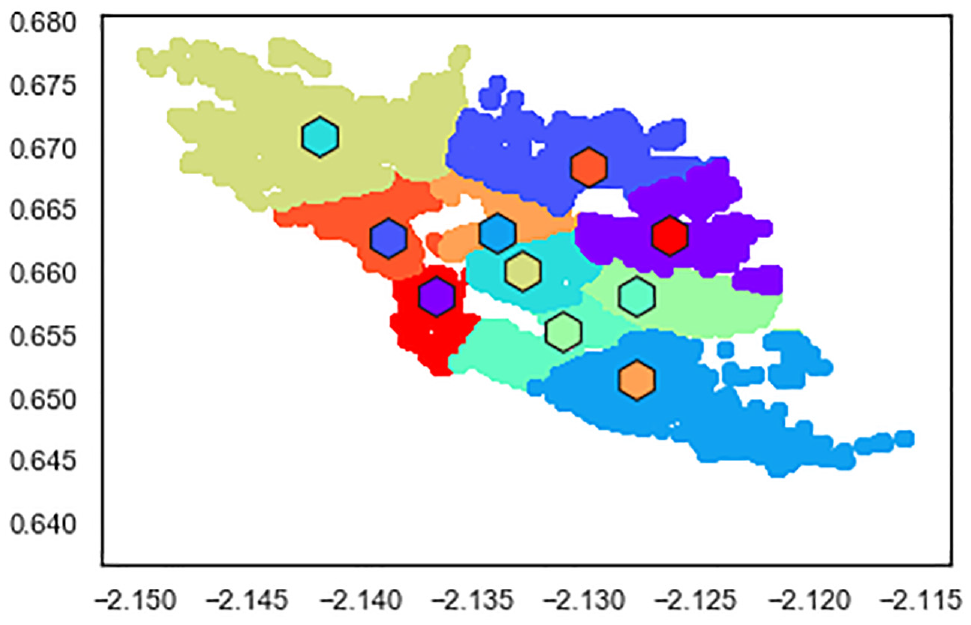
When
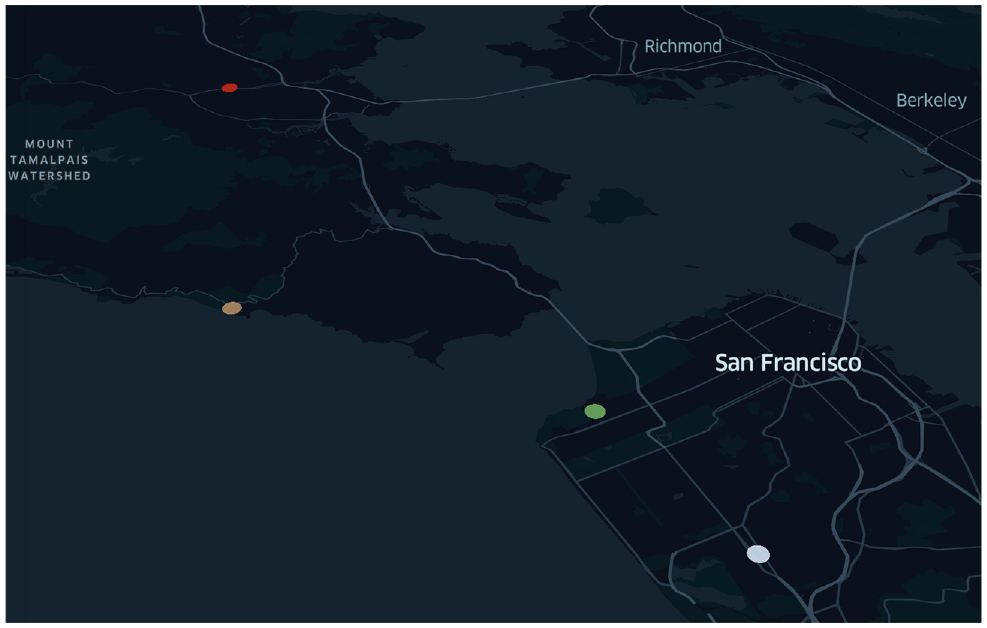
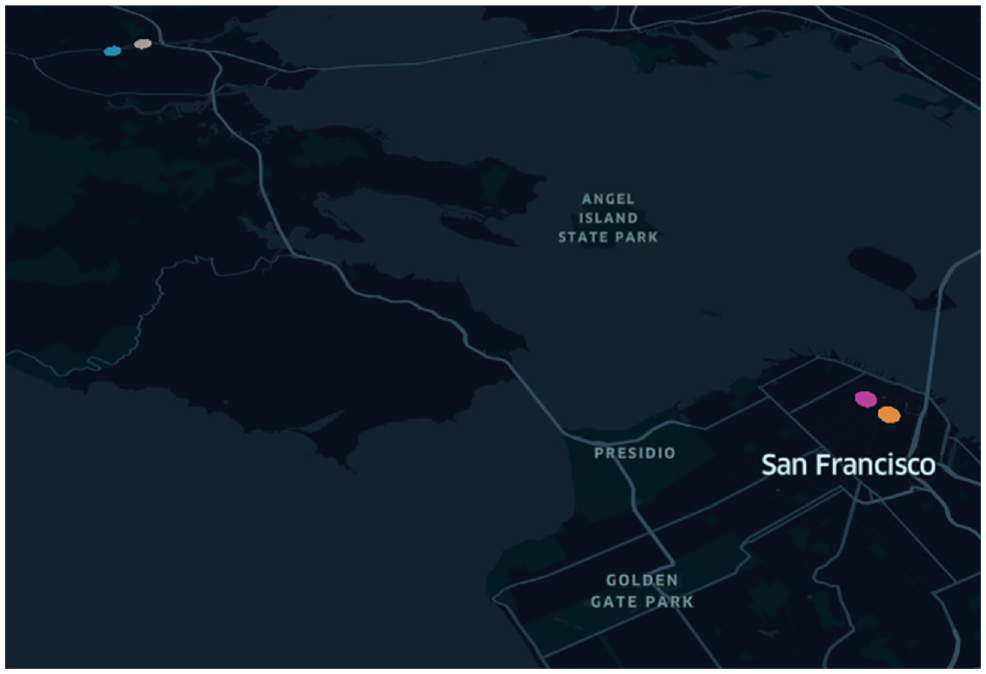
While a greater number of vertiports may reach more potential users within the shortest distance from a vertiport, many of the initial cluster points found are similar but simply farther from usable parcels. This suggests that land use patterns may be similar across localities. Resulting vertiport parcels are shown in Figure 5 for k = 10 and k = 50.
In Figure 5, k = 10 creates a sparse network while k = 50 creates a much denser network of vertiports. When
From these parcels and the calculated departure and travel times for UAM trips, the model simulates the UAM trips using MANTA.
Simulation
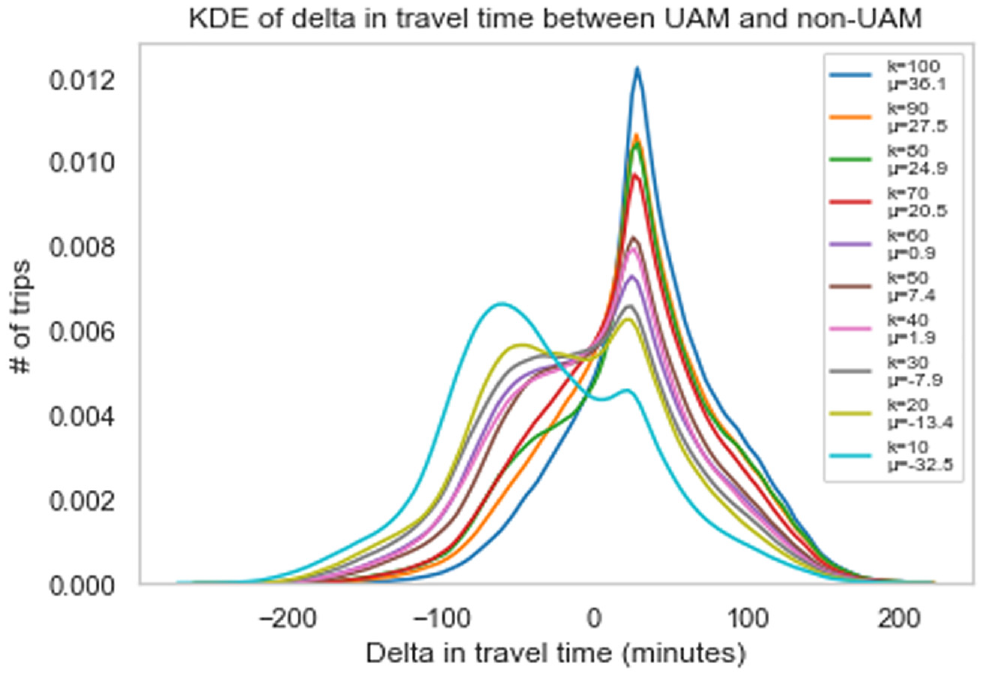
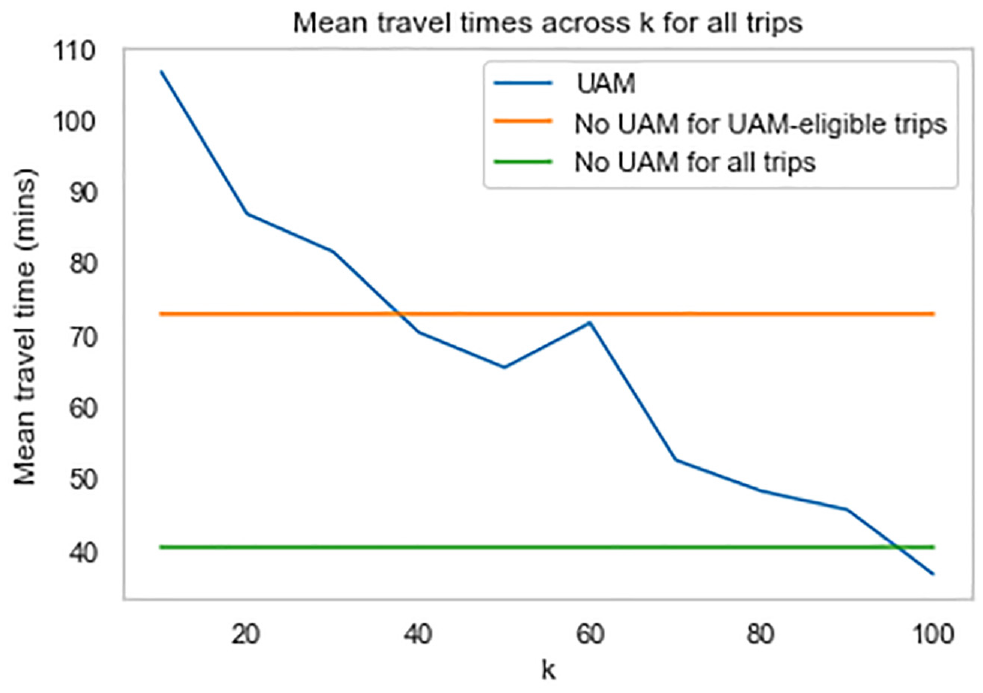
Several analytical assessments are made from the simulator outputs. The first explores average UAM travel times across
The kernel density estimation of the time deltas between the UAM and non-UAM scenarios across
Even using Marchetti’s Constant, not all trips would logically be assigned to UAM. Figure 8, where
On the other hand, an example of a UAM trip with a travel time shorter than driving is shown in Figure 9, where
The second assessment is to understand how area constraints of the parcels affect vertiport locations and subsequent travel times. Given
Limitations and Future Work
Several limitations exist in the model. The first is the aerial travel time assumption, which currently is computed by a Haversine distance metric and a static assumption of aircraft speed at 150 mph. As of May 2021, there were over 200 aircraft under development, and the average speeds of these aircraft are unknown. The precise times of each component of the flight, such as takeoff, cruise, and landing are also not considered ( 45 ). In addition, precise flight trajectories that consider collision avoidance and weather are not incorporated. Ongoing work includes the integration of accurate uncrewed aerial simulation ( 46 , 47 ).
Another limitation is the assumption of fixed 10 min transfer times at the vertiports. In actuality, transfer times will likely vary based on the size and location of a vertiport. For example, it may take passengers longer to board and disembark at larger and more congested facilities. Because this could affect the comparative travel times between UAM and other modes of transportation, methodological advancements should attempt to estimate the time of the boarding, disembarkation, and transfer process more accurately based on the number of flights and passenger volumes at proposed vertiports ( 9 ).
The third limitation is the assumption of Marchetti’s Constant, which may not always accurately reflect actual traveler behavior ( 48 ). Efforts to replace Marchetti’s Constant involve UAM activity-based specifications to reflect more accurate individual behavioral patterns. This will allow for more accurate multimodal mode shares, as the model currently compares UAM with driving rather than with all modes in the transportation network (e.g., public transit, biking, transportation networking companies, etc.). Several studies have already looked into this ( 9 , 26 , 49 ).
Another limitation is that the travel time analysis does not assume dynamic traffic assignment, where vehicles may change their routes in the middle of the trip or because of more recent congestion before embarking on the trip. This is currently an ongoing improvement in MANTA.
An important consideration for future work is to generalize the methodology for other metropolitan areas. The San Francisco Bay Area has a strong central business district in San Francisco as well as several other large economic centers throughout the region (e.g., San Jose/Silicon Valley, Oakland, Tri-Valley, etc.). These economic centers contribute to several region-specific multidirectional travel patterns. As a result, the results of this study could be applied to metropolitan areas with both one large center (i.e., monocentric regions) and many multiple centers (i.e., polycentric regions) ( 50 , 51 ). The San Francisco Bay Area also has several air traffic control and infrastructure restrictions, which were not considered in this study but could be analyzed as part of future research.
Additional work should also consider the cost of UAM which can affect mode choice ( 26 , 52 , 53 ). Currently, the model may overestimate demand if UAM is more expensive than driving. Although more complex models are needed to compare UAM mode share alongside not only privately-owned vehicles but shared vehicle fleets (e.g., transportation network companies and automated taxis), the current model provides a methodological framework for commencing exploratory analysis.
Conclusion
While federal preemption currently governs most aspects of UAM regulation, establishing new UAM infrastructure is one area where local and regional governments will play an important role. While local governments cannot limit where UAM operates in the airspace, they can effectively limit where UAM aircraft take off and land through the zoning and siting of vertiports. As such, land use planning, zoning, and regulation represent important tools that local governments can use to either support or hinder the growth of UAM.
Using a case study of the San Francisco Bay Area, this paper presents a vertiport design and network simulation tool to understand the travel time effects of UAM vertiport networks in the San Francisco Bay Area under specific land use constraints. Given demand data at the zone level (further granularized to the node level) and extensive land use data at the parcel level, different UAM networks are developed with a varying number of vertiports and parcel constraints. These different configurations are developed using k-medians clustering and graph theoretic nearest neighbors. The vertiport locations are then integrated into the fast, parallelized GPU-based MANTA traffic simulator to understand travel times of UAM compared with driving. At
While quantitative methods are an effective tool for assessing the technical viability of vertiport concepts, community engagement and local policy will be important to help understand and address potential community concerns, such as noise, aesthetics, traffic congestion, equity (i.e., displacement and gentrification), safety, and others. Community engagement will be an essential part of understanding and mitigating the adverse impacts of vertiports on vulnerable populations and communities. As part of the vertiport planning process, communities may consider embedding public participation and engagement at multiple stages. As part of long-range planning, public engagement could help communities understand if UAM is an appropriate strategy. Communities could conduct exploratory scoping to understand potential UAM demand and locations that could be compatible for vertiports. As the planning process progresses, communities may pivot toward more in-depth engagement processes that empower stakeholders to understand local concerns and use a variety of techniques to vet vertiport concepts and alternatives. If or when a developer decides to build a vertiport, additional community engagement is recommended and may be statutorily required by local, state/provincial, and federal laws.
Given the potential for UAM to grow over the next 10 to 20 years, communities will need to consider multimodal integration, surface transportation access, and the potential impacts of UAM. In the future, a network of vertiports has the potential to decentralize the impacts of aviation that have typically been limited to airport facilities and their immediate surroundings. Long-range planning and community engagement will likely require close collaboration between aviation and community stakeholders. Understanding the role of the built environment and its relationship to vertiport placement may also be important to integrating with nearby land uses and prioritizing sustainable mobility. As the UAM marketplace continues to evolve, community planning, public outreach, and continued research will be important to understanding UAM’s impacts on the transportation ecosystem and to balance community goals with commercial interests.
Footnotes
Acknowledgements
The authors would like to thank Dr Paul Waddell and Max Gardner of the Urban Analytics Lab at University of California, Berkeley for their assistance with advising and data procurement, respectively. The authors would also like to thank Dr Raja Sengupta and Emin Burak Onat of the Cal Unmanned Lab at University of California, Berkeley for their support. Finally, the authors would like to thank NASA and the NASA market study strategic advisory group for their support of this work.
Author Contributions
The authors confirm contribution to the paper as follows: study conception and design: P. Yedavalli, A. Cohen; data collection: P. Yedavalli; analysis and interpretation of results: P. Yedavalli; draft manuscript preparation: P. Yedavalli, A. Cohen. All authors reviewed the results and approved the final version of the manuscript.
Declaration of Conflicting Interests
The author(s) declared no potential conflicts of interest with respect to the research, authorship, and/or publication of this article.
Funding
The author(s) received no financial support for the research, authorship, and/or publication of this article.