
Abstract
Eco-feedback has been demonstrated as an effective strategy to promote energy-saving behavior among occupants in buildings by providing real-time or historical information on energy consumption and environmental impacts. However, the application of eco-feedback in academic buildings for space choices is limited. In this study, we explored the impact of providing eco-feedback on occupants’ space choices in university Activity-Based Workspaces (ABW), where individuals select their workspaces using an online booking system. We designed two user interfaces: one baseline interface with no eco-feedback, and also an intervention interface that included eco-feedback. A within-subject user interface evaluation study was conducted, and the results suggest that eco-feedback significantly motivates occupants to select highly eco-friendly spaces (p-value < .05). Consequently, providing eco-feedback in university ABW environments can encourage more eco-friendly and sustainable decision making and has the potential to reduce the contribution of buildings in energy-related carbon emissions.
Introduction
Occupants are the primary consumers of energy in buildings because they behave proactively within their indoor environments to seek comfortable personal conditions and to perform energy-related tasks (Janda, 2011). Therefore, occupant behavior (OB) has a significant impact on building energy consumption (Paone & Bacher, 2018; Zhang et al., 2018), and changing occupant behavior is crucial for achieving energy saving and reducing the energy-related environmental impacts (Chen et al., 2021; Paone & Bacher, 2018). Human-building interaction (HBI) researchers employed strategies that influence building occupant behaviors including eco-feedback (Gulbinas & Taylor, 2014; Jain et al., 2013), social interaction (Peschiera et al., 2010), and gamification (Konstantakopoulos et al., 2019). Conclusions highlight eco-feedback as an effective and immediate way to positively promote change of occupants’ behaviors and reduce energy consumption (Fischer, 2008; Paone & Bacher, 2018). Eco-feedback systems provide building occupants with information regarding their historical or current energy consumption with a goal of improving occupants’ energy-saving, eco-friendly, and sustainable behaviors (Fischer, 2008; Paone & Bacher, 2018). Although numerous studies provided occupants with eco-feedback in residential buildings and achieved a significant reduction in energy consumption (Agarwal et al., 2023), research indicates that people in office and academic buildings behaved less sustainable than in residential counterparts (O’Brien & Gunay, 2014). Encouraging energy-saving behavior in workplaces can be challenging due to the absence of direct financial incentives, limited access to information about their energy consumption levels, and limited control over building systems and operations (Carrico & Riemer, 2011). Additionally, in these buildings, most eco-feedback systems do not usually focus on individual choices that occupants make, or in other words they usually present aggregated information instead of breaking down the information to specific moments of choice (Carneiro et al., 2019). Additionally, visualizing energy consumption information for room lighting in office buildings was shown to significantly changed participants’ initial room choices compared to scenarios focusing solely on room lighting visualization (Carneiro et al., 2019).
Within academic buildings, one of the important moments of choices for occupants, especially students, is finding a suitable space for various tasks, including individual or group studies and group projects/meetings. In recent years, the adoption of Activity-Based Workspaces (ABW) enhances this experience by providing flexible spaces where occupants have no assigned seats and are allowed to choose their seats and spaces based on their work tasks and needs through online booking or on a first-come, first-served basis such as meeting rooms, study rooms, lounges, and laboratories (Masoudinejad & Veitch, 2023). Occupants have different preferences for choosing these spaces (Babapour Chafi et al., 2020), with limited research examining how providing eco-feedback, along with other information about the spaces at the moment of choosing ABW, can influence preferences and selections. To address this research gap, we focused on providing eco-feedback for an online space booking system in an academic building. In this setting, students can make online reservations for ABW for activities, including individual study and group meetings. Students have access to information regarding room capacity, available time slots, and the setpoint temperature of the rooms. Our goal is to compare user interfaces with and without eco-feedback to evaluate if providing eco-feedback influences the specific ABW and time slots that are selected by students in a room reservation system. Therefore, we hypothesized that providing eco-feedback will increase the likelihood of selecting higher eco-friendly time slots for the purpose of group meetings and individual study reservations.
Method
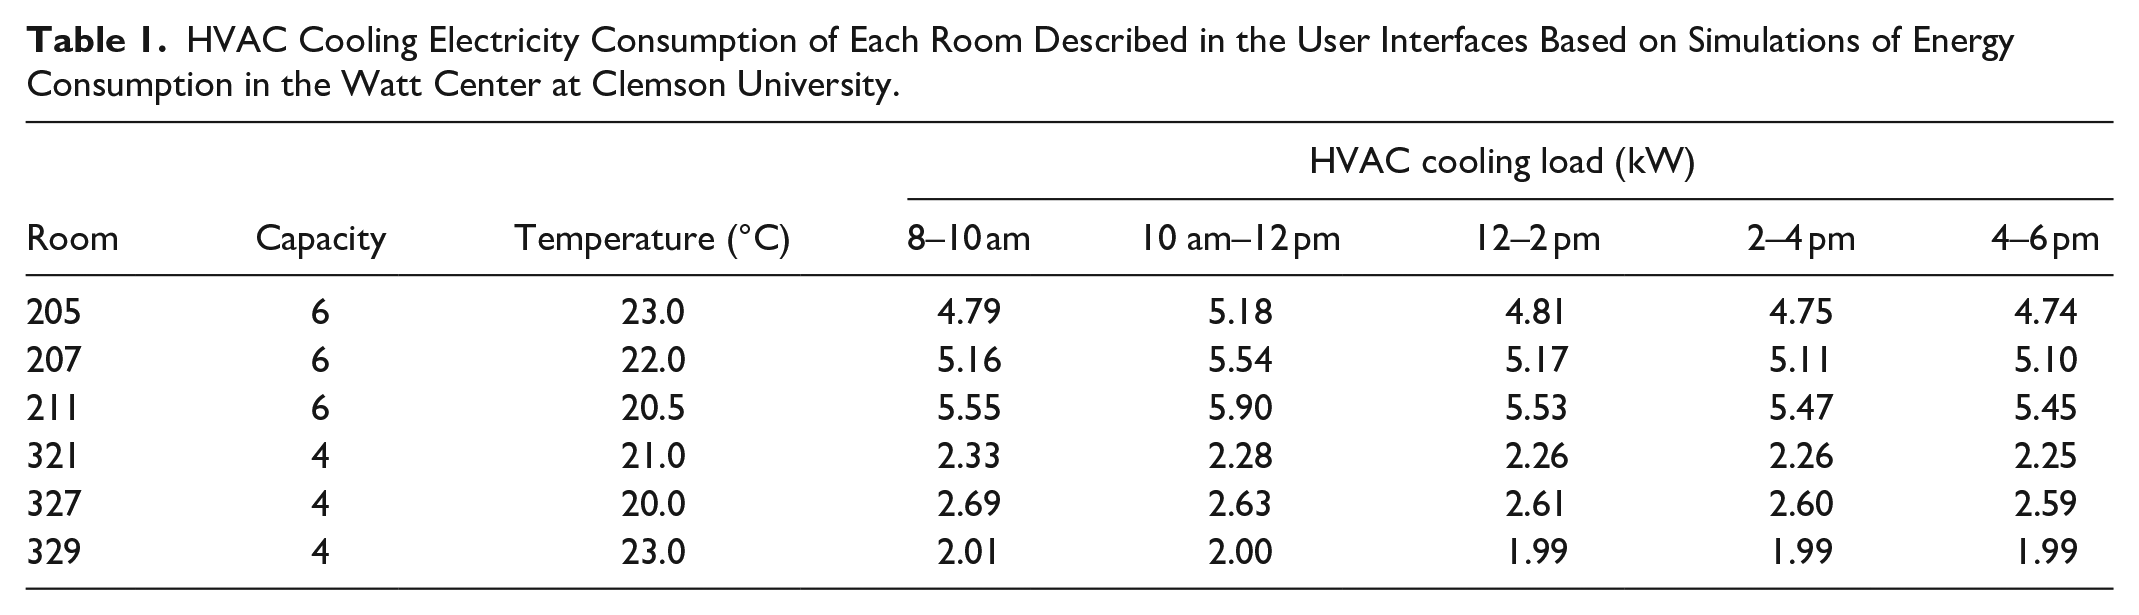
For this study, Watt Family Innovation Center (WFIC) at Clemson University in South Carolina, USA was selected as the testbed academic building because it maintains reservable student spaces. These spaces can be reserved for group meetings and individual study purposes. For this study, six project rooms were examined for booking during a spring semester. Using simulation software IES VE (Integrated Environmental Solutions: Virtual Environment (IESVE, 2023)), the energy consumed by heating, ventilation, and air conditioning (HVAC) systems for cooling load was calculated based on each room’s setpoint temperature and other features (e.g., capacity, and location in the building) for every 2 hr (see Table 1). Energy consumption due to using amenities and lighting is not considered, as the rooms have identical amenities and lighting systems, resulting in the assumption of uniform electricity usage across all rooms.
HVAC Cooling Electricity Consumption of Each Room Described in the User Interfaces Based on Simulations of Energy Consumption in the Watt Center at Clemson University.
In the next step, two different user interfaces for booking rooms with and without eco-feedback designed using Figma (Figma, n.d.). Approval for human subject experiment was obtained from Clemson University Institutional Review Board (IRB2022-0767) prior to recruiting participants.
Participants
Participants were required to be over 18 years old and required to be able to read/write in English. All participants were recruited through academic program email lists and thus, all participants were students. In total, there were 21 participants in this study, including 13 males and 8 females. Among them were 14 graduate students and 7 undergraduate students. Participants were recruited via email announcements and were compensated with a $15 Amazon gift card for their time in the study.
Designing User Interfaces for Space Booking
Since the aim of this study is to explore the influence of eco-feedback on students’ space booking behavior, we have included temperature and capacity information in the baseline space booking system with all time slots available for booking. This enables us to evaluate how occupants’ booking behavior may be changed after being exposed to eco-feedback. Figure 1 illustrates the baseline user interface utilized for space booking in this study and displays the room temperature information through color coding, where red indicates a temperature above the building’s average, orange represents the average temperature, and blue signifies a temperature below the building’s average. Temperature is included in baseline because thermal comfort is one of the most crucial factors influencing indoor environmental quality (IEQ) in workspace choices (Candido et al., 2019), and thermal satisfaction has a positive effect on productivity (Geng et al., 2017). Additionally, the eco-feedback provided for different time slots is based on the energy consumption required to maintain the rooms at those temperatures.
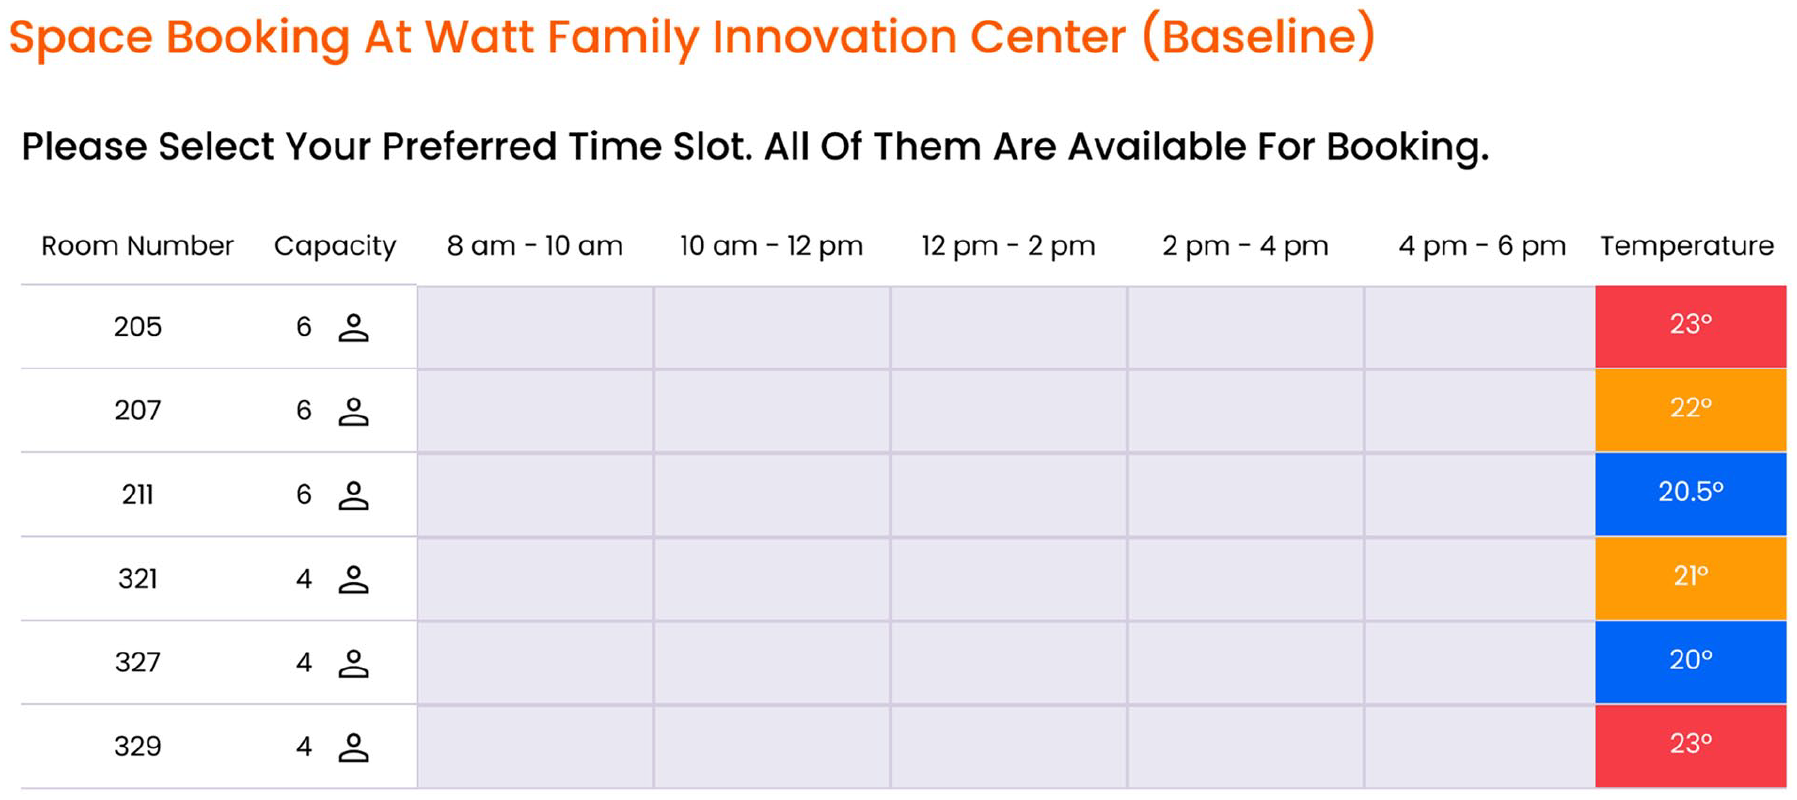
Baseline user interface design.
It is well documented that feedback must match the processing requirements of the task (Atkins et al., 2002). Within the domain of eco-feedback design, it has been shown that the information content and information representation are two crucial elements (Francisco et al., 2018; Jain et al., 2013). For example, it is shown that users have limited understanding of the kilowatt-hours (kWh) or CO2 emissions units (Bonino et al., 2012). To increase comprehension of environmental impacts of energy consumed we used a leaf icon (Morreale et al., 2015), where the number of leaves indicates its environmental friendliness in the interventional interface (see Figure 2). We established three distinct intervals based on energy consumption values that were calculated from the energy consumption simulation. The first 15% of values (1.99–2.57 kW) correspond to the lowest energy consumed, signifying a high level of eco-friendliness. Subsequently, the following 70% of values (2.57–5.31 kW) indicating moderately eco-friendliness, while the final 15% (5.31–5.90 kW) represent the highest energy consumption, reflecting a lack of eco-friendliness. Therefore, we have three labels of “not eco-friendly,” “moderately eco-friendly,” and “highly eco-friendly” to these time slots. Time slots labeled as “not eco-friendly” are represented by no leaf, time slots labeled as “moderately eco-friendly” are represented by one leaf, and time slots labeled as “highly eco-friendly” are represented by two leaves (see Figure 2).
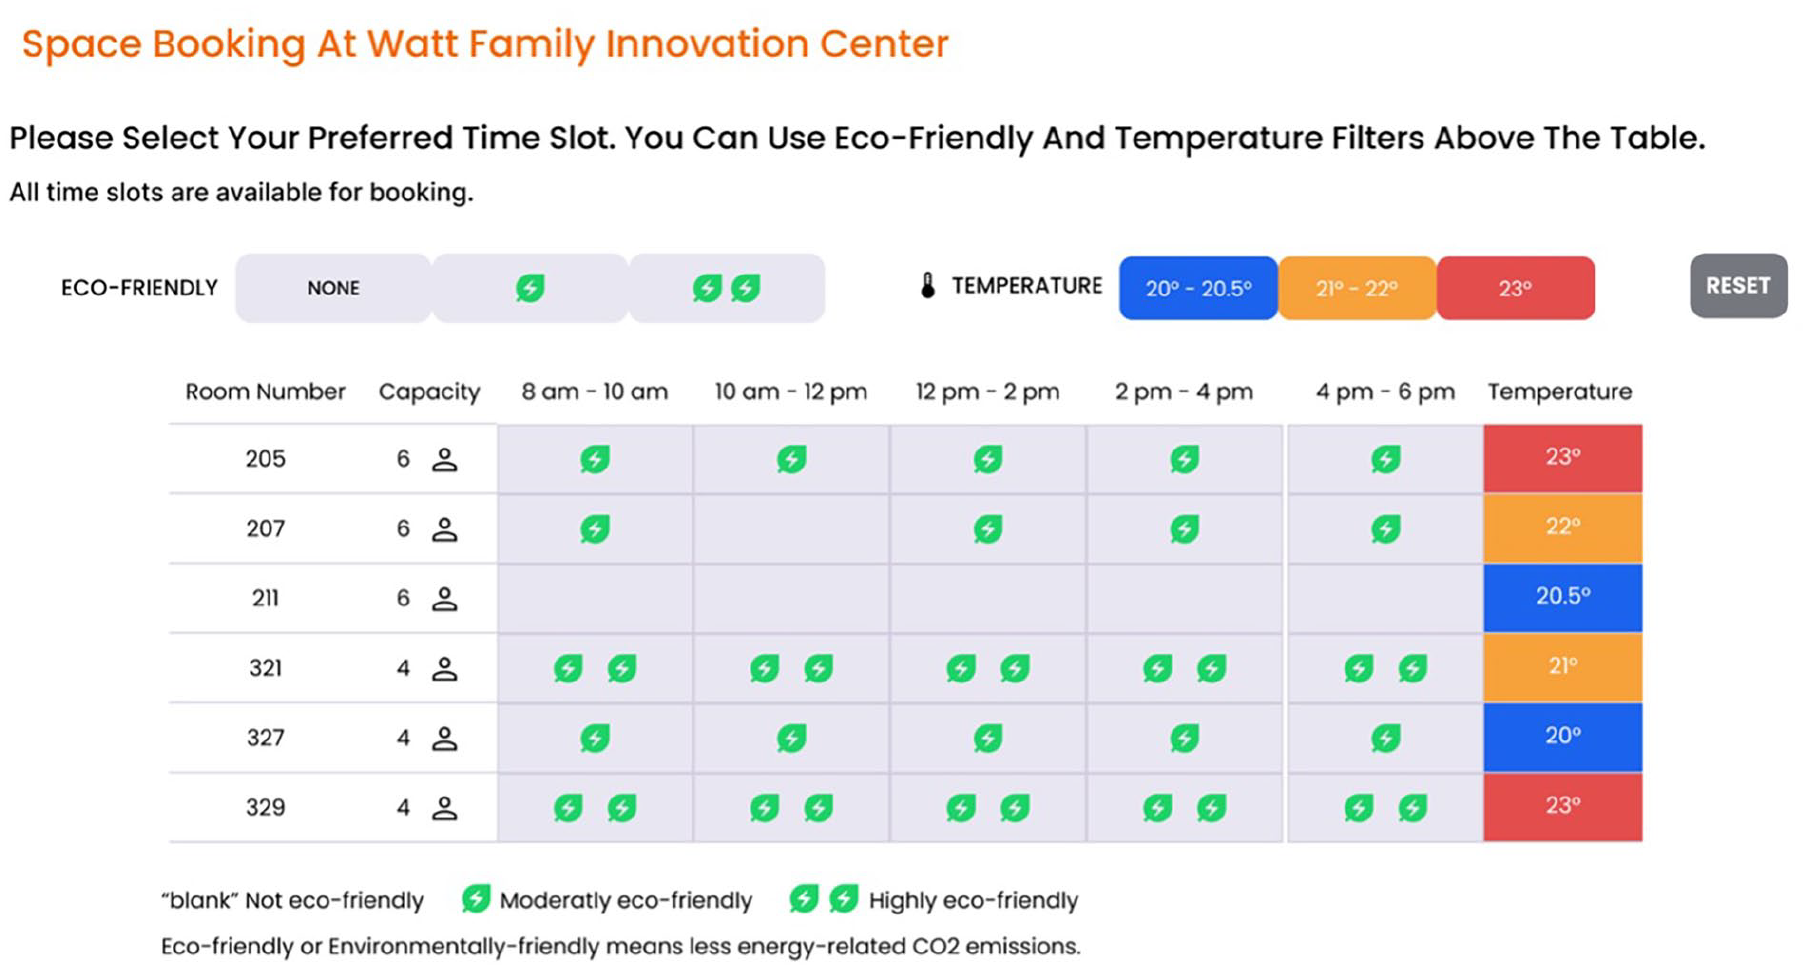
Interventional user interface design incorporating eco-feedback.
Experimental Procedure
This study employed a within-subject design in which each participant was exposed to two different user interfaces for booking space. The experiment took around 20 min and was completed in the semi-private office space in a different building. Participants voluntarily participated in this study, and the recruiting email did not mention that the study would focus on environmentally friendly behavior to not influence the study. Participants started with a pre-experiment survey about their experiences with online room booking across campus. The baseline interface was then provided to the participants (see Figure 1). Participants were asked to select time slots for a 2 hr group meeting involving four individuals, as well as for a separate 2 hr individual study session. To minimize bias and to control for potential order effects, ten participants were asked to book for a group meeting first, while eleven were asked to book for individual study first. Participants were given the freedom to select the same time slots for both activities, without any restrictions. Participants were then presented with the interventional user interface that contained the eco-feedback (see Figure 2). Although the interventional interface has a detailed legend, we briefly explained what the leaf symbol represented and asked participants to book time slots for a 2 hr group meeting of four people and a separate 2 hr individual study session with the same order as they were asked with the baseline interface. At the end, we asked participants to complete a post-experiment survey about the design and content of the interventional and baseline user interfaces.
Results
The pre-experiment survey discovered that 86% of the 21 participants had prior experience using the project rooms at WFIC. Figure 3 displays selected time slots as chosen by participants using two different user interfaces (baseline and interventional). Notably, 23% of participants changed their initial selections after being provided with eco-feedback. The results demonstrate a 100% decrease in the number of no-leaf time slots, a 35% reduction in the number of one-leaf time slots, and a 61% increase in the number of two-leaf time slots in total for both scheduling purposes. These results provide convincing evidence that eco-feedback can positively influence decision-making towards more eco-friendly choices, as all participants either made more eco-friendly or maintained the same choices after receiving the feedback, and no participants made less eco-friendly choices afterwards. However, it is valuable to provide statistical evidence of this as well.
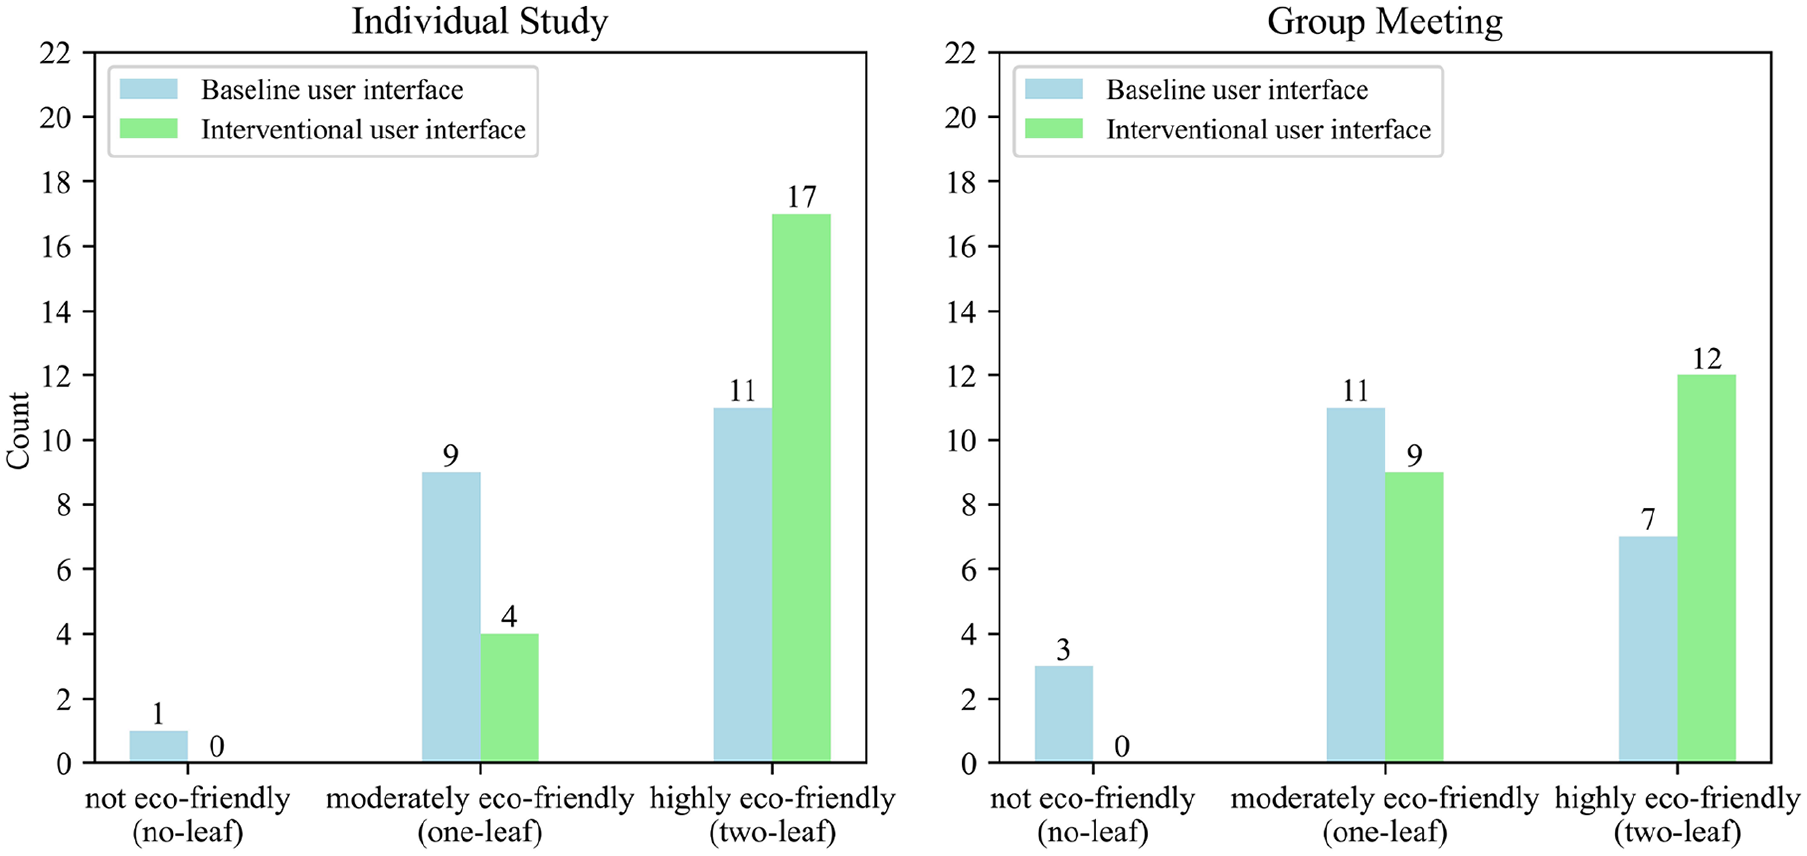
Number of selected time slots based on eco-friendliness level chosen in baseline and interventional user interface.
The dependent variable in this study is the level of eco-friendliness of booked time slots which is ordinal, and consisting of three levels: not eco-friendly, moderately eco-friendly, and highly eco-friendly. Thus, ordinal logistic regression (OLR) was adopted (Kleinbaum & Klein, 2010; Talebi et al., 2024). The main advantage of this method is that it does not assume equal spacing between the levels of the response variable (Harrell, 2015), meaning that the values we assign to the eco-friendliness levels will not impact the overall results of the occupant behavior. One of the independent variables in this study is the user interface used for space booking with two fixed levels (baseline without eco-feedback and interventional with eco-feedback). Moreover, in our study participants conducted multiple tasks (individual vs. group scheduling) on multiple interfaces. In a typical regression model, this would violate the independence assumption, since there are dependencies between observations that originate from the same participant. Given this repeated measure design, participants are considered as another independent variable with random effects. When both fixed effects and random effects are included in the model, it is referred to as a mixed-effects model, which enables the prediction of dependent variables in the presence of correlated observations (Vermunt, 2005). Consequently, the most suitable model for our study is an ordinal logistic mixed-effects model as presented below:

i = 1, . . .,84, j = 1,2
Where:
Yi Dependent variable for ith observation
ecoi Independent variable with fixed effects for ith observation, it has two levels: without eco-feedback, with eco-feedback
pidi Independent variable with random effects for ith observation, it is the subject ID from 1 to 21 (21 participants). It is assumed that the subject effects are I.I.D. ~N(0,
θj Threshold parameters between the ordinal categories of the dependent variable
i Index for observations from 1 to 84 (there are 21 participants who utilized two different user interfaces for two scheduling purposes, resulting in a total of 84 observations.)
j Index for response categories
This is a model for the cumulative probability of the ith booked time slot falling in the j th category or below and is fitted using the clmm2 function available in the ordinal package in R. To test the hypothesis and obtain an unbiased estimate of the p-value, we compared Model #1 against a baseline model without the eco variable, that is, it only includes the intercept term and random effects of subject and conducted likelihood ratio test using the ANOVA method to determine whether Model #1 significantly improves the model fit. The results in Table 2 (first row) show that Model #1 which includes eco variable, provides a significantly better fit to the data than baseline (p-value < .05).
Comparison of the Model Fit Between the Full Model and the Reduced Model.
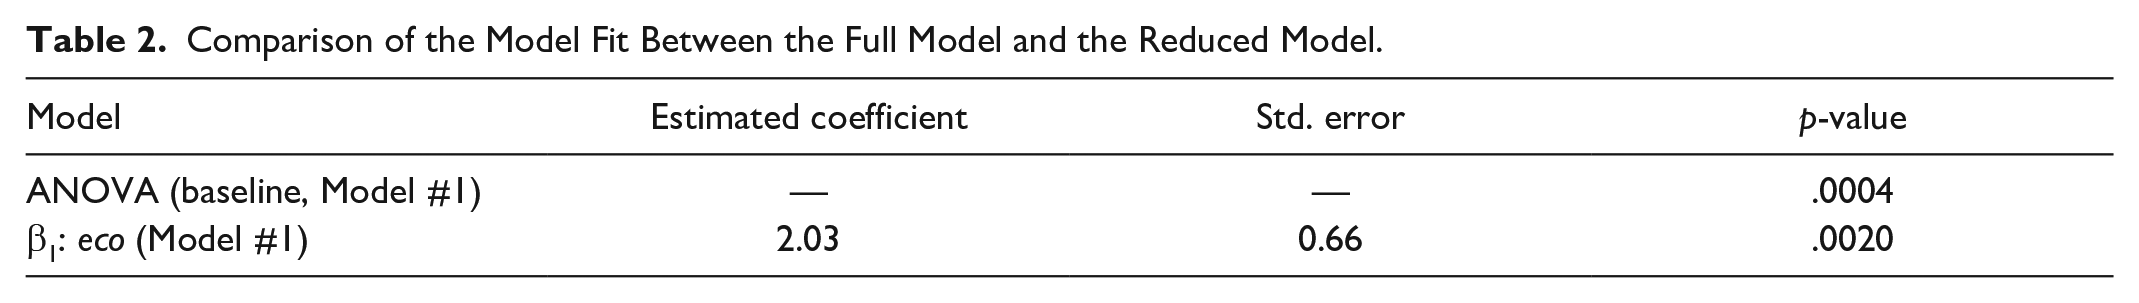
Applying Model #1 and obtaining a p-value of .002, at a significance level of 0.05 (p-value < .05) shows that there is a significant effect of booking user interface type on participants’ space selection towards eco-friendly behavior. We observe the estimated coefficient of 2.03 for the eco variable, suggesting that after being provided with eco-feedback, the log-odds of being in a higher eco-friendly category increase by 2.03. So, the odds ratio will be e2.03 = 7.6 which means the likelihood of choosing time slots with more leaves is 7.6 times more likely when occupants are provided with eco-feedback using the interventional interface compared to the baseline interface without eco-feedback.
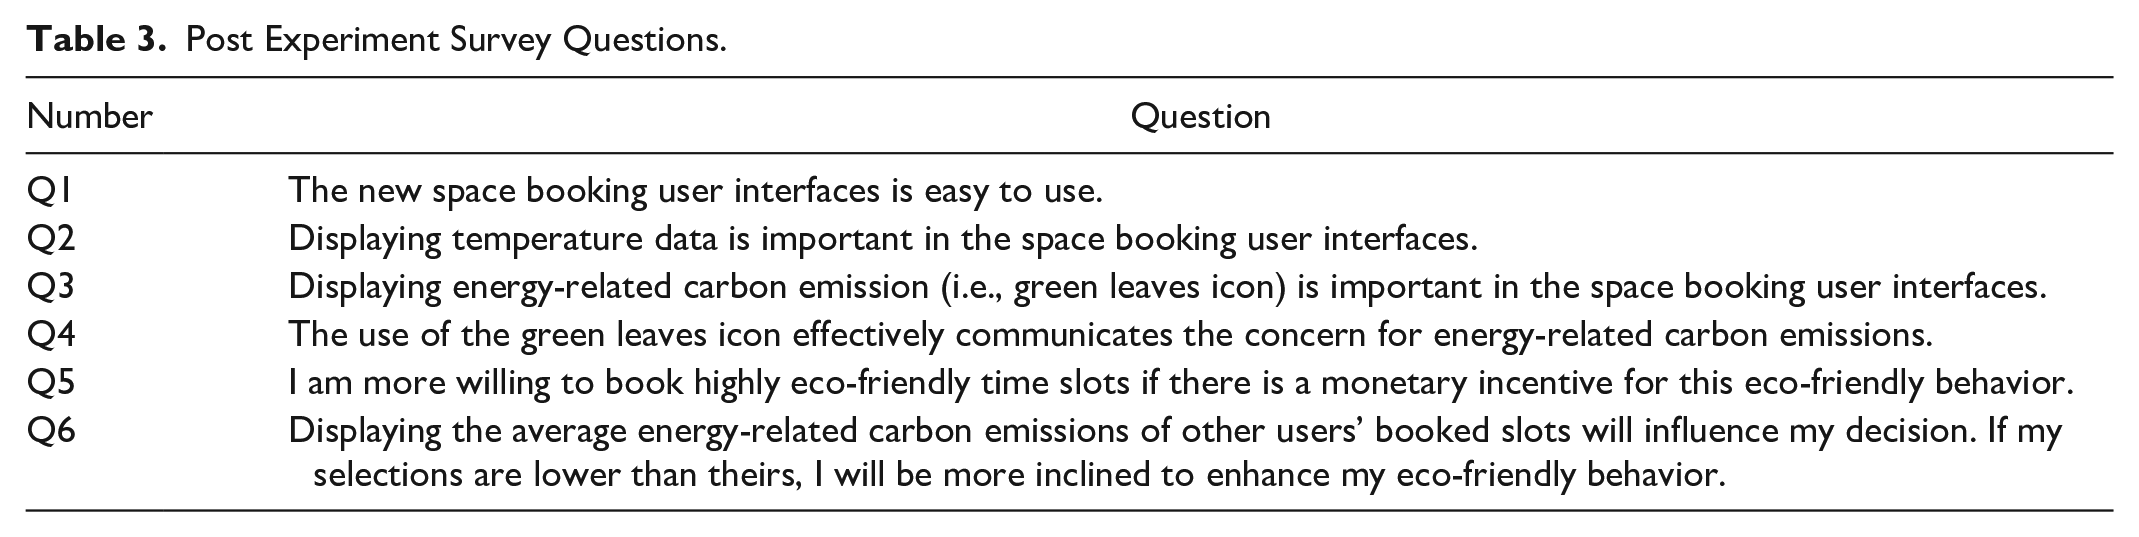
At the end, this study used 5-point Likert scale (1 = strongly disagree, 5 = strongly agree) survey to collect participants sentiments regarding the new user interface and the information provided for booking space (see Table 3). Across all the participants, 95% agreed or strongly agreed that the user inface used in this study was easy to use, and the temperature data is important for booking spaces. Moreover, a total of 76.2% agreed or strongly agreed that energy-related carbon emission is an important factor in space booking user interfaces, and 87% agreed or strongly agreed that using green leaves icon can effectively communicate the eco-friendly behavior. 62% of participants were agreed or strongly agreed that monetary incentive will encourage them to have highly eco-friendly behavior, and 57% agreed or strongly agreed that normative feedback will enhance their eco-friendly behavior in space selections.
Post Experiment Survey Questions.
Discussion and Conclusion
This study suggests that providing eco-feedback will change occupant behavior within building which is aligned with the results of previous research (Jain et al., 2013; Paone & Bacher, 2018). Specifically, the study reveals that providing eco-feedback in online space booking systems significantly increased the likelihood of selecting highly eco-friendly time slots. Therefore, providing eco-feedback in ABW environments could promote eco-friendly behavior among occupants, and as a result, this may lead to decreases in energy-related carbon emissions in the building sector, which is essential to achieve the Paris Agreement goals including strive for a rapid reduction in CO2 emissions in the coming years (United Nations Environmental Programme (UNEP), 2021).
There are a couple limitations that limit the generalizability of our results. Our study had a small sample size of college-aged students on a university campus. Therefore, these results may not generalize to ABW spaces outside of a university setting or with ABW spaces that may be used for other purposes in addition to studying and meetings. Future research should examine if these results are consistent for larger and more diverse populations with different cultural or organizational contexts where motivations and incentives for energy-saving behavior differ. Additionally, as part of this study the participants were taught what the eco-feedback icon (i.e., the leaf) indicated, so future research should study the impact of these types of feedback and information in settings where they are not explained or may be present with other iconograph information or data. Furthermore, due to the possibility of a testing threat, some participants may have attempted to accept eco-friendly behavior. Therefore, future studies could explore the impact of eco-feedback on space selections when individuals are unaware of their participation in the experiment. Moreover, although it has been shown that eco-feedback can influence occupant behavior, individuals have different preferences when using ABW environments (Babapour Chafi et al., 2020). Therefore, in the future studies it is needed to include more diverse rooms to explore the intervention of eco-feedback in their space selections in conjunction with rooms’ different features (e.g., lighting, availability, room amenities, and outdoor views) to see how the effectiveness of eco-feedback vary with the complexity of provided information.
One of the main concerns in promoting eco-friendly behavior is the sustainability of this behavior over the long term. Studies suggest that eco-feedback in university buildings may not sustain long-term eco-friendly behavior (Murtagh et al., 2013), and its short-term benefits might diminish in the long run (Paone & Bacher, 2018). To maintain eco-feedback effectiveness and prevent it from being another piece of ignored digital noise, future research should explore additional interventions alongside eco-feedback to promote sustained eco-friendly behavior in ABW environments. For instance, as observed in the results, over half of the participants indicated willingness to engage in eco-friendly behavior with monetary incentives, consistent with research findings on the influence of monetary incentives on behavior (Stone & Ziebart, 1995). Additionally, literature suggests that normative messages enhance the impact of eco-feedback and may have long-term effects (Cialdini, 2003; Paone & Bacher, 2018). Also, in our post-experiment survey, approximately half of the participants expressed that such feedback would influence their behavior. Therefore, future research should explore the sustained effectiveness of eco-feedback, incorporating normative messaging or monetary incentives in ABW space selections.
Footnotes
Declaration of Conflicting Interests
The author(s) declared no potential conflicts of interest with respect to the research, authorship, and/or publication of this article.
Funding
The author(s) received no financial support for the research, authorship, and/or publication of this article.