
Abstract
Current emotion research utilizes two primary frameworks: categorical and dimensional. Each framework offers unique insight, but also faces challenges in capturing the full spectrum of emotional experience. This study compares and integrates categorical and dimensional approaches to better understand their applications and limitations in emotion research, particularly in enhancing human-centered designs. Using Plutchik’s Wheel and the Self-Assessment Manikin (SAM), 238 participants rated their emotional responses to AI- generated images of various driving scenarios. Subsequently, the categories of emotions were mapped into the valence and arousal space. The integration of categorical and dimensional models revealed significant variability in individual interpretations of different emotions, highlighting the complexity and non-uniformity of emotional experience. These findings suggest that emotions may require more than two dimensions for full representation. A multifaceted approach that combines both frameworks can offer a comprehensive understanding of emotions and is essential for developing effective, empathetic, human-centered applications.
Introduction
Emotions are fundamental to the human experience. They influence our perceptions, shape our cognitive processes, affect our decision-making, and impact our interactions with the world (Izard, 1994). Furthermore, emotions guide human actions by coordinating different bodily systems (Cosmides & Tooby, 2000). For instance, fear triggers several physiological changes such as reduced digestive activity, redirected blood flow toward lower extremities, expanded visual fields, and increased respiration. All these changes help prepare the body to flee.
Studying emotions is critical for understanding human behavior and consequently designing effective human-machine systems. Emotion research promises significant advances in various domains. One example is health and well-being. There exist applications that use sensor networks to translate human physiological responses into digital formats, accurately reflecting emotions in real-time (Pal et al., 2021). This technology can adjust environmental settings based on an individual’s emotional state—such as dimming lights and modifying ambient sounds to create a more soothing atmosphere when stress is detected. Another example is education. By detecting students’ facial expressions and their emotions, teachers can adapt their teaching approach to better suit students’ emotional states and engagement levels.
Nonetheless, estimating emotions is a complex task. In order to develop systems that seamlessly estimate emotions through hand gestures, body postures, vocal tones, or facial expressions (Varghese et al., 2015), establishing accurate ground truth is critical. Self-report measures of emotions, which involve individuals assessing and reporting their own emotional states, are the most commonly used method because of their simplicity and cost-effectiveness (Larsen & Prizmic-Larsen, 2006).
Two primary frameworks are used to self-report emotions: categorical and dimensional. Categorical models identify discrete emotions such as “Happiness,” “Sadness,” and “Anger” (Ekman, 1992; Plutchik, 1980). Although these models disagree on the exact number of emotion categories, they agree that emotions are distinct. For instance, while some scholars argue for a minimal number of three primary emotions (pleasure, fear, and anger) (Sroufe, 1979), others propose a more extensive list of 11 emotions (Izard, 1994). Moreover, these models provide clear and identifiable labels for emotions, which facilitates ease of communication and understanding. However, these models introduce a two-fold challenge that impacts both the individual expressing emotion and the researcher interpreting them. On one hand, there is the mental workload faced by individuals to identify their own emotions, such as differentiating anger and rage ( Sreeja & Mahalakshmi, 2017). On the other hand, researchers and developers, have their own challenge of interpreting those emotions, where cultural and linguistic differences, along with unique personality traits can all create barriers to interpretation, potentially leading to a misrepresentation of the true emotional state.
Dimensional models, on the other hand, represent emotions on continuous scales, such as valence, arousal, power, and dominance. The two-dimensional model of valence and arousal is the most common. Russell (2003) considered these dimensions universal primitives and form the core affect, which is the basic feeling present at any moment. Valence denotes the positivity or negativity of an emotional state, whereas arousal measures the level of excitement or calmness. This model recognizes the complexity of emotional experiences and that emotions are not binary but exist on a spectrum, which offers a more refined representation of affective states. Nevertheless, dimensional models face their own challenges. For instance, both fear and anger can manifest as a combination of high arousal and low valence, denoting how different emotions can present in a comparable profile within the dimensional schema. Given these challenges, selecting the right model for studying emotions can be a difficult task. Researchers must decide whether to use one or both frameworks and which specific model to adopt. Key considerations for choosing a model include its ease of understanding and ability of research participants to accurately interpret it. The dimensional Self-Assessment Manikin (SAM) and the categorical Plutchik’s wheel of emotions models are known to address these considerations.
Plutchik’s wheel of emotions, shown in Figure 1 is a simple, visual framework that identifies 24 total emotions: 8 primary basic ones; believed to be universal, and have biological roots, and 16 emotions that represent different intensities of the primary ones (Plutchik, 1980). The primary emotions include “Joy,” “Trust,” “Fear,” “Surprise,” “Sadness,” “Anticipation,” “Anger,” and “Disgust.” The model presents the emotions in a wheel-like shape, with higher intensity emotions toward the center of the wheel and less intense emotions toward the outer edge of the wheel. The SAM model—see Figure 2—uses a series of graphical figures that depict a range of emotion dimensions like valence and arousal, allowing users to easily identify and convey their feelings (Bradley & Lang, 1994).
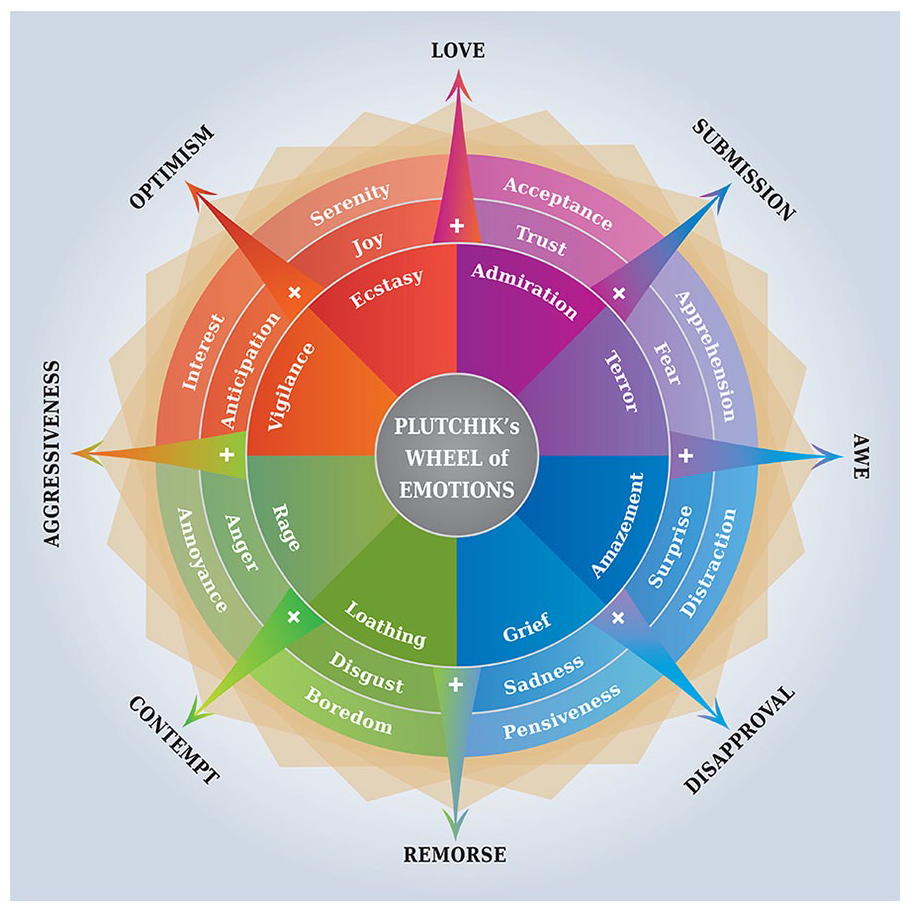
Plutchik’s emotion wheel.
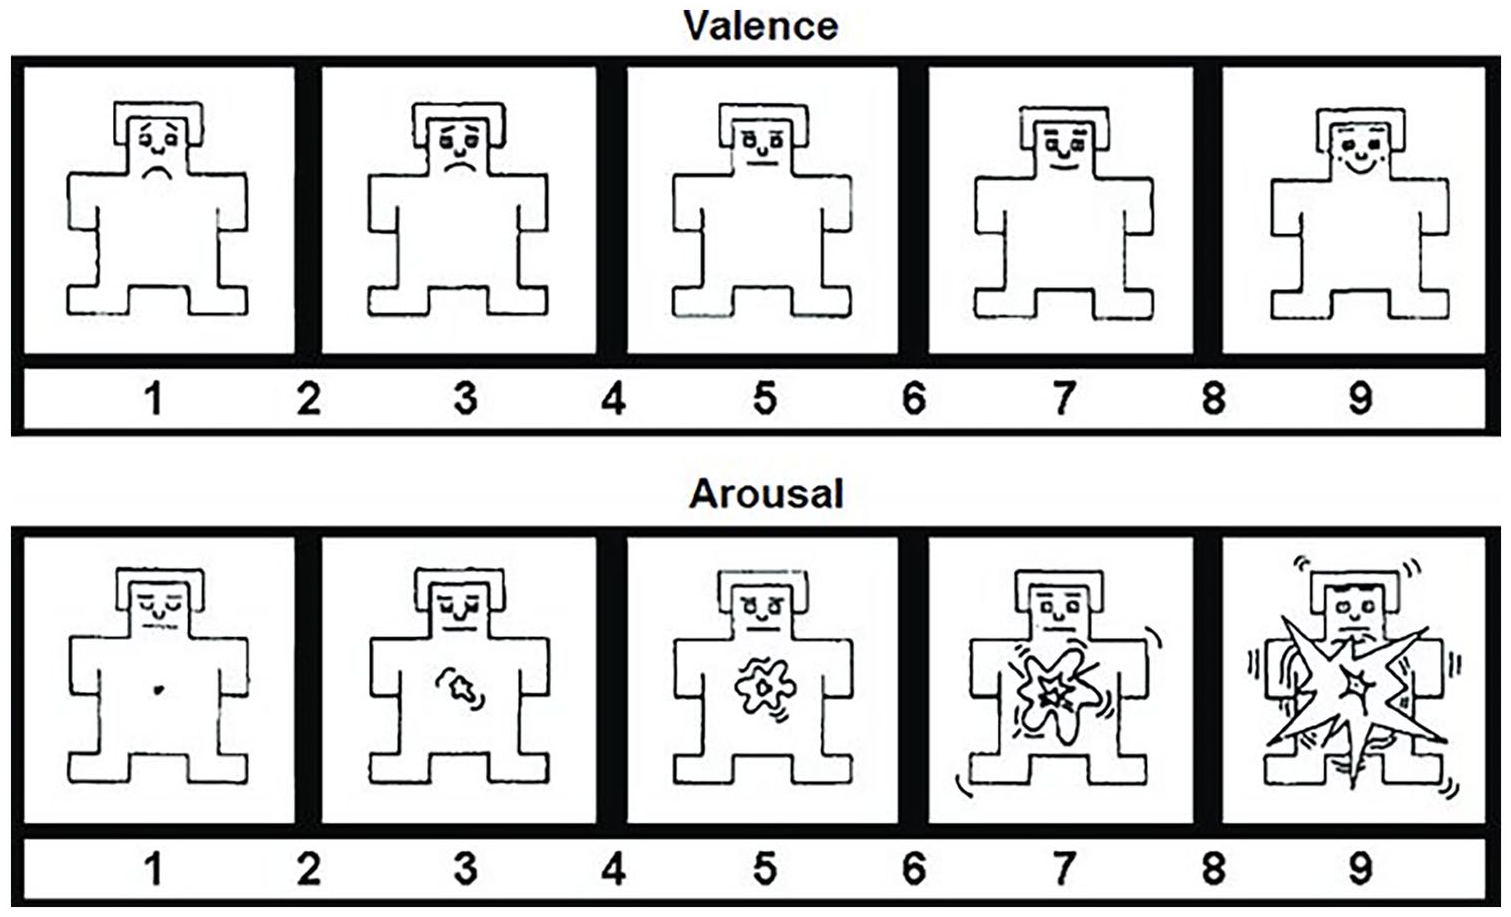
The self-assessment Manikin (SAM), adopted from (Langeslag, 2018).
This paper focuses on Plutchik’s wheel of emotion and the SAM model, mapping categories of emotions onto dimensions of valence and arousal, to answer questions about the degree of individual variability in emotional expressions and discusses the merits of utilizing a single model versus multiple models to capture this diversity. Finally, the paper discusses universality of emotions from the perspective of HF engineers and researchers.
Method
For this study, we used previously collected data that involved 238 participants, including 135 males, 96 females, 4 nonbinary, and 3 withheld gender information. Age-wise: 7.14% were aged (18–24), 55.46% were aged (25–44) and 37. 40% were over 45 years. The participants assessed images generated by Dall.E 2–AI application capable of creating true-to- life images from text descriptions. The images presented various driving scenarios that differ with respect to five different variables being; weather condition, time of the day, traffic condition, area and the state of the surrounding. Each variable was assessed at two levels: weather condition as rainy or clear, time of the day as morning or evening, traffic condition as present or absent, area as city or rural, and the state of the surrounding as serene or tumultuous. The prompt we used to generate the images was:
The survey was administrated through Prolific which is an online research platform. Participants were first prompted to answer demographic questions and then were introduced to Plutchik’s wheel of emotions and the SAM model. The survey featured 64 questions, with each question presenting one image in a standardized format at 300 pixels in height and width. The sequence of the images was randomized to minimize the order effect, and in each of the questions participants were asked to imagine driving alone in a context that is similar to what they can see in the image. The responses were collected using categories of plutchik’s wheel of emotions and the dimensions of valence and arousal, both on a scale going from 1 to 9. For more details, see (Alkurdi et al., 2024).
Data Processing and Approach
In this study, each participant shared their emotional experience to 64 AI-generated images using Plutchik’s wheel and the dimensions of valence and arousal as outlined in the SAM model. First, the original 1 to 9 scale for valence and arousal ratings was adjusted to a scale going from −4 to 4, which centers the data around a zero point, thus enhancing the distinction between negative and positive emotional states. Outlier responses of valence and arousal were identified for each emotion category of Plutchik’s wheel based on the Inter-Quartile Range (IQR) approach and where then excluded.
Subsequently, we mapped the emotions outlined by Plutchik wheel into the two-dimensional space of valence and arousal, by calculating the average of the associated SAM responses. Moreover, to understand the variability within the emotion intensities and across different emotions, we categorized the Plutchik emotions into basic and non-basic categories. Basic emotions, which include “Joy,” “Fear,” “Surprise,” “Anger,” “Trust,” “Sadness,” “Disgust,” and “Anticipation,” are at the center of each petal of Plutchik’s. The variability analysis involved examining the variance across these two categories, within different intensities of the same emotion, and across the various emotions themselves, using Levene’s test. Finally, to understand how these variations could impact the selection of emotional models and the finding of research implications, we explored the distribution of valence and arousal for each of the 24 emotions on the Plutchik wheel using data visualization techniques.
The data cleaning, wrangling, and analysis were performed using the R software and the Tidyverse package (R Core Team, 2022; Wickham et al., 2019).
Results & Discussion
We mapped the emotional responses of Plutchick’s wheel to the valence-arousal space to: (1) visualize how different emotions are spread out and related, (2) examine the variability in different emotional responses, and (3) understand the valence and arousal distribution patterns for each of the 24 emotions of Plutchik’s wheel.
Mapping Categories of Emotions into the Valence and Arousal Space
To map the 24 emotion categories of Plutchik’s wheel into the dimensional space of valence and arousal, we computed the average valence and arousal for each emotion from participants’ responses after removing the outliers. This mapping provides a reference for translating Plutchik’s emotions into the dimensional space of valence and arousal and can be utilized as a guide to understand the relationship between different emotions and how they compare in terms of positivity/negativity and level of excitement. The results of this mapping are presented in Figure 3. Each circle in the figure corresponds to one of the 24 emotions on Plutchik’s wheel. The position of each circle corresponds to the average valence and arousal ratings associated with each of the emotions, as computed after outliers’ removal. The size of each circle reflects the Coefficient of Variation (CV) of valence: larger circles represent a higher valence coefficient of variation. The shade of the circle corresponds to arousal’s CV where darker circles represent a higher arousal CV. Interestingly, larger circles are more toward the middle of the plot, indicating that neutral-valence emotions have higher valence variability, while darker circles are more in negative-arousal regions, suggesting higher arousal variability for these emotions. One possible hypothesis is that neutral-valence emotions are perceived more variably because they are less extreme and hence more subjective, while negative arousal emotions might show greater arousal variability due to differing individual responses to negative stimuli.
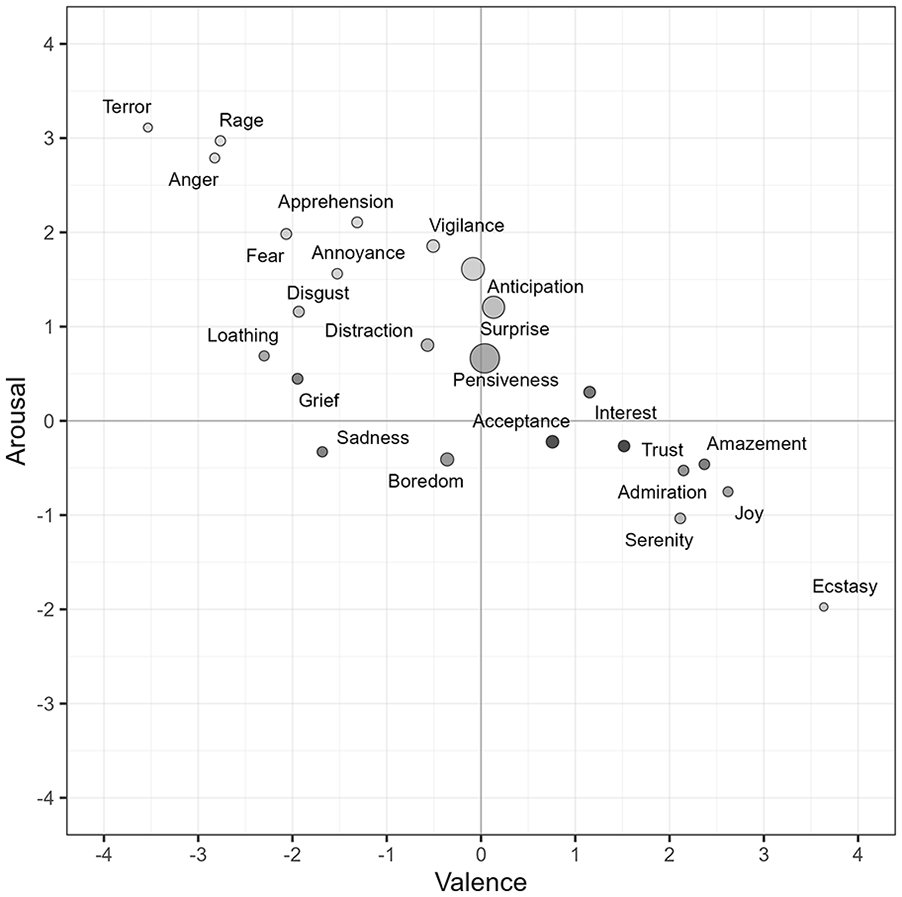
Distribution of valence and arousal scores for Plutchik’s 24 emotions as computed after outlier removal. For each emotion, the position represents the centroid of an emotion category, circles’ size correspond to valence coefficient of variation, with bigger circles representing higher valence coefficient of variation and the shade indicates arousal coefficient of variation, with darker circles corresponding to higher arousal coefficient of variation.
Variability in Emotional Expression
To understand the valence and arousal variability within different intensities of an emotion (individual petals of Plutchik’s wheel) and across different emotions (different petals of Plutchik’s wheel), we compared the variances of emotional responses and evaluated their significance using Levene’s test.
The results showed significant variability
These results highlighted that emotional experiences are not universally uniform, indicating the influence of many factors that could include cultural, linguistic, and personal traits (Barrett et al., 2007; Hareli et al., 2015; Lindquist, 2021). Moreover, the variability inherent in emotional experience is evident with unique emotion categories having different projections in terms of valence and arousal. Aligning with Barrett’s theory of constructed emotions (Barrett, 2017), which suggests that emotion categories do not have strict boundaries; rather, they are context-dependent. For instance, “Happiness” can manifest in highly variable instances, with different patterns of pleasantness, arousal, actions, and autonomic responses that depend on the situational context.
Furthermore, we categorized Plutchik emotions into basic and nonbasic categories to explore how these groups differ in their emotional variability and to test the assumption of the universality of basic emotions. Basic emotions -in our case- are those at the center of each petal of Plutchik’s wheel and include “Disgust,” “Sadness,” “Surprise,” “Fear,” “Trust,” “Joy,” “Anticipation,” and “Anger.” Our results revealed significant differences in valence and arousal variability between basic and non-basic emotions. Interestingly, basic emotions had higher valence and arousal variability than non-basic emotions.
This variability may have stemmed from the absence of clear boundaries between emotion categories. Specifically, between different intensity levels as we have defined non-basic emotions as different intensities of basic emotions. For instance, can individuals reliably recognize the difference between “Anger” and its more intense counterpart “Rage”? (Goto & Schaefer, 2017) have discussed the importance of considering emotional intensity as a quantitative dimension that varies independently of the qualitative nature of emotions themselves. However, due to the multi-dimensional subjective perception of emotional intensity (Sonnemans & Frijda, 1994) effectively mapping these intensities within a dimensional space could present significant challenges. This suggests a need to understand the individual aspects of the emotional experience. Integrating multiple emotion models might help reconcile these differences and achieve a more unified interpretation of emotions.
Multimodality of Some Emotions
To further understand these variations, we explored the distribution of valence and arousal for each of the 24 emotions of Plutchik’s wheel, expecting normal distribution patterns. Contrary to our expectations, the analysis revealed various distribution patterns. One interesting observation was the multi-modal distribution of some emotions, suggesting that these emotions may not be fully captured by two dimensions. A detailed visual representation of these distribution patterns is depicted in Figure 4.
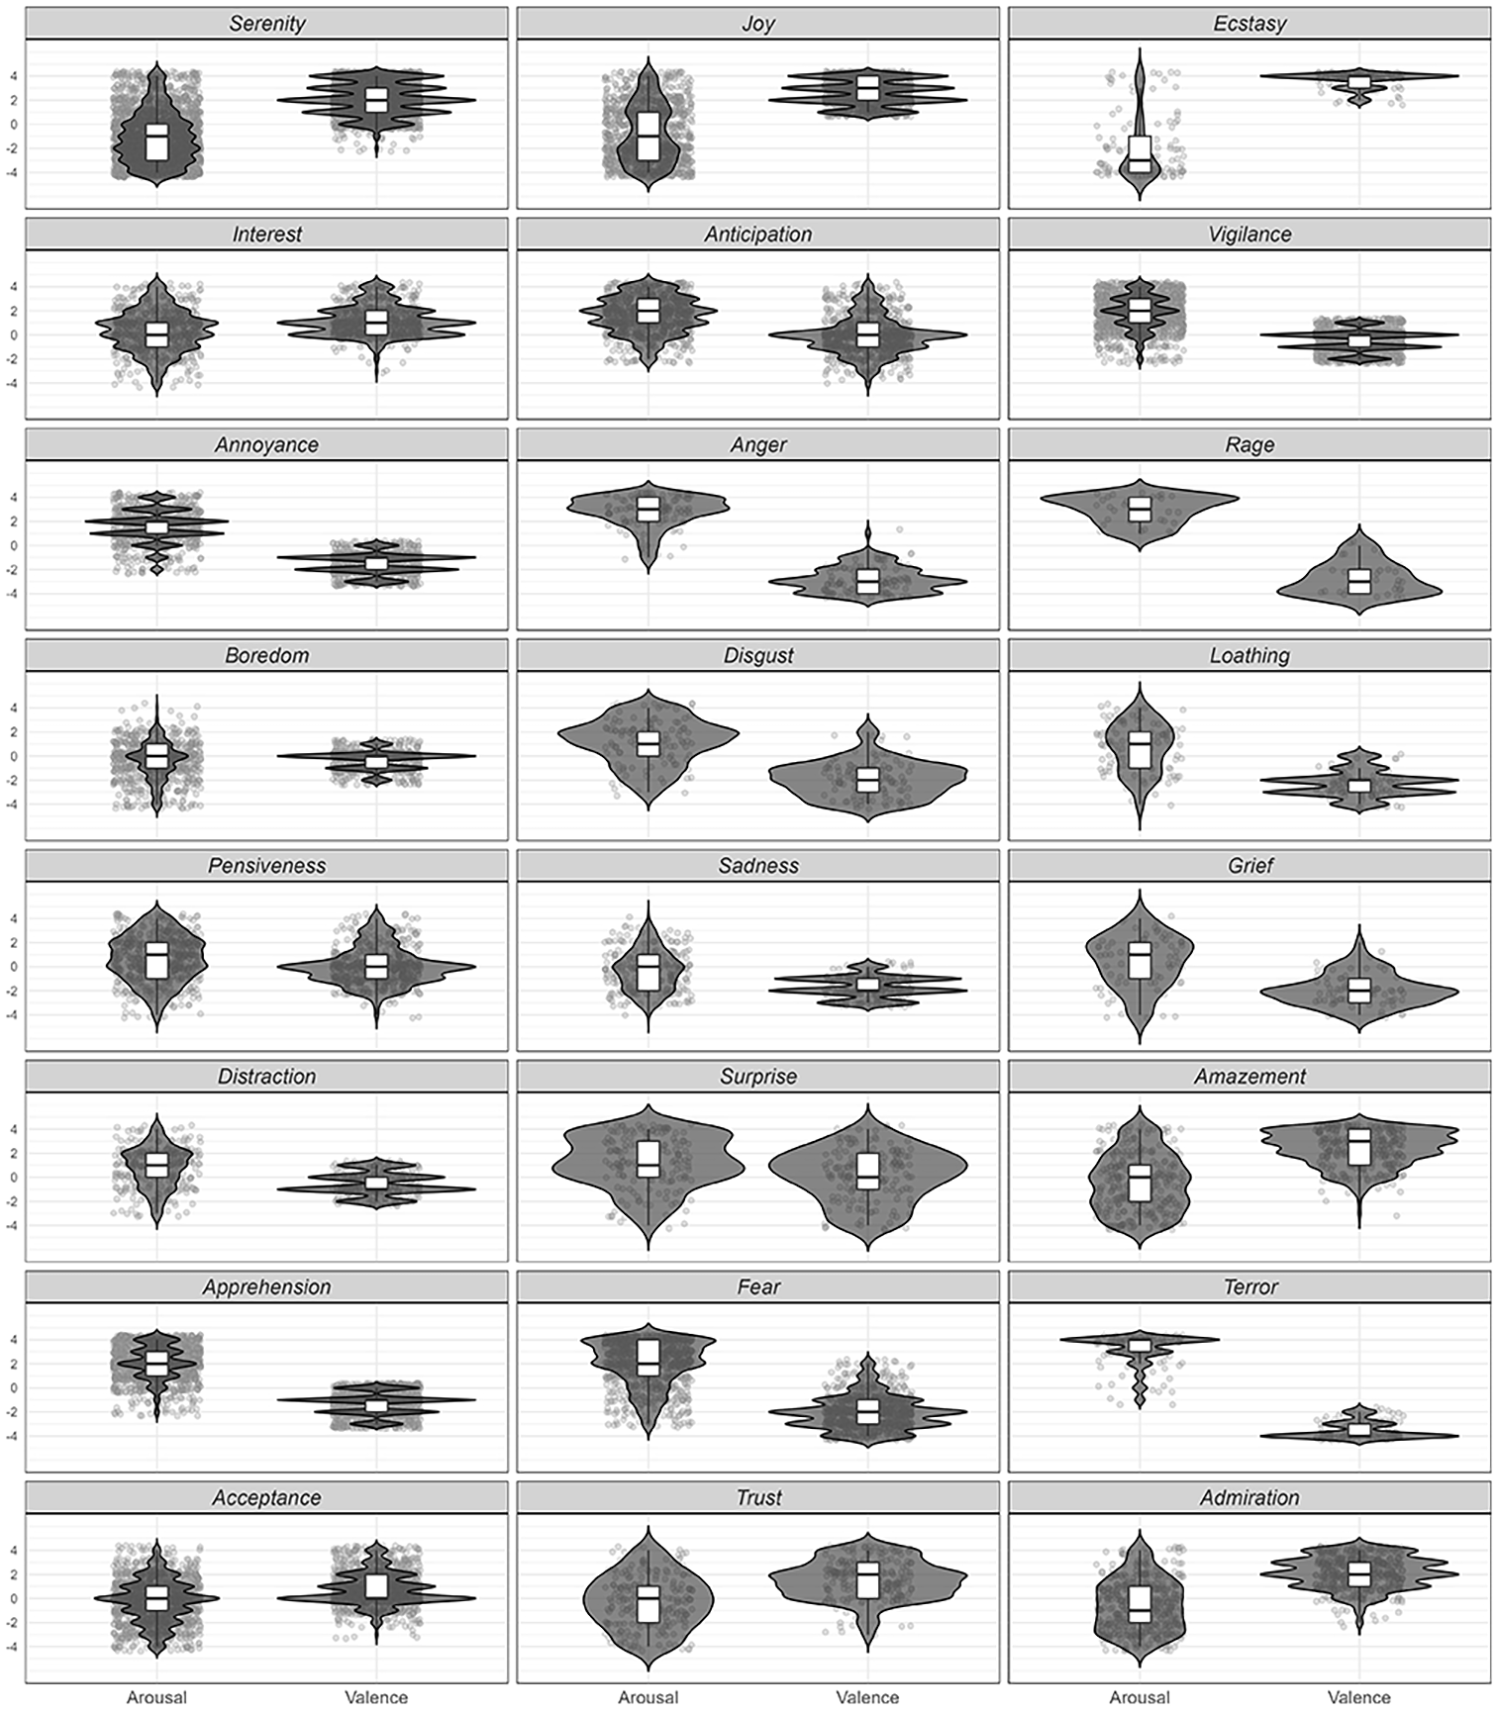
Combined violin and box plots representing the valence and arousal distribution for each of the 24 emotions of Plutchik’s wheel.
Emotions like “Joy,” “Sadness,” “Fear,” and “Annoyance” demonstrated multimodality in valence, arousal, or both. Specifically, “Joy” exhibited a multimodal valence pattern, indicating variations in positive experiences. Similarly, “Sadness” and “Fear” presented multiple valence peaks, showing a spectrum of positive and negative associations. “Annoyance” showed multimodality in both valence and arousal, reflecting a range of experiences from positive to negative and varying levels of excitement. These patterns highlight the complexity of emotional experiences, suggesting that the valence and arousal scales might not capture the full spectrum of human emotions.
Limitations and Future Work
While this study provides insights into the emotional spectrum, it has some limitations. Firstly, the reliance on online survey data may have introduced biases, as participants’ interpretation and understanding of the survey’s questions may vary. Secondly, the images used in the study, representing various driving scenarios, may limit the generalizability of the findings to other fields. Furthermore, the two-dimensional model used for emotional assessment may not fully capture the complex and multidimensional nature of emotional experiences. Lastly, the removal of outliers, while standard, may have skewed the representation of less common but significant emotional responses.
Future research should consider expanding the emotional dimensions studied, diversifying the scenarios considered to enhance the generalizability of the findings, and integrating multiple emotional models in order to provide a more holistic understanding of emotional experiences.
Conclusion
In conclusion, this study aimed to advance our understanding of categorical and dimensional emotion models with three main contributions. First, it provided a comprehensive mapping of Plutchik’s categorical emotions into the valence-arousal space, integrating the dimensional aspects of the 24 emotions on the Plutchik wheel. Second, it highlighted the consistency and variability in individual interpretations of emotion categories, which can be attributed to cultural, linguistic, and personal factors. Third, it assessed the normality of the distribution of emotions within the valence-arousal space, revealing multimodal patterns in emotions like “Joy” and “Sadness” suggesting these emotions may require more than a two-dimensional representation. The results suggested that incorporating additional dimensions and diverse emotional models could offer a more accurate representation of human emotions. A multifaceted approach, akin to triangulation techniques, may be promising in enhancing the reliability and completeness of emotional research.
Footnotes
Declaration of Conflicting Interests.
The author(s) declared no potential conflicts of interest with respect to the research, authorship, and/or publication of this article.
Funding
The author(s) disclosed receipt of the following financial support for the research, authorship, and/or publication of this article: This research was supported by funding from the Ford Motor Company.