
Abstract
This research aims to explore the prediction of student learning outcomes in Augmented Reality (AR) educational settings, focusing on engineering education, by analyzing pupil dilation and problem-solving time as key indicators. In this research, we have created an innovative AR learning platform through the incorporation of eye-tracking technology into the Microsoft HoloLens 2. This enhanced learning platform enables the collection of data on pupil dilation and problem-solving duration as students engage in AR-based learning activities. In this study, we hypothesize that pupil dilation and problem-solving time could be significant predictors of student performance in the AR learning environment. The results of our study suggest that problem-solving time may be a critical factor in predicting student learning success for materials involving procedural knowledge at low difficulty levels. Additionally, both pupil dilation and problem-solving time are predictive indicators of student learning outcomes when dealing with predominantly procedural knowledge at high difficulty levels.
Introduction
Pupil dilation acts as a physiological indicator of cognitive effort (Holmqvist et al., 2011), and solving time provides insight into a student’s comprehension of the concepts taught during the lecture (De Boeck & Scalise, 2019). These measures shed light on how students interact with educational content, allowing educators to customize their teaching approaches for enhanced learning results. Despite their potential, there has been limited research exploring the relationship between pupil dilation, solving time, and student learning performance in Augmented Reality (AR) settings.
AR is revolutionizing education, offering dynamic, immersive experiences with tools like Microsoft HoloLens 2. It enriches learning, particularly in complex fields like engineering education, by making content interactive and accessible to various learning styles, thus improving educational results. While numerous studies have highlighted the advantages of AR-based learning, users continue to face challenges such as cognitive overload, triggered by an overload of stimuli, and cyber sickness (Alzahrani, 2020; Wu et al., 2013). Furthermore, it is hard to predict learning performance in such settings (Koumpouros, 2024). Hence, developing innovative methods to precisely assess students’ understanding of learning materials in AR environments is a critical area for future AR research.
This research focuses on investigating the use of pupil dilation and problem-solving time as key parameters for predicting student learning success in an AR-based educational environment.
In this research, we have developed an innovative AR learning platform by integrating eye-tracking technology into the Microsoft HoloLens 2. The integration of eye-tracking technology is crucial for the real-time collection and analysis of eye-related metrics, such as pupil dilation, providing insights into student engagement and cognitive load. Such data are invaluable for understanding how students interact with and learn from AR content. The result is an enhanced learning platform that enables the collection of data on pupil dilation and problem-solving duration as students engage in AR-based learning activities. These metrics are then utilized as indicators to assess student learning performance.
In this study, we hypothesize that pupil dilation and problem-solving time could be significant predictors of student performance in the AR learning environment. For the experiment, we created two AR lectures on biomechanics. The first lecture introduced essential concepts in biomechanics and physics, including fundamental definitions and formulas. Following this, the next lecture built on these foundations by applying the concepts covered earlier, thus increasing the complexity. Lecture #1 was divided into seven modules, whereas Lecture #2 was organized into eight modules.
Methodology
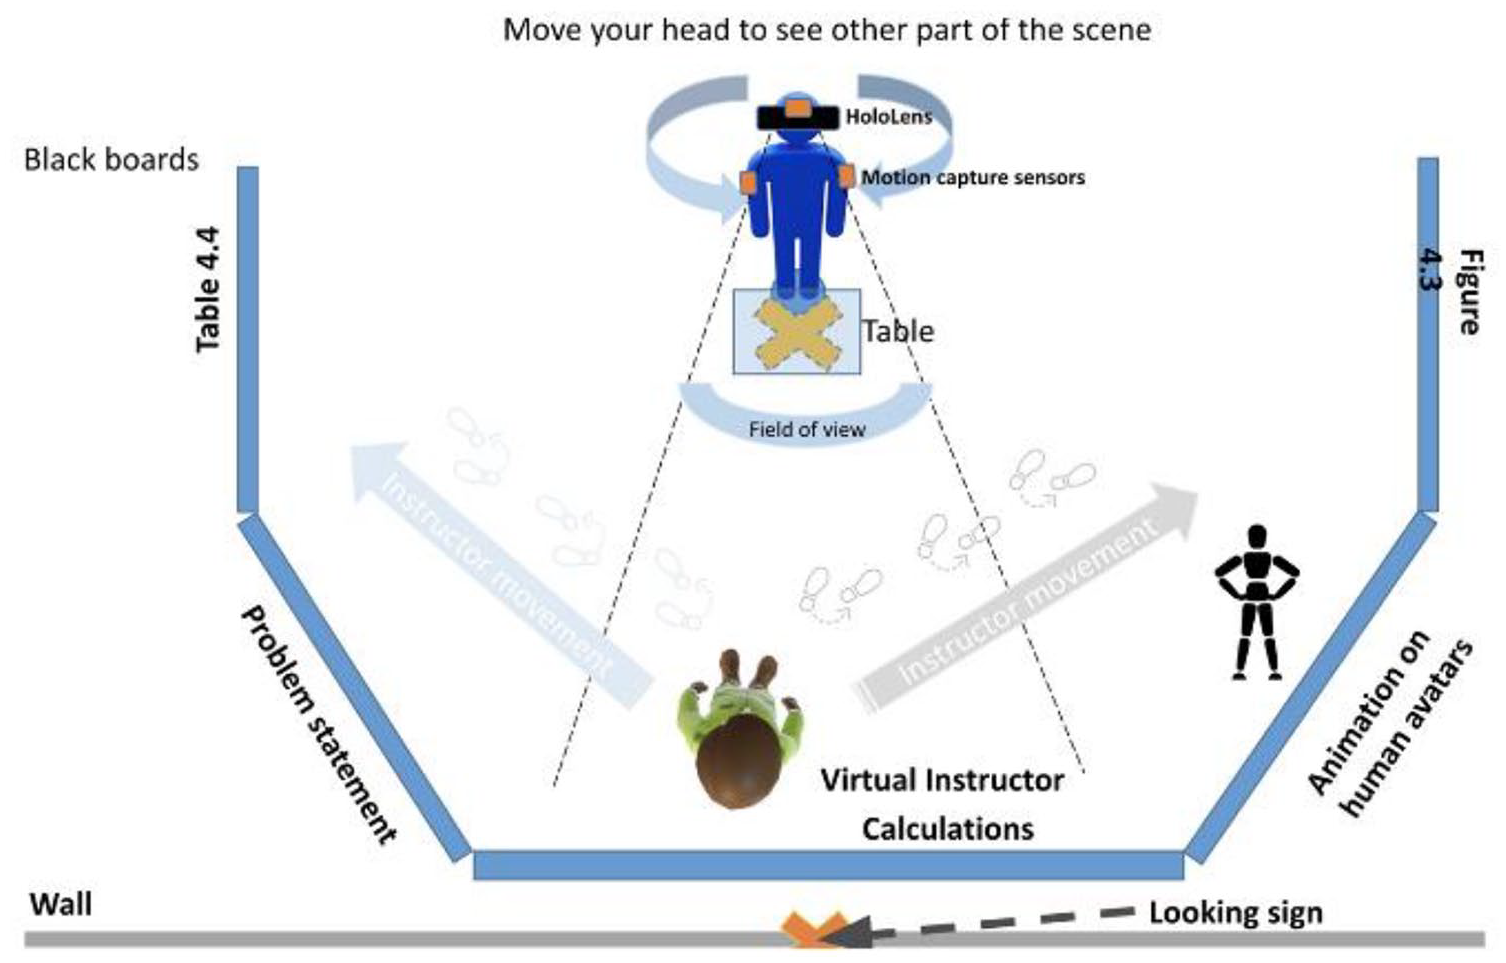
Twelve engineering students (average age = 20.6) from the University of Missouri participated by completing a survey that gathered demographic information. Following the survey, participants were provided with a comprehensive orientation session to familiarize them with the HoloLens headset and the Dikablis Eye Tracking system (see Figure 1). After the calibration of both devices, the study was structured around two distinct AR lectures, each separated by a minimum interval of 4 hr and a maximum of 48 hr to ensure adequate rest and mental preparation for the participants. The initial lecture covered fundamental concepts in biomechanics, laying the groundwork for the subsequent session. The second lecture, designed to be more challenging, required participants to apply the knowledge acquired from the first lecture to solve advanced problems in the same fields. During these sessions, participants engaged with a series of modules—seven in the first lecture and eight in the second—each designed to progressively build on their understanding and application of biomechanics. After each lecture concluded, we recorded the performance metrics and problem-solving times for each participant onto the laptop. For example, Table 1 displays data on performance and solving time from the first lecture. To understand the performance data, each module records a solving time alongside a score, with 100 indicating a correct answer and 0 denoting an incorrect one. As participants navigated through the educational content and problem-solving activities, we continuously gathered eye-tracking information, including metrics such as the pupil area for both the left and right eyes, along with the pupil size.
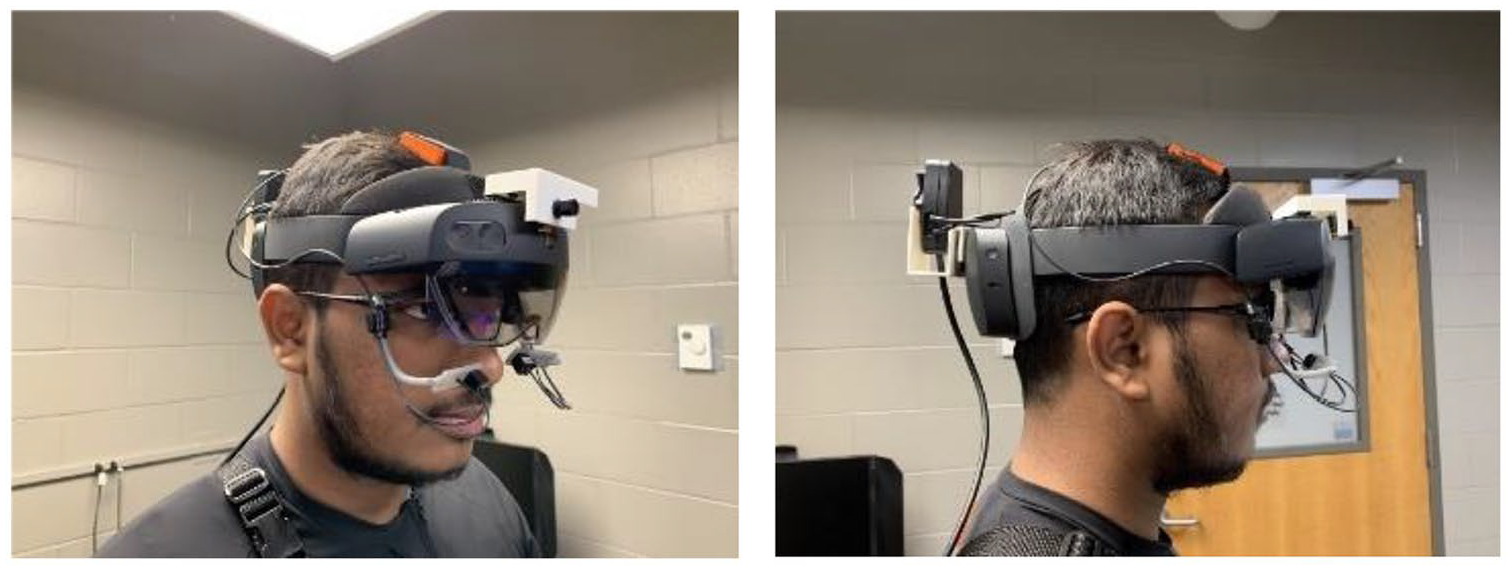
Dikablis eye tracking with HoloLens 2 device.
The Example of Performance Data for Each Participant.
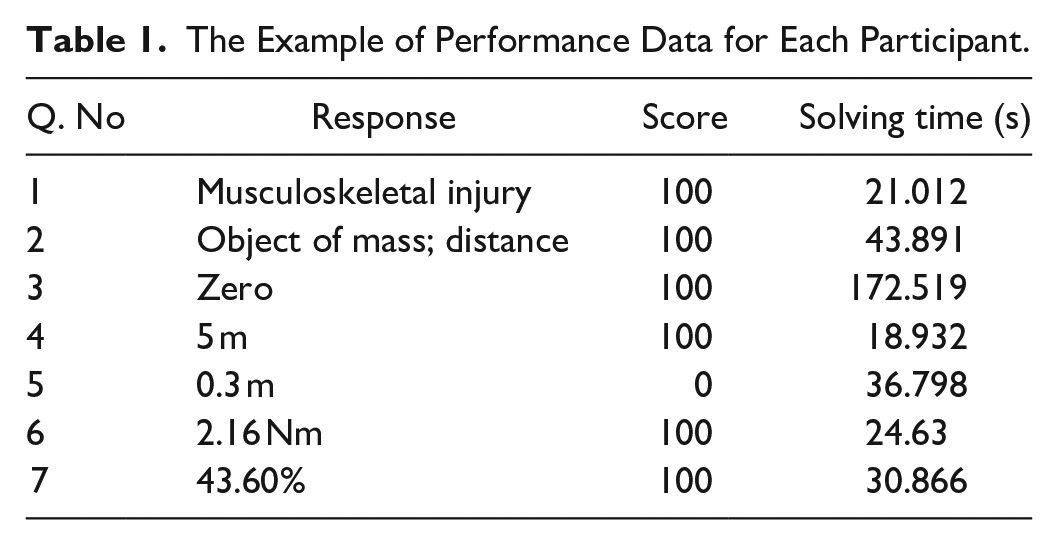
During the experiment, participants were equipped with two devices: a HoloLens for accessing AR learning materials, and Dikablis eye-tracking cameras to monitor pupil activity. Additionally, the NFER system was deployed to trigger the loading of subsequent AR modules based on the participants’ physical locations, which included seven specific learning stations for Lecture #1 and eight spots for Lecture #2 (Yu et al., 2023). The NFER tag was placed on the table used by participants during the experiment. This tag tracks the real-time location within a calibrated indoor room. By utilizing this technology, we can accurately display the relevant AR learning contents (see Figures 2 and 3) by minimizing any mismatch issues between physical objects and virtual objects (Guo & Kim, 2021).
Labeled 3D scene of an AR module built with unity.
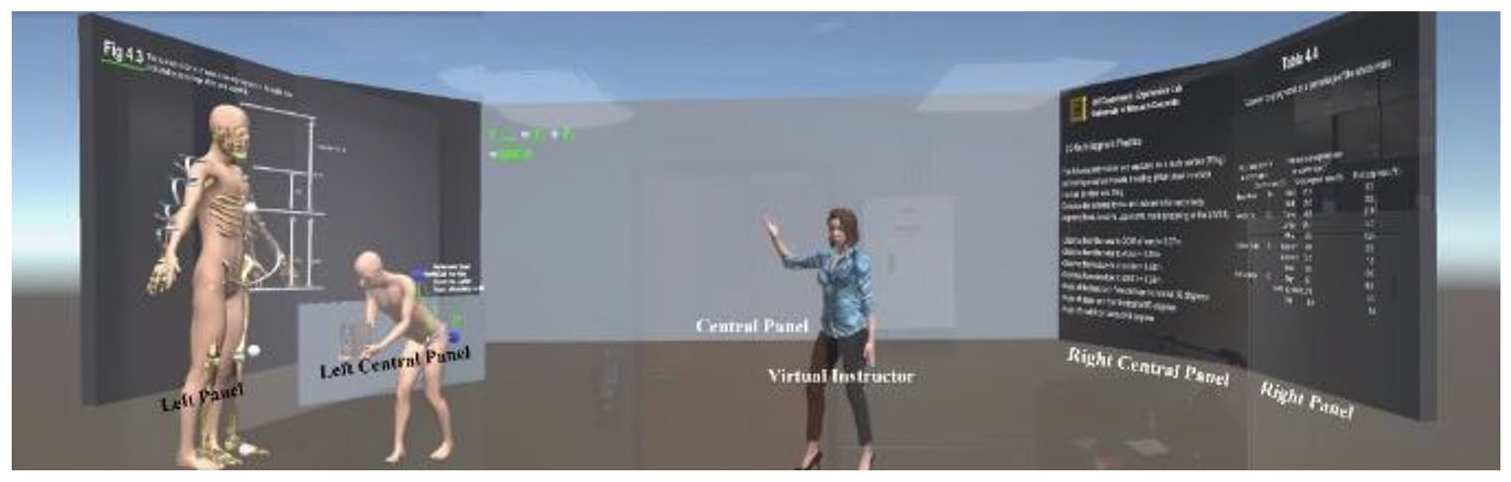
Bird’s-eye view of the AR learning platform (Kim et al., 2023).
To analyze the participant’s pupil data, we normalized the pupil area data using equation (1) (Liang et al., 2021) . In this equation,

After completing the normalization process, we divided the pupil dataset into two categories: baseline (
To accurately measure each participant’s problem-solving time, we designed an interface accessible via a touchscreen laptop computer (refer to Figure 4). When a participant was prepared to tackle the question, they would press the “NEXT” button, which triggered the start of the timer. After selecting an answer from multiple choices, the “NEXT” button would activate. The timer stopped as soon as the participant clicked this button. Each problem-solving time is denoted as ST.
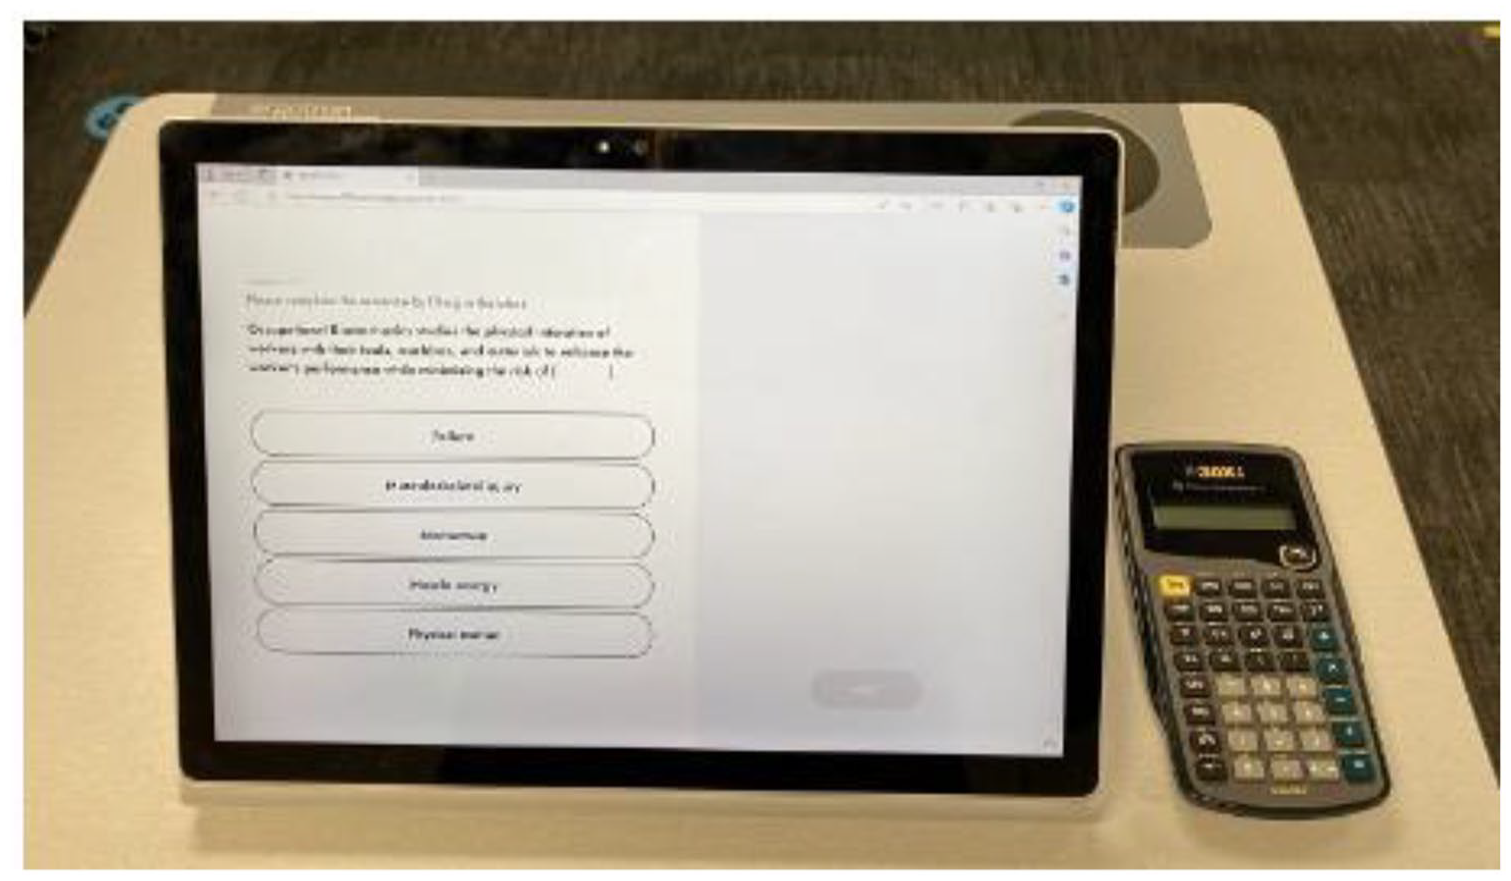
The touchscreen laptop computer to collect problem-solving time.
In this experiment, participants solved one problem after each AR module. However, module 1 in Lecture 2 did not include a question, resulting in seven ST values for both Lectures #1 and #2. Accordingly, for Lecture #1, seven normalized B-S values corresponded to modules #1 through #7. For Lecture #2, seven normalized B-S values corresponded to modules #2 through #8 for each participant.
Results
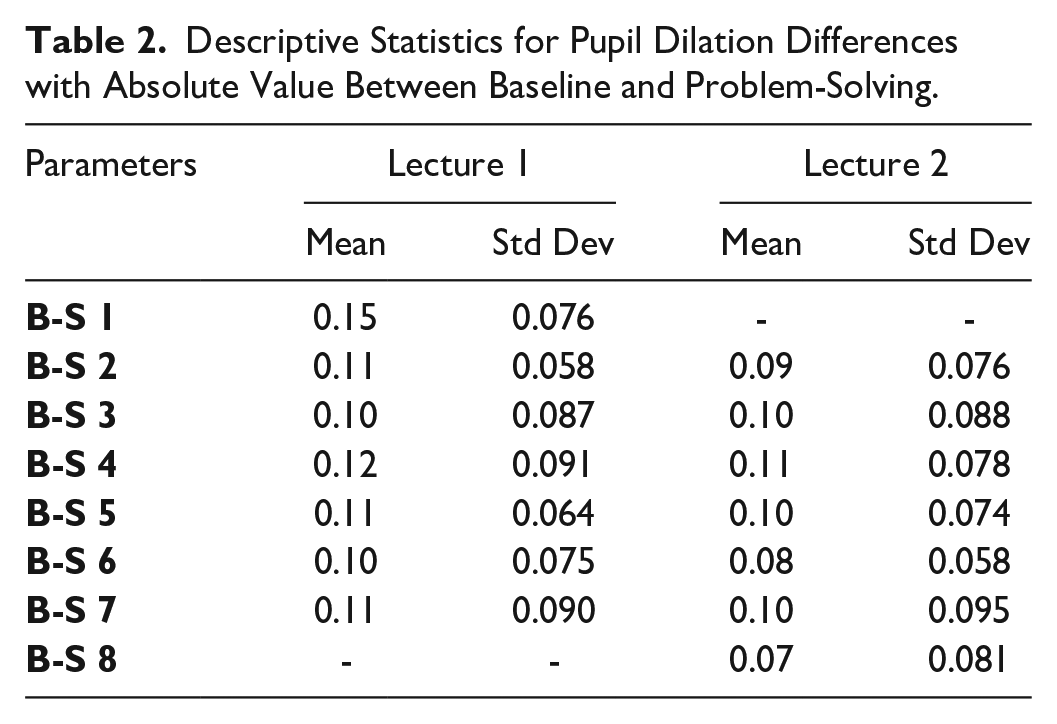
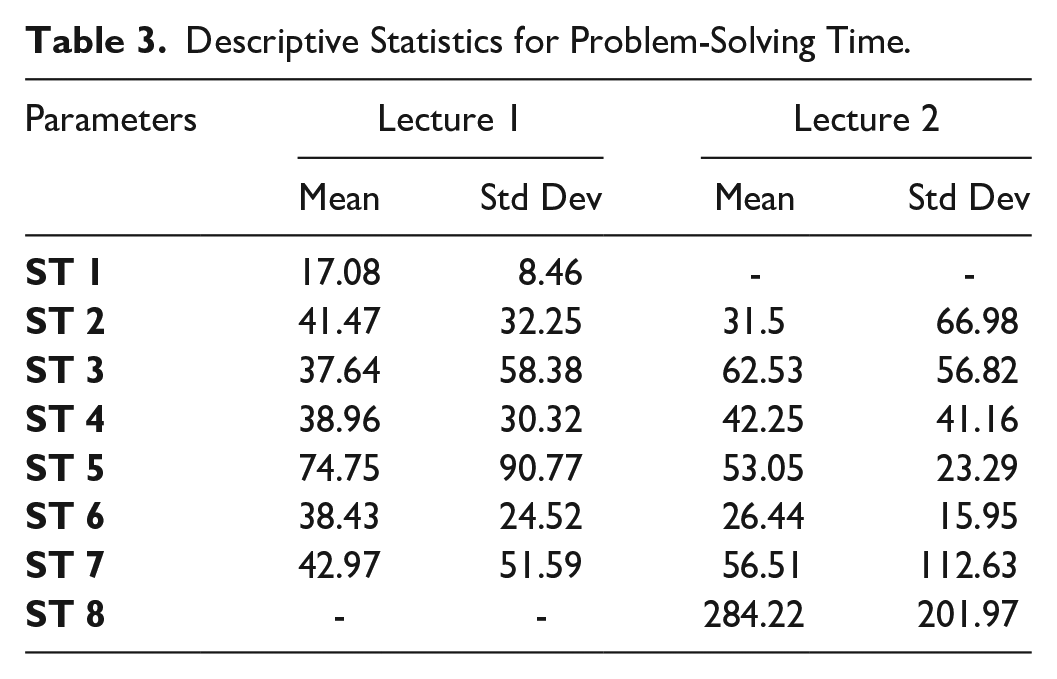
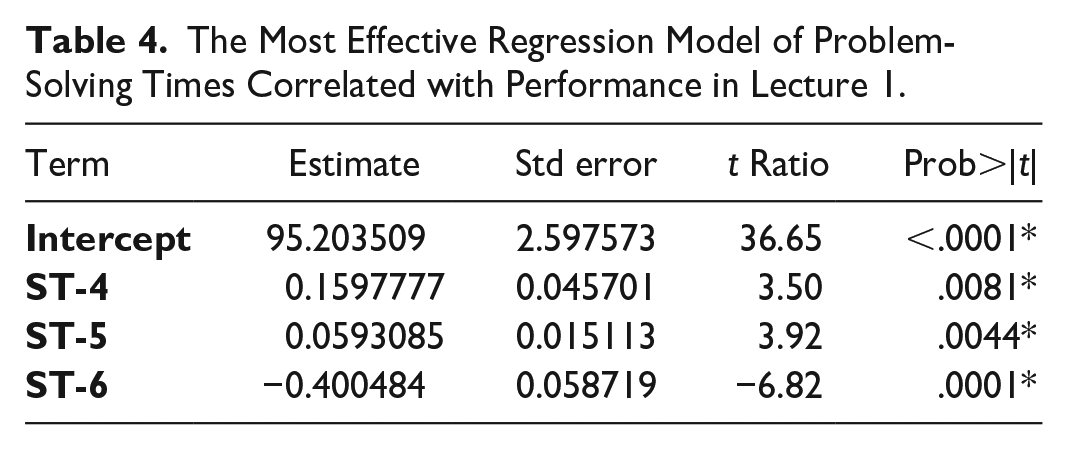
The findings indicate that the mean pupil dilation difference between baseline and problem-solving is 0.11 with a standard deviation of 0.077 for Lecture #1 and 0.09 with a standard deviation of 0.079 for Lecture #2 (see Table 2). This suggests a 9% to 11% fluctuation in pupil size while participants were engaged in problem-solving compared to when no visual stimuli were presented. For the problem-solving time, the mean solving time is 41.61 s with a standard deviation of 42.32 for Lecture #1 and 79.5 s with a standard deviation of 74.11 for Lecture #2 (see Table 3). This implies that participants took longer to solve the problems in Lecture #2, possibly perceiving them as more difficult than those in Lecture #1. This interpretation could be supported by a comparison of performances between the two lectures: Lecture #1 had an average performance score of 90.42 with a standard deviation of 9.31. In contrast, Lecture #2 had an average score of 68.84 with a standard deviation of 18.43. The performance in Lecture #2 was significantly lower than in Lecture #1 (see Figure 5).
Descriptive Statistics for Pupil Dilation Differences with Absolute Value Between Baseline and Problem-Solving.
Descriptive Statistics for Problem-Solving Time.
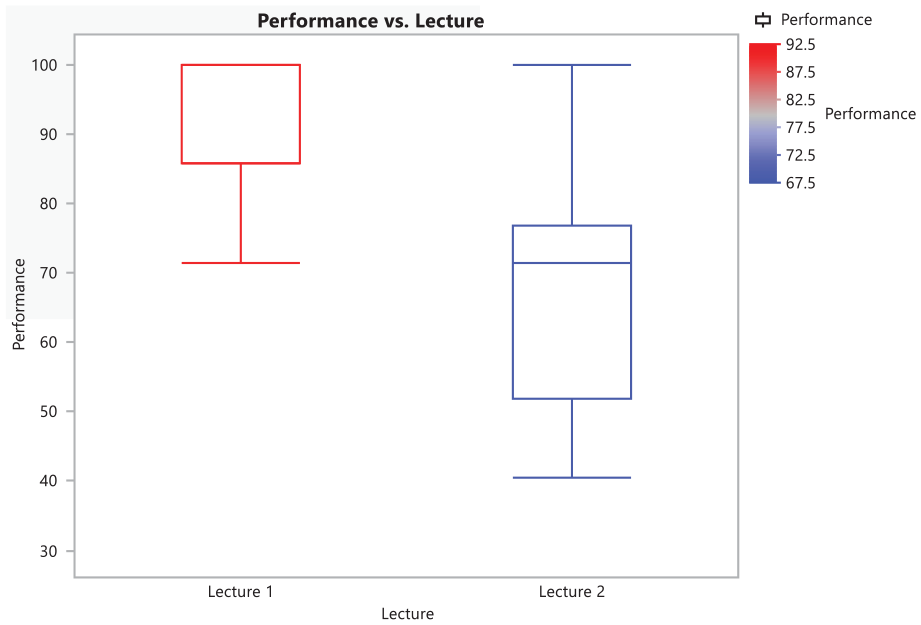
Performance results.
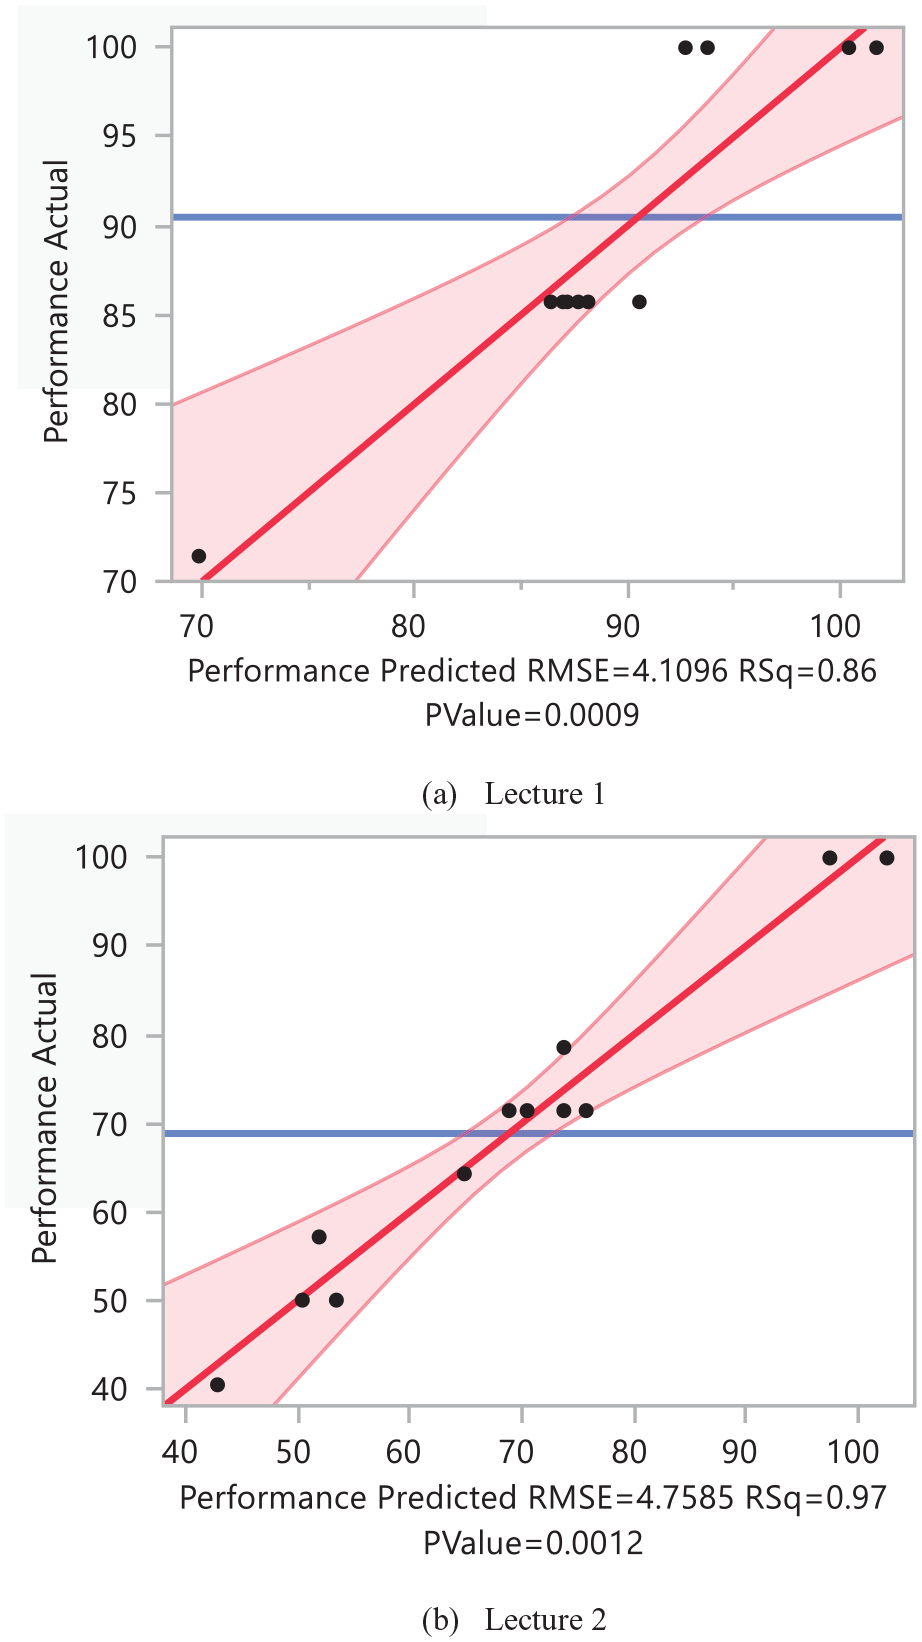
A Scatter plot comparing actual performance and predicted performance: (a) Lecture 1. (b) Lecture 2.
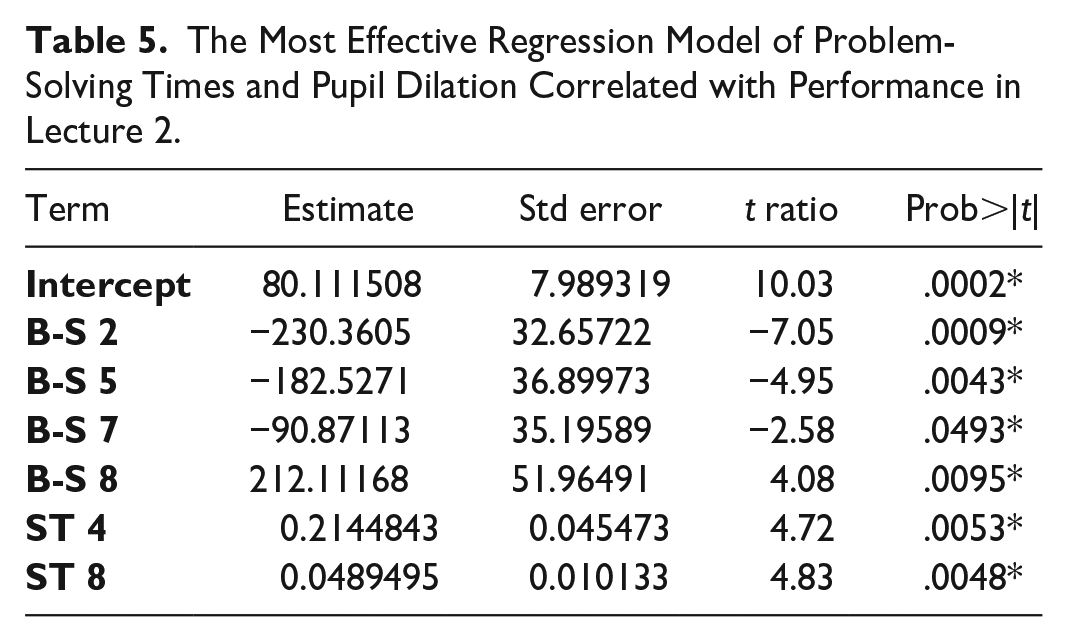
For Lecture #1, the most effective regression model considers problem-solving time and pupil dilation as independent variables, with the sum of each module’s performance as the dependent variable, including only the solving times for modules #4, #5, and #6. This is evidenced by an R-squared value of 0.86 (see Figure 6 (a)). It means that the solving times for those modules, called ST-4, ST-5, and ST-6, indicate their critical role in determining student performance for Lecture #1 contents. In Lecture #2, which contains more complex biomechanics contents, the model’s R-squared value rises to 0.97 (see Figure 6 (b)). This indicates a significantly enhanced predictive accuracy. The solving times for modules #4 (ST-4) and #8 (ST-8) and pupil dilations for modules #2 (B-S 2), #5 (B-S 5), #7(B-S 7), #8 (B-S 8) are significant predictors of performance. Based on the regression coefficient findings from Lecture #1, as detailed in Table 4, it is evident that there is a positive correlation between student performance and the time spent solving problems in modules #4 and #5. Conversely, a negative correlation was observed between student performance and the time spent on problem-solving in module #6. In Lecture #2, as indicated in Table 5, positive correlations were identified between student performance and the time spent solving problems in modules #4 and #8, as well as the pupil dilation observed in module #8. Additionally, negative correlations were noted between student performance and pupil dilation in modules #2, #5, and #7.
The Most Effective Regression Model of Problem-Solving Times Correlated with Performance in Lecture 1.
The Most Effective Regression Model of Problem-Solving Times and Pupil Dilation Correlated with Performance in Lecture 2.
Discussion
According to the results, we observed that when students engaged with learning materials primarily composed of procedural knowledge at low difficulty levels (Lecture #1 in modules #4 to #6), their performance demonstrated a significant correlation with the time spent on problem-solving but showed no correlation with pupil dilation. As previously mentioned, Lecture #1 introduced fundamental concepts and simple examples in biomechanics. Specifically, modules #1 to #3 covered the definition of biomechanics, forces and moments, and static equilibrium using free body diagrams. Modules #4 to #6 offered straightforward examples of calculating forces and moments on body segments. Module #7 detailed additional information for solving more complex multi-segment biomechanics problems, which will be explored further in Lecture #2. In other words, modules #1, #2, #3, and #7 are structured to impart declarative knowledge related to biomechanics, while modules #4 to #6 focus on teaching procedural knowledge, such as calculating forces and moments on the body. the results from the regression model indicate that the time spent solving problems in modules #4 to #6 is a significant predictor of student learning success in Lecture #1. It is interesting to observe how problem-solving time can predict performance. According to Table 4, spending more time on modules 4 and 5 but less time on module 6 results in better performance. This could be because mastering modules 4 and 5 provides a significant advantage in understanding and efficiently completing module 6. In other words, a student who spends more time solving problems correctly in modules 4 and 5 spend less time on module 6 due to their high level of understanding of calculating forces and moments in biomechanics.
However, when students interacted with learning materials that predominantly featured procedural knowledge at a high difficulty level (Lecture #2), their performance significantly correlated with the time they dedicated to problem-solving and pupil dilation. Aside from module #1, which focused on summarizing the content from Lecture #1, all other modules were dedicated to addressing multi-segment biomechanics problems to assess potential ergonomic risks during manual material handling tasks. This indicates that for procedural learning at high difficulty level, both the effort invested in solving problems and the physiological responses, as reflected by pupil dilation, are important predictors of student success.
Prior research has established pupil dilation as a reliable measure of cognitive load (Gavas et al., 2017; Kim & Yang, 2017; Sibley et al., 2011). This phenomenon becomes particularly evident when students tackle new content, such as calculating forces and moments affecting individual body segments. Such topics demand considerable cognitive effort to grasp the sequence and methodology involved. Participation in these procedural tasks at a high difficulty level can increase cognitive load and student engagement, as indicated by changes in pupil dilation. Additionally, the time spent on problem-solving acts as a direct measure of student engagement with a task.
Our regression model supports these observations. According to Table 5, the variables of problem-solving time and pupil dilation in modules #3 and #6 are not significant predictors of performance in Lecture #2. This may be due to the lack of new information or equations in these modules. Specifically, in module #3, the virtual instructor repeated the method for calculating forces and moments, previously covered, but applied it to a different posture. Similarly, in module #6, the same procedure used in module #5 for calculating forces and moments on the upper arm was repeated.
The results of our study indicate that learning modules focused on procedural knowledge significantly impact student learning performance. This is because adequate knowledge about the subject is essential for solving problems that require procedural understanding. An interesting observation from the study is that at low difficulty levels, only problem-solving time is relevant for predicting performance. However, at high difficulty levels, both pupil dilation and problem-solving time emerge as significant predictors in the model.
Conclusion
This study seeks to predict student learning outcomes in Augmented Reality (AR) educational environments by examining pupil dilation and problem-solving time as primary indicators. The results of our study suggest that both pupil dilation and problem-solving time serve as predictive indicators of student learning outcomes when the material is predominantly procedural knowledge. This study shows that AR’s impact could be amplified through pupil dilation and solving time to understand student learning in the AR environment. Pupil dilation reflects the mental effort in AR interactions, while solving time measures how students comprehend concepts. These metrics could provide real-time insight into student engagement and cognitive challenges. Educators can utilize these insights to customize content, ensuring it matches student capability, and thereby fostering personalized learning. The current study explores AR’s role in education, focusing on how pupil dilation and solving time as performance metrics can enhance AR-based engineering education. This research contributes to digital education, highlighting eye-tracking’s potential to improve AR methodologies. Conclusively, by leveraging these findings, we will be able to create an innovative AR learning platform that tailors itself to the learner’s cognitive state and performance metrics.
Future studies should aim to increase the sample size and diversity of participants to improve the generalizability of the results. Additionally, it is important to expand the range of AR content to encompass various educational and training contexts. Furthermore, incorporating additional physiological sensors could enhance the accuracy and reliability of performance prediction models in AR settings.
Footnotes
Declaration of Conflicting Interests
The author(s) declared no potential conflicts of interest with respect to the research, authorship, and/or publication of this article.
Funding
The author(s) disclosed receipt of the following financial support for the research, authorship, and/or publication of this article: This research is supported by NSF IIS-2202108.