
Abstract
Future human-autonomy teams will require AI systems capable of adapting to human operators. Of all human states to adapt to, situation awareness (SA) is of particular interest due to its implications on performance and criticality for safety. SA comprises three levels: the perception of elements in the environment, the comprehension of their meaning, and their projection into the future. While existing measures of SA can be difficult to capture in real-time, physiological models have shown promise for predicting SA and could be implemented in real-time in a range of operational settings like air-traffic control. This information regarding operator SA could be used to develop autonomous teammates that respond to critical shifts in SA before adverse outcomes develop. This work advances prior efforts, by incorporating a broad combination of sensors to capture physiological variance in SA, leveraging three linear multiple regression models to predict the SA of an operator along a continuum at each of the three levels, and assessing generalizability of these models to new operators and unseen scenarios.
Keywords
Introduction
Background
Human-autonomy teams offer a future in which artificial intelligence (AI) systems work alongside human operators, such as pilots, to advance safety and improve performance (Committee on Human-System Integration Research Topics for the 711th Human Performance Wing of the Air Force Research Laboratory et al., 2021). In human teams, members constantly adapt to one another, but current AI technology lacks the real-time insight into human cognitive states that might enable this adaptive behavior.
Situation awareness (SA) is a critical aspect of an operator’s cognitive state, essential for safety in high-stakes human operations like first response, piloting, and air-traffic control (Baker & McCafferty, 2005; Endsley, 1995; Stanton et al., 2001). Existing measures of SA can be difficult to capture during actual operations without interrupting or affecting operator performance. For this reason, extensive work has sought physiological correlates (Zhang et al., 2023) and generated multimodal physiological classifiers (Yang et al., 2023) of SA in human operators. Such real-time indicators of SA could be supplied to an autonomous teammate to enable adaptive behavior. Physiology-based estimates do not require disruptive inputs from operators, and thus could supplement current SA assessment methods in scenarios where interrupting an operator is impractical or infeasible. While physiological signal capture may be impractical in certain dynamic environments, others—such as air-traffic control, mission control, or teleoperations—involve operators in environments that may be conducive to physiological signal capture.
This work aims to build upon prior physiological models of SA in several different ways.
Objectives
First, this work seeks to capture more variance in SA than prior work by incorporating a broad combination of sensors. While past studies have found various physiological sensors to be sensitive to differences in SA (Zhang et al., 2023), few studies have investigated multimodal sensor suites, and none have incorporated the six-sensor suite of research-grade sensors we use here (Zhang et al., 2023).
Second, this work emphasizes comprehensive model output by leveraging three linear multiple regression models to predict the SA of an operator along a continuum at each of the three levels—perception, comprehension, and projection. In other words, this work seeks to generate nuanced measures of an operator’s SA. While past work has successfully classified physiological responses as low or high SA states, estimates of continuous measures of SA would allow an autonomous teammate to fine-tune its response to an operator’s needs. Additionally, many studies combine measures of the three levels of SA into a single, overall measure. The three levels of SA represent unique cognitive processes, and low SA at each level is prescriptive of a different adaptive response (Endsley, 2021; Parasuraman et al., 2008).
Third, this work assesses generalizability of these models to new operators and unseen scenarios by performing rigorous cross-validation in both feature selection and model-building. While high-accuracy models remain important for user confidence, human physiological responses vary between individuals. Models trained on a subset of the population in a single session study may not successfully capture SA in novel users or even in prior users under novel cognitive conditions. Thus, it is critical to understand how well population-based physiological models capture variance in SA and whether individualized models may be necessary for sufficient predictive performance.
Methods
Participants
Written informed consent was obtained from 17 participants. Two participants were removed from analysis due to missing data, resulting in 15 participants, aged 20 to 33 (M = 24.9, SD = 3.6), with 5 identifying as female.
All participants were right-handed and reported no known color-vision deficiencies. Participants varied in their experience with aerospace displays, ranging from no experience to extensive experience. Six participants had piloting experience, either in aircraft or aircraft simulators.
Experiment
The task incorporated a modified 24-min simulation of the Multi-Attribute Task Battery (MATB-II; Figure 1) (Santiago-Espada et al., 2011). Modifications included additional interactions between the MATB-II subtasks. For instance, training emphasized that system monitoring systems F5 and F6 monitored primary and secondary flight computers respectively. Failure of both computers would lead to a failure of the tracking “autopilot” in the near future.
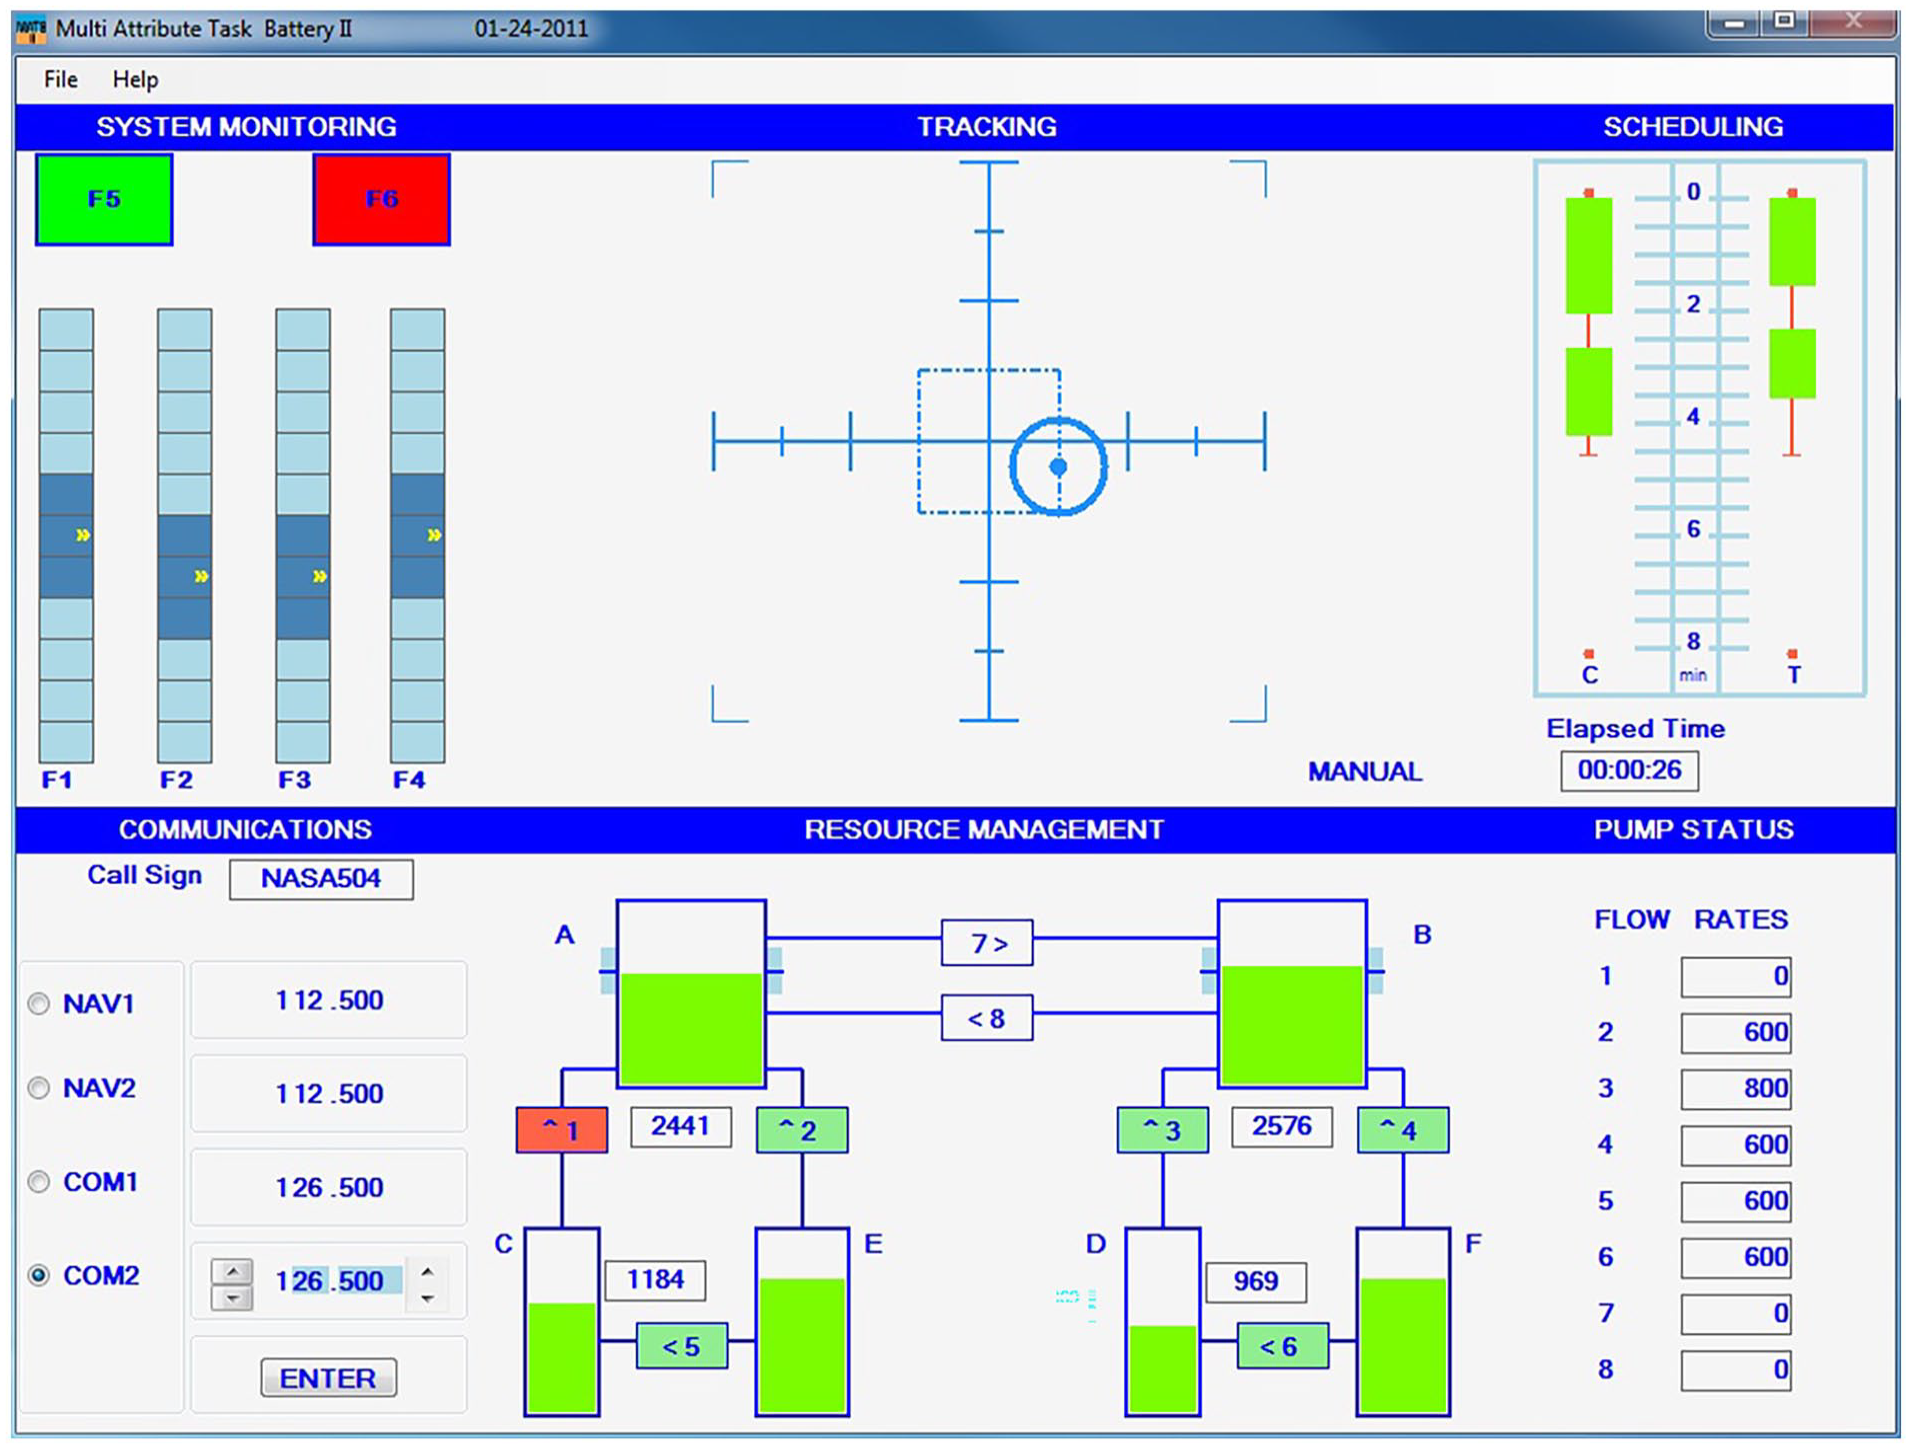
Sample screenshot of the Multi-Attribute Task Battery II (MATB-II) that participants completed.
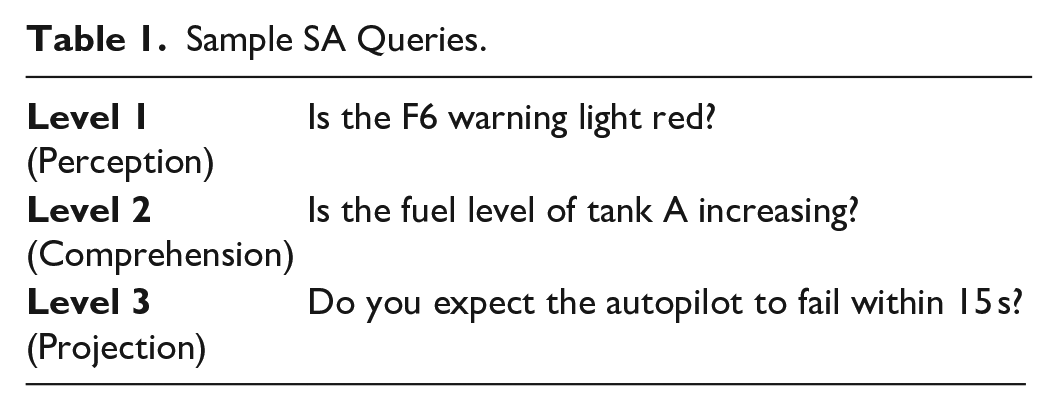
Participants completed the task while wearing a suite of physiological sensors: electroencephalography (EEG), functional near-infrared spectroscopy (fNIRS), electrodermal activity, respiration belt, electrocardiogram, and eye tracking. Following a SAGAT-like freeze probe approach, at approximately 2-min intervals, the simulation was frozen and participants completed an SA assessment that probed their SA. SA assessments contained 6 queries at each of the three levels (i.e., perception, comprehension, and projection) for a total of 18 queries (per person, per trial). SA queries were based on a goal-directed task analysis, and each participant responded to a random subset on each trial to ensure that questions were unpredictable. Table 1 contains a sample question at each level of SA. Participants completed the NASA TLX (Hart & Staveland, 1988) between each trial.
Sample SA Queries.
Participants were rewarded for correct responses on SA Assessments and penalized for performance lapses in the MATB-II. MATB-II performance was scored as the cumulative number of seconds all display elements existed in “off-nominal” states. Scores were then negated so that higher scores (closer to zero) indicated better performance.
Analysis
Summing a participant’s correct responses from each freeze-probe resulted in 12 “ground-truth” scores for each level of SA at the instants each of 12 trials was frozen. These scores were adjusted for question difficulty to account for differences in difficulty between queries. Physiological signals were cleaned and processed, and numerical features were extracted. A matrix of features and their associated scores of SA at each level was created for feature selection and model-building. A stabilized LASSO regression method performed feature selection on all the data (Buchner, 2022). Ordinary least-squares multiple regression models were then fit to training data for each stable feature set, and a final model was selected based on model performance in a leave-one-out cross-validation scheme (i.e., to identify models not overfit to training data). This cross-validation process required final models to have: (1) at least five observations for each model term, and (2) performance on left out data (Q2) within 0.2 of performance on training data (R2). If none of the generated models “pass” these strict criteria, no model will be presented.
The combined feature selection and model-building approach was evaluated for generalizability using Monte Carlo Cross Validation (MCCV). For each of 50 iterations, a random 30% of the data was held out as a test set. The remaining 70% of the data were used to perform LASSO feature selection and linear multiple regression model-building. Selected (final) models were used to calculate the probability of finding a successful model as well as the mean absolute error (MAE) and Q2 on held-out test data. While this method does not produce generalizability measures for the specific models presented below, it does provide a reasonable expectation for how these models would perform on unseen data.
Results
Findings
After adjustment, SA scores are not normally distributed (K-S test for normality: D = 0.08, p < .01), range from −4.92 to 1.92, and are highly correlated with raw SA scores (Spearman’s ρ = 0.94, p < .01). In adjusted scores, zero represents the mean level of SA, negative scores represent lower (worse) SA and positive scores represent higher (better) SA. These findings align with work that has found the MATB-II to induce variations in SA among participants (Edgar et al., 2003; Hirshfield et al., 2015; Kurapati, 2017). Level 1, 2, and 3 SA scores had small yet significant correlations with one another (Figure 2).
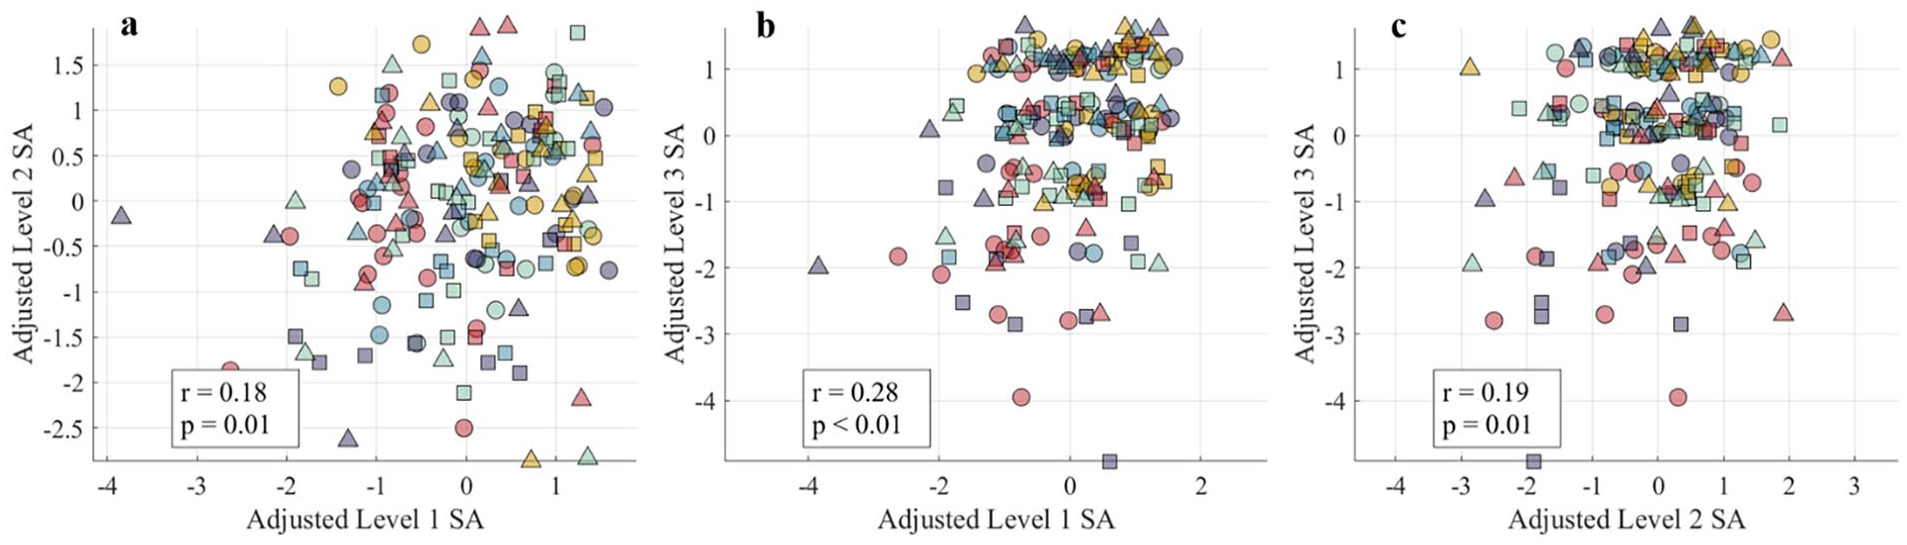
SA scores show low, yet significant positive correlations with one another, ranging from 0.18 to 0.28 (all p < .05). In other words, high level 1 SA (perception) is correlated with high level 2 (comprehension) and high level 3 (projection) SA. Colors and shapes correspond to subjects.
SA scores show no correlations (|R| < 0.05) with MATB-II task performance—suggesting that maintaining high SA may not contribute to MATB-II performance in a linear manner—and no correlations (|R| < 0.1) with workload—suggesting that changes in workload did not affect participants’ ability to maintain high SA in a linear manner. Workload had a significant negative correlation with MATB-II performance (R = −.15, p < .05), suggesting that increasing workload degraded task performance. Preliminary multiple regression models capture 53% of the variance in Level 1 SA outcomes, 51% of the variance in Level 2 SA outcomes, and 44% of the variance in Level 3 SA outcomes, and 58% of the variance Total SA outcomes on data left out of model-building (Leave-one-trial-out; Figure 3). Performance was similar when entire participants were left out of model-building (Leave-one-participant-out; 38%, 51%, 43%, and 52% respectively). This suggests that models would perform similarly when applied to new data from a “known” operator and when applied to a new operator entirely.
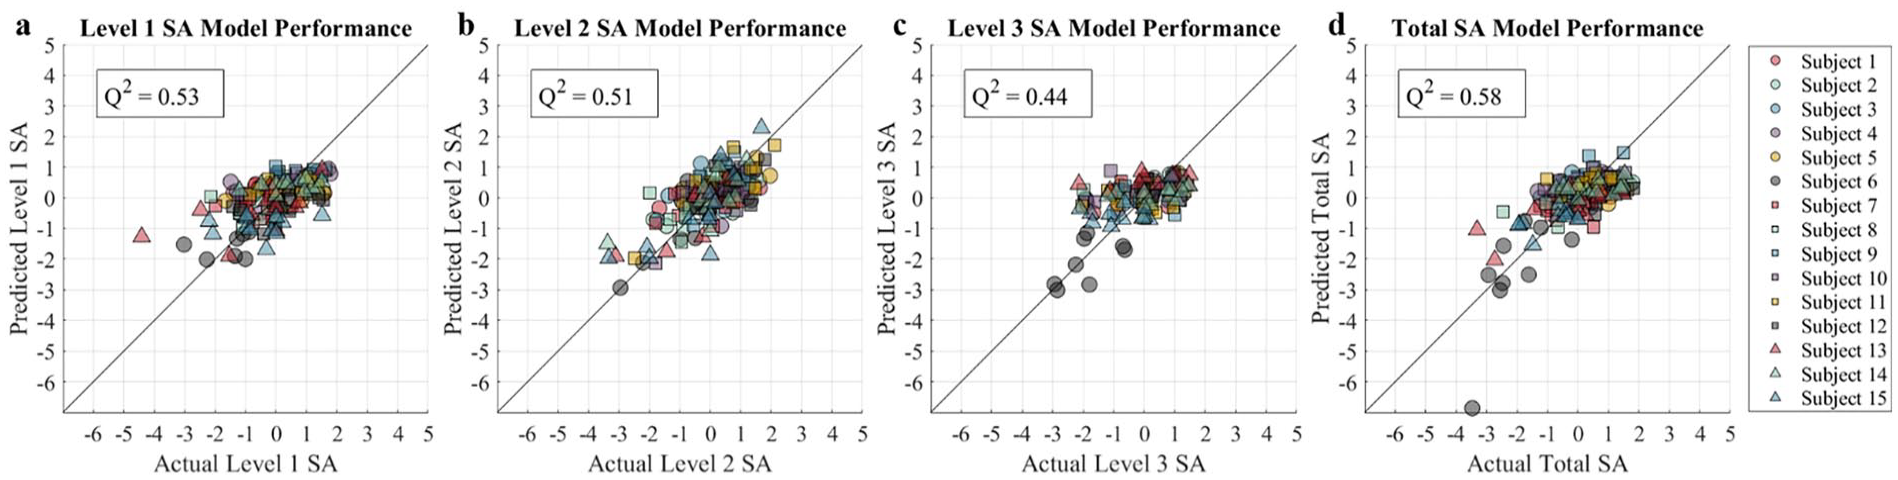
Actual SA Scores compared to model predictions at (a) Level 1 SA: Perception, (b) Level 2 SA: Comprehension, and (c) Level 3 SA: Projection. Q2 values represent model fit on data excluded from model-building, not feature selection.
The level 1 model incorporates 4 features from eye tracking and fNIRS, the level 2 model incorporates 25 features from eye tracking, fNIRS, and EEG, the level 3 model incorporates 12 features from fNIRS and EEG, and the total SA model incorporates 9 features from eye tracking and fNIRS. Figure 4 breaks down features by source device. The full list of features calculated can be provided upon request.
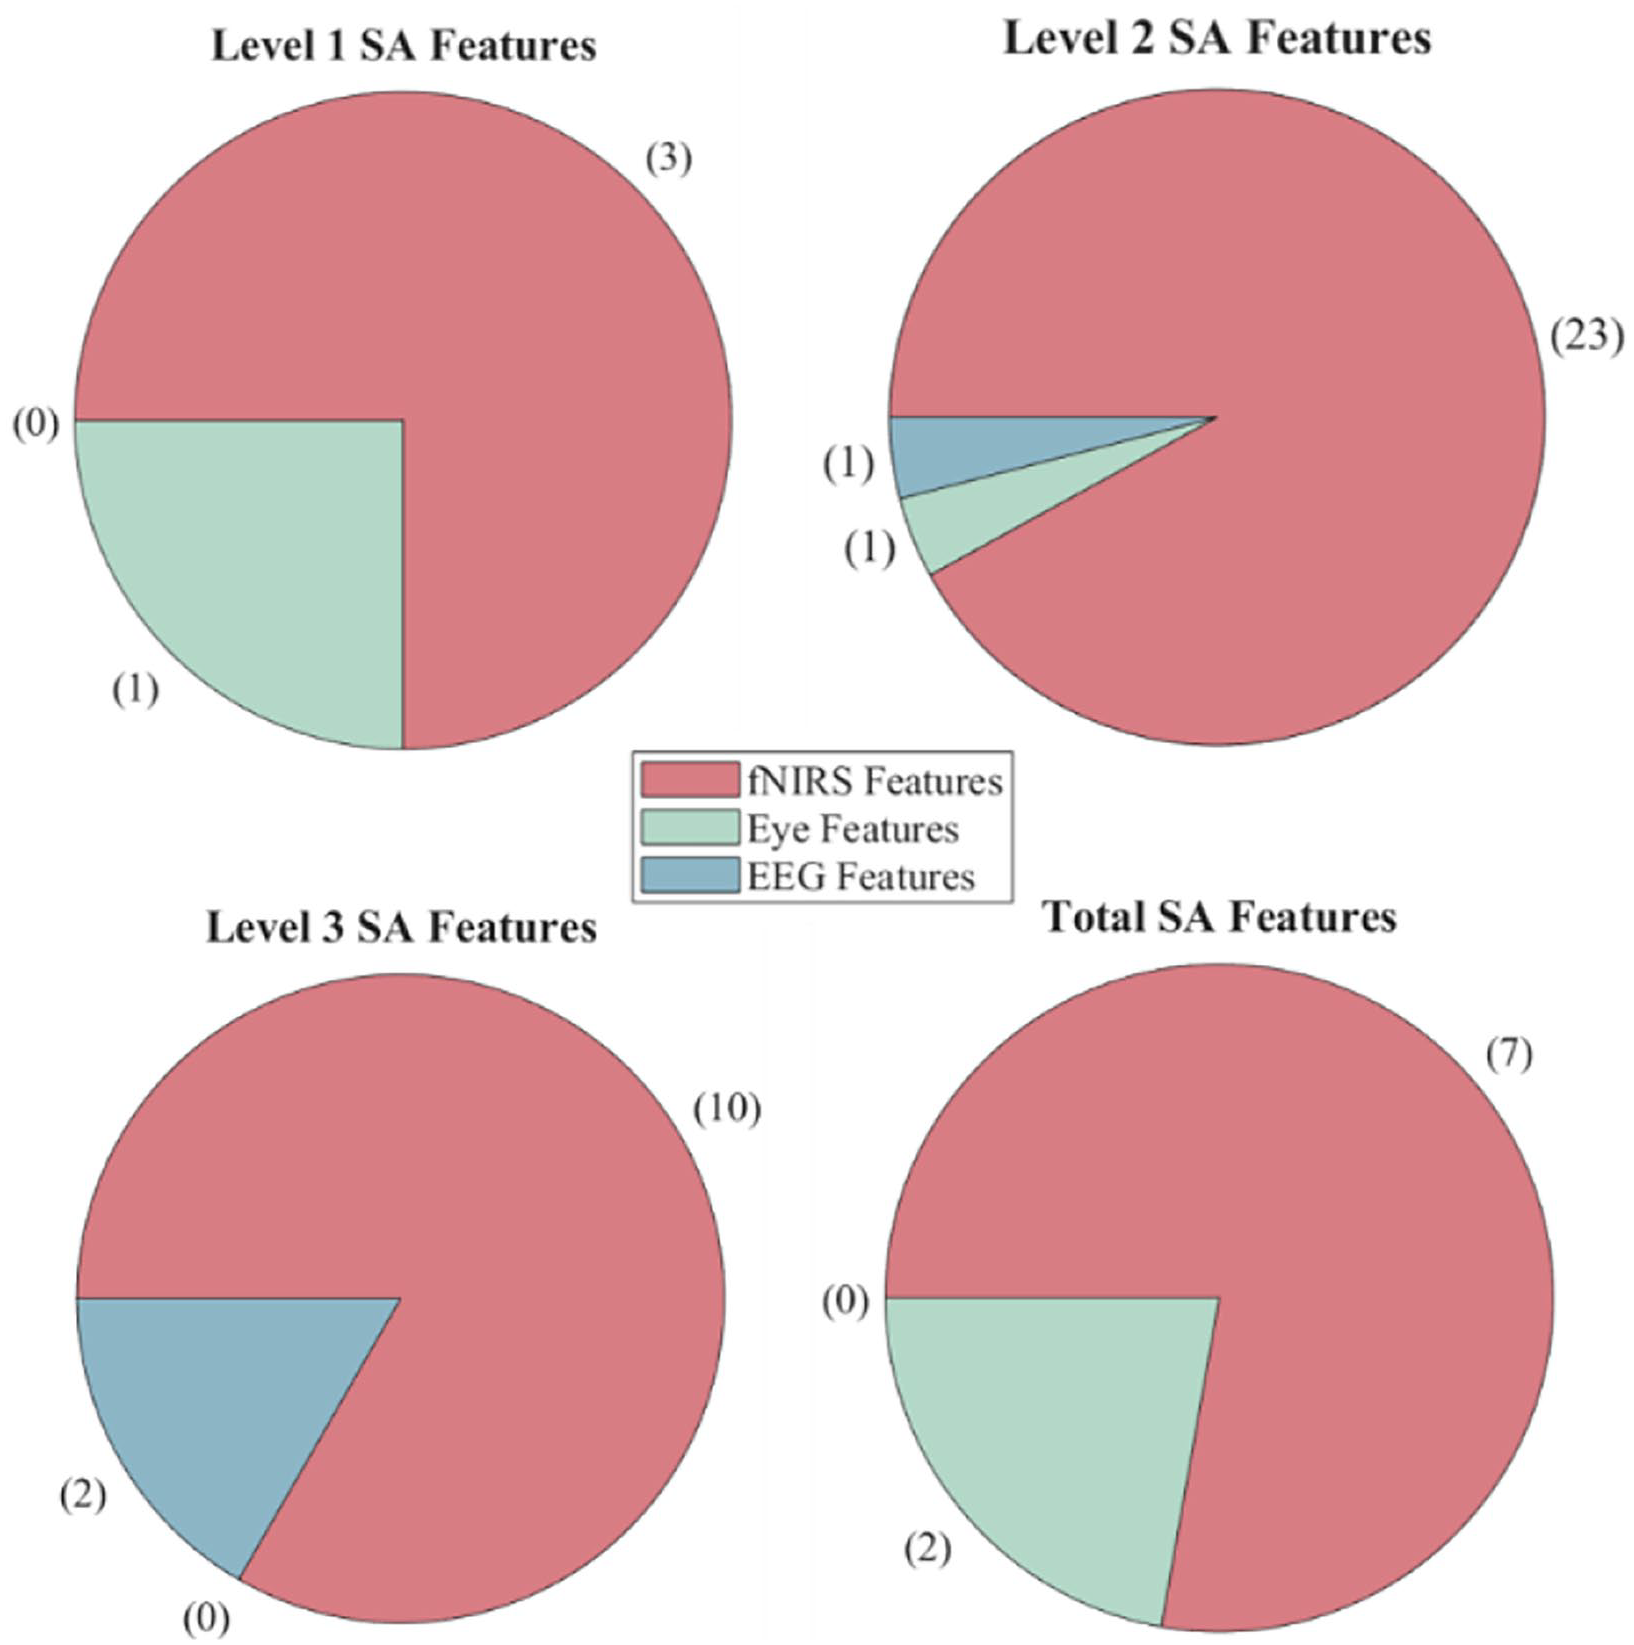
Features selected by LASSO regression algorithm for each model, organized by sensor type. Features from electrocardiogram, respiration, and electrodermal activity were never selected.
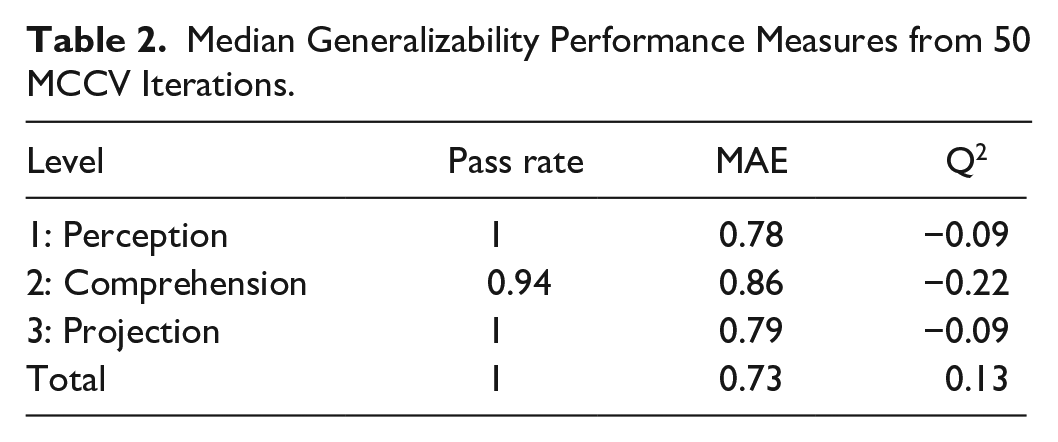
In the MCCV analysis, Level 1 SA models passed cross-validation criteria on 100% of the iterations. Models that did not pass were excluded from performance analysis. Successful Level 1 SA models showed a median MAE of 0.78 and a median Q2 of −0.09 when evaluated on data held-out from both feature selection and model-building. Results for Levels 2, 3, and Total SA can be seen in Table 2.
Median Generalizability Performance Measures from 50 MCCV Iterations.
Conclusions
Takeaways
Our task induced a range of SA scores at each level (perception, comprehension, and projection). Level SA scores had small, significant correlations with one another, aligning with the notion that the levels of SA interact yet represent separate cognitive processes. While it is unexpected that SA scores were not related to MATB-II performance, freeze-probes are commonly and effectively used to measure SA (Endsley, 2021), and the queries in this study were derived from a goal-directed task analysis (Endsley, 1988). Future work will investigate additional performance measures beyond those describe in this paper.
Model performance found that a broad combination of physiological signals could capture up to 58% of the variance in SA outcomes. While this shows promise for models collected from a larger participant pool, the authors recommend caution in interpretation. While regression models were extensively cross-validated, feature selection was performed using all data points. When both feature selection and regression fitting were performed on a training set and models were evaluated on a wholly separate test set, Q2 values decreased dramatically, suggesting poor model performance. It should be noted that this cross-validation process evaluates feature selection and model-building on only 70% of the collected data and likely presents a pessimistic outcome. Future work should evaluate what sample size might be needed to generate useful population-based predictions of SA.
While poor generalizability suggests that the multimodal physiological models of SA presented in this work may not be useful on a new operator or a new trial, there are other ways in which predictive models of SA could be used. Physiological responses vary widely between individuals, but models trained on a single individual could account for this variance and provide predictions of SA that might generalize for additional observations of the same individual. Future work should rigorously investigate performance of such “individualized” performance. These models could provide a nondisruptive, continuous measure of SA, overcoming many of the limitations of freeze-probe methods while maintaining sensitivity to objective measures.
Footnotes
Acknowledgements
This work extends additional thanks to Sofia Ibarra for assistance in data collection and to the Engineering Excellence Fund for supporting her efforts.
Declaration of Conflicting Interests
The author(s) declared no potential conflicts of interest with respect to the research, authorship, and/or publication of this article.
Funding
The author(s) disclosed receipt of the following financial support for the research, authorship, and/or publication of this article: This work was supported by a Draper Scholarship and a National Science Foundation Graduate Research Fellowship.