
Abstract
Factors affecting the time it takes a human to respond to an alert may include alerting system design, operator characteristics such as age or experience, or the operating environment. Using the aviation domain as one example, this variety of factors makes it difficult to specify what “acceptable” pilot response times are, as one cannot assign a value that will be consistent across systems, people, and situations. Further, characteristics of the pilot population, operations, and flight deck technologies change over time, so that average pilot response times derived in the past may not represent accurately expected response times for pilots flying modern aircraft. This paper compiles the findings from both a literature review and a survey of NASA Aviation Safety Reporting System (ASRS) reports, documenting that the confluence of factors affecting pilot responses to alerts results in response times that are often longer and more variable than might otherwise be expected.
Keywords
Many factors may affect the time required for a human to respond to an alert, including the design of the alerting system, operator characteristics such as age or experience, or the operating environment. Here, we focus on factors in the aviation domain, as one industry where timely and accurate operator responses to alerts are critical to safety. However, the findings discussed here may be applicable to other domains where alerting systems provide indications of a problem, and a timely and accurate operator response is required. Although the functions of an aircraft alerting system and the processes which underlie pilot responses to an alert may appear straightforward, real-world observations and scientific research suggest a more complex pattern of determinants. Therefore, we provide an overview of findings from a literature review and from a survey of the National Aeronautics and Space Administration (NASA) Aviation Safety Reporting System (ASRS) reports to illustrate factors that affect pilot response times to alerts.
Characteristics of the pilot population, flight operations, and flight deck technologies change over time, so that average pilot response times derived in the past may not represent accurately the expected response times for pilots operating modern aircraft (Fercho et al., 2023). Responses are often longer or more variable than one might expect due to the variety of factors that may influence response times to alerts. This makes it difficult to specify what “acceptable” pilot response times are, as one cannot assign a value that will be consistent across systems, people, and situations. These issues pose a challenge to aviation safety regulators and also for companies who design aircraft and aircraft systems, as it is difficult to establish and validate requirements for safe and acceptable pilot response times to alerts. Thus, if times are specified to be used in certifying aircraft systems, these times may be too short to allow for real-world pilot response. It is important to identify factors that may influence the different phases that comprise total pilot response time.
Defining Phases of Human Responding
A human’s response to a stimulus is composed of several phases, each of which may be affected by different factors (Figure 1). Total response time is a summary of the times required to complete each of these phases. The first phase involves detection (sensory perception) of the alert. This activity can be disrupted by the pilot’s psychological state (fatigue, arousal, stress), any factor that diverts attention from the alert (other alerts, voice communications, narrow task focus), and properties of the aircraft alerting system. The second phase involves recognition (cognition) of the meaning of the alert. This may be influenced by task loading, familiarity with the alert, complexity of the alerting scenario, novelty of the alert or context, and alerting system design. The third phase is response formation (cognition and motor planning), either selecting a known response or creating a new and novel one, to address the problem. Factors affecting this phase are likely to include prior experience and training, task loading, availability of supplemental data (external) regarding possible options, and alerting system design. The final phase, response execution, involves executing a corrective action (cognition and motor execution). Timely completion of this phase can be affected by physical capabilities, aircraft-environment limitations on pilot response, competition from other required pilot responses, and alerting system design.
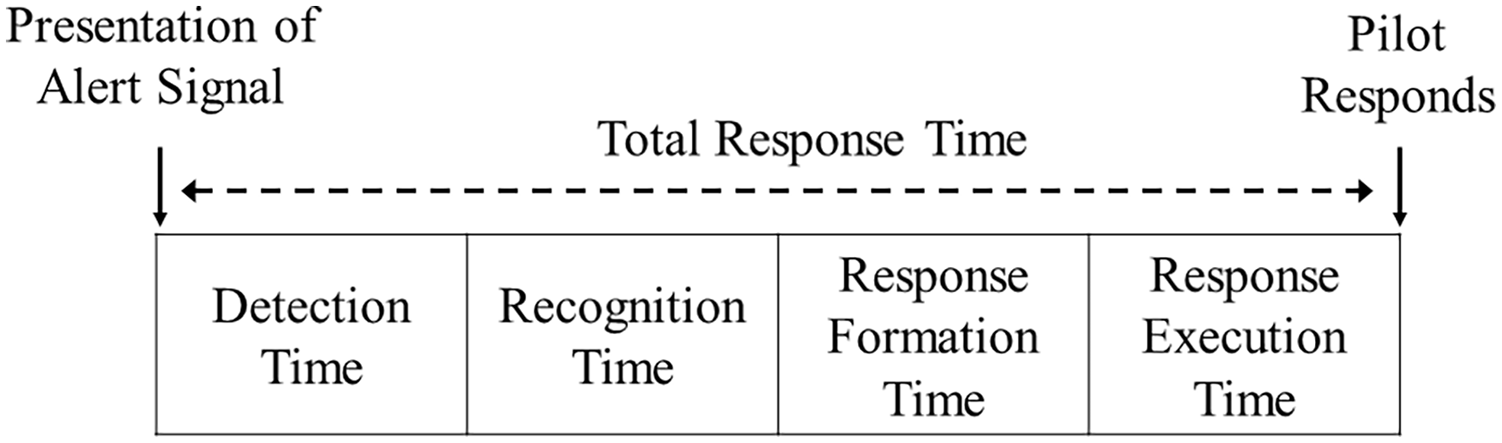
Phases of responding.
This paper is a review of literature on aircraft alerting systems and pilot responses, and a survey of NASA ASRS reports, with two associated aims. The first was to identify factors from the research literature that affect each of the phases of pilot response time to alerts. The second was to identify real-world incidents and causal factors for delayed pilot responses. Taken together, data from these sources provide evidence that the confluence of factors affecting pilot responses to alerts may result in response times that are longer and more variable than expected. Further, there may be factors that uniquely affect each phase of pilot response time.
Method
A literature review on aircraft alerting systems and a review of a sample of NASA ASRS reports were completed. The literature review was conducted in 2021 to 2022. Ten databases were searched to capture government, industry, and academic publications, using combinations of keywords related to aviation, alerts, and response. The ASRS database was searched for narratives containing the keyword “TCAS” (Traffic Collision and Avoidance System) logged between January 2018 and January 2023; TCAS was selected to serve as an example of one type of aircraft alert where a timely pilot response is required. Briefly, TCAS alerting systems are intended to provide collision-threat alerting. A traffic advisory (TA) supports the visual acquisition of intruder aircraft, and a resolution advisory (RA) provides recommended escape maneuvers, in the vertical dimension, to either increase or maintain the existing vertical separation between aircraft. A TCAS RA requires a prompt and appropriate response within seconds of the warning to avoid collision with another aircraft (Federal Aviation Administration, 2011). Additional ASRS search criteria included Federal Aviation Regulations Part 121; mission type: passenger; reporter function: captain, first officer, pilot flying, or pilot not flying; human factors issues: confusion, distraction, situation awareness, time pressure, troubleshooting, or workload.
Results
The literature search identified 274 journal articles, conference proceedings papers, book chapters, or dissertations relevant to this research review. Approximately 100 of these references provided numeric reaction or response times to an alert, event, or stimulus. Through a system of independent reading and research team discussions, the research findings were distilled into factors which affect each phase of response time—detection time, recognition time, response formation time, and response execution time—with brief summary accounts provided here. The ASRS database search resulted in 320 reports. For sake of brevity, we discuss only descriptive information, to illustrate real-world flight operation examples in which a delayed pilot response was reported.
Factors Affecting Detection Time
Detection time is marked by the detection and discrimination of qualitatively distinct sensory features of the aircraft alert, which may be modulated by pilot, environmental, operational, or alerting system design factors. Focusing on alerting system design, the presence of attention-getting cues that enhance conspicuity, such as the location, size, and color of the visual indicator, may affect the amount of time required to detect an alert. For example, detection times were shorter when a visual signal was presented in the pilot’s primary field of view, when the size of the indicator was at least 1° of visual angle, and when the alert was presented in the color red (Boucek et al., 1980, 1982). Examples of effective visual attention-getting cues included a flashing box around the most recent or highest priority message, or a flashing light signal against a steady background (Boucek et al., 1980).
For auditory alerts, signal frequency, intensity, location, content, tone or voice style, and background noise affected detection time. As one example, targets were localized faster for three-dimensional (3-D) audio alerts, compared to standard audio alerts (Begault & Pittman, 1994); this was especially true if the 3-D audio cue provided redundant verbal information, such as “down” when a target was located below the aircraft (Oving et al., 2004). However, a combination of the characteristics of the pilot, environment, and auditory signal may contribute to situations where an auditory alert is missed. For example, Beringer and Harris (1997) reported no difference in time required to diagnose an autopilot malfunction for malfunctions with an auditory alert and those without, and that some pilots reported not hearing the auditory alert. Here, it was likely that a combination of the effects of the headset, pilot hearing loss, and background noise put some pilots at risk of failing to detect auditory alerts.
The use of auditory alerts in conjunction with visual alerts may also help to reduce detection time by drawing a pilot’s attention to the alert (Bate, 1969; Boucek et al., 1985). Similarly, an auditory alert preceding a visual alert may orient the pilot’s attention to the alert, and also reduce the risk of a startle or surprise effect (Boucek et al., 1981). Providing predictive information prior to a parameter reaching an alert level of severity may support early detection of system failures, and also has the added benefit of later reducing recognition, response formation, and response execution times. This is because it may be easier to determine the system, component, or parameters associated with the failure (Trujillo et al., 2008).
Although tactile alerts are not widely used in aircraft alerting systems, research suggests that, in some situations, they may be associated with shorter detection times, as they “grab” the attention of the pilot. Further, they may be useful in a visually demanding flight deck environment, where visual attention is shared amongst different sources of visual information. However, there are some important considerations and scenarios where a tactile alert is not feasible. First, tactile signals may only be implemented through an aircraft control that is in constant contact with the pilot’s body. Second, tactile signals are not useful for conveying complex instructions or large amounts of information necessary to accurately diagnose complex problems (Prinet et al., 2016).
In addition to alerting system design, there may be pilot, environmental, or operational factors that affect detection time. Pilot expertise may influence sensitivity to alerts, with more expert pilots responding more frequently to alerts with an automatic, conditioned response (Zheng et al., 2014). The likelihood of not detecting an alert, or for longer detection times, is greater during high workload conditions compared to low workload conditions (Boucek et al., 1980; Dehais et al., 2014). Finally, detection times are often longer during the cruise phase of flight, when less attention is paid to monitoring engine instruments and flight variables (Flight Safety Foundation, 1999).
Individual ASRS narrative reports revealed areas in which operational factors may have had an effect on detection time. The following is an example where workload, environmental conditions, and expectation bias may have resulted in a delayed detection time for localizing traffic:
“After a diversion to our planned alternate we had a routine enroute and descent phase. We contacted Tower on about a 10 mile final. We were approximately 5 miles in trail of a B737, and we heard them check in as well. I overheard tower tell them about a Medevac helicopter who was operating to the east of the airport and transiting to the west. Once we were on about a 5-mile final, tower provided us with a traffic call for the same helicopter. . .Due to the lights of the city, I did not see the traffic, and it was not yet showing up on our TCAS. Inside of a 4-mile final, at approximately 1200 ft. we received a TA for the traffic. On TCAS it showed him at 200 ft. above us and inside a mile. . .I instructed the first officer to go slightly below the glide slope to increase our separation. Very shortly after that, at 1050 ft. we received a ‘DESCEND DESCEND’ TCAS RA. . .At our closest point, the helicopter was directly above us and approximately 200 ft. above, leading to a significantly reduced margin of separation. This event was caused by several factors. The helicopter pilot had us in sight and was maintaining visual separation, but in our opinion, the separation provided was not adequate. I was not able to visually identify the traffic until the TA occurred, and at that point there was very little we could do to avoid a loss of separation. I do not believe we should have been sequenced by air traffic control to pass directly underneath the medevac’s flight path. . .I should have made more of an effort to find the traffic prior to receiving a TA, but with the city lights it was difficult. This was at the end of a very high workload, 3 hour blocked flight with significant weather, holding, a diversion, and fuel considerations. . .”
Factors Affecting Recognition Time
Recognition of the meaning of an alert is important for timely and accurate pilot responses to a problem. An ambiguous alert may be neglected or may result in longer recognition times. If the alert is difficult to understand, it may be misidentified, leading to an incorrect response. Results from the literature review suggest that several aspects of aircraft alerting system design have an effect on recognition time. In general, alerts that unambiguously convey information about the urgency, source, and nature of the problem are associated with shorter recognition times.
There are several features of auditory alerts that may influence recognition time. Many auditory alerts use arbitrary sounds, and pilots have to learn their meanings and recall those meanings from memory often under high workload conditions. When the auditory alert is an arbitrary sound, it may convey little information or guidance, resulting in increased recognition time. Focusing on voice messages, research suggests that voice messages may be associated with shorter recognition time than tone signals, as they reduce the need to crosscheck instruments and displays before recognizing the alert and responding (Kemmerling et al., 1969). Features of voice messages, such as talker sex, voice style, and background noise may have an effect on recognition accuracy and speed (Arrabito, 2009). In a quiet environment, monotone and urgent voice styles resulted in the shortest response times regardless of talker sex. However, in a noisy environment, a male talker in either monotone or urgent voice style was associated with shorter response times and an improvement in word identification accuracy. Similarly, auditory warnings with linguistic redundancy, such as with longer sentence-style format, may be associated with increased comprehension and reduced recognition time (Hart & Simpson, 1976). Finally, repeating an auditory warning may result in shorter recognition times (Freedman & Rumbaugh, 1983).
Iconic alerts, which convey information about the nature of the alert, may support shorter recognition times in both low and high workload conditions (Perry et al., 2007). Further, iconic auditory messages have an added benefit of not being susceptible to information masking from background noise such as radio communications. However, it may not be realistic to implement a unique iconic alert for every scenario where an auditory alert would be useful (e.g., what is the icon of an alert for high altitude?).
More urgent alerts may be associated with shorter recognition, response formation, and response execution times. Urgency may be influenced by the color of the visual alert (e.g., red for urgent and white for less urgent), the type of auditory alert (e.g., voice message such as “traffic alert, traffic alert” for more urgent and a chime for less urgent), or other cues such as a countdown timer (Consiglio et al., 2010).
The following example ASRS narrative report provides an example where environmental (weather), operational, and alerting system characteristics affected recognition time:
“I felt like I was a bit slow to recognize the (traffic) threat and I could have slowed our descent thru FL300 until it was clarified, but in all reality the speed in which the event occurred combined with the doubt that what you’re actually seeing is accurate lead to the delay. I had the range dialed out and at first I thought the traffic must be further away or the controller would have mentioned it. I thought for a few seconds that we must be descending thru the other aircraft’s altitude in time to avoid a conflict. I was also working my descent around a large (weather) cell and trying to stay above several smaller buildups as we passed it but still keep the aircraft on profile when we rejoined the arrival. Multiple aircraft communicating at once also played a major role in the confusion. As is the case with so many incidents it all came to together at the WRONG time.”
Factors Affecting Response Formation Time
There are characteristics of the operation, the pilot, and the alerting system design that may have an effect on response formation time. In general, response formation time may be influenced by the complexity of the problem, the information available, and any associated increase in the complexity of the pilot’s neuromotor programing process. For example, the content of the alert message, combined with information available from other sources, may affect response formation time. When there are conflicting sources of information, pilots may take additional cognitive processing steps to confirm that the aircraft alert matches their evaluation, rather than simply following the command guidance or training procedures. This may happen if the pilot is concerned that the alerting system is not acting as it should, if the alerting system is associated with false alarms or nuisance alerts, if the pilot believes the alerting system is not considering all relevant information, or if the pilot places greater confidence on their own decisions (Pritchett, 1997). Response formation time is thus affected by alerting system design, along with operational and pilot factors.
Response formation times may be shorter for guidance messages that emphasize the correct pilot action, or that show what is still operational (Berson et al., 1984). Longer pilot response formation times may be associated with alerting systems that only provide status information, or which display fault messages as a long reading list that doesn’t support prioritization (Singer & Dekker, 2000). Visual displays that use intuitive symbology, such as an arrow to indicate the desired direction of movement, may be associated with shorter response formation time, compared to less intuitive symbology such as a flight director dot (LaLumiere-Grubbs et al., 1987).
The following example ASRS narrative report provides an example where pilot factors (fatigue and recent experience) affected recognition time:
“After take-off he (first officer) entered a 30-degree steep turn to the left. I told him no turns till past the [landmark] but he didn’t respond. I took the aircraft away briefly and started a turn right to get in a more westerly heading. He said he was just following the command bars. . . He was VERY tired on the flight up from ZZZ1 though. VERY tired. And he missed quite a bit of stuff. Lots of calls from ATC. I called for flaps three times before taxiing from our gate at ZZZ1. He said his flying experience had been almost nil. On deplaning at ZZZ1 he stated he should have informed me that he has not flown a takeoff or landing in an actual airplane in over a year.”
Factors Affecting Response Execution Time
Response execution time may be impacted by factors related to cognitive processing and motor execution, such as the pilot’s perception of urgency, complexity of the situation, source or location of the problem, and necessary steps to correct the problem. Response execution time may be affected by operational, pilot, and aircraft alerting system design characteristics. For example, response execution times are often longer for events that are unexpected, likely due to a surprise or startle effect. In one study, airline pilot response times to unexpected low-level wind shear were longer than when wind shear was expected (Casner et al., 2013). In another study, general aviation pilot response times to an unexpected engine failure were longer than to an expected engine failure, and nearly 45% of those participants had an accident or attempted a water landing (Kinney & O’Hare, 2020). This increase in response execution time may be due to a surprise or startle effect, as pilots in the unexpected engine failure condition had a higher heart rate and larger mean increase in pupil dilation.
Response execution time may also be affected by aircraft alerting system design. For example, response execution time may be longer if the system has a high rate of false and nuisance warnings. Response execution time is also affected by pilot factors such as fatigue, the adequacy of initial and recurrent training, and pilot judgment of whether the recommended recovery procedure is deemed unnecessarily violent or extreme. It may also be affected by operational factors such as the presence of other flight deck warning lights and sounds, adding to the complexity of the scenario (DeCelles, 1991).
The following example ASRS narrative report provides an example where pilot factors (recent experience) and operational factors (lighter aircraft resulting in a faster rate of climb) affected response execution time:
“After departure given heading of 360, climb to 7,000 feet. Approaching level off we received a TCAS RA due to crossing arrival traffic (right to left) at 8,000 feet. Traffic was in sight prior to event and throughout event. We leveled off at 7,000 feet. No separation was lost. Aircraft was climbing rapidly to 7,000 due to light weight. The rate of approach triggered the TCAS RA. As pilot flying I should have intervened and reduced our rate of climb upon seeing the traffic and potential conflict. This was my first leg back after two months not flying.”
Conclusion
From the literature review and a sampling of representative NASA ASRS reports it can be concluded that the time it takes a pilot to respond to an aircraft alert may not be a simple, constant value. Pilot response times to aircraft alerts are influenced by a variety of factors, including the aircraft alerting system design, the flight operation, and the pilot operator. Pilots possess varying skill levels; aircraft and alerting systems have different capabilities; and a single flight operation will expose the pilot to different speeds, altitudes, trajectories, traffic, communication requirements, and weather/environmental conditions during the various phases of flight. Together, this confluence of factors increases the variability observed for normal pilot performance during flight operations. Certainly, response times to an alert may be made shorter as a result of effective aircraft alerting system design and pilot training. However, even during routine flight operations, there may be situations that increase pilot response times to alerts, such as higher workload phases of flight, sources of distraction, expectation bias based on previous experience, or even conflicting sources of information.
From a safety regulatory perspective, it is important to periodically reevaluate the basis and validity of requirements and guidance used to evaluate and approve flight deck technology, to ensure that they are adequate and appropriate from the perspective of the pilot on a modern aircraft flight deck. A consideration of the convergence of evidence from the scientific literature on aircraft alerting systems and observations from real-world operations is important in this process.
Thus, the examination of what is contained in the literature about factors influencing response time and its components provides us with the underlying empirical evidence that should allow us to predict what we are likely to see in the real world for any given situation. That is dependent, however, upon a clear and careful determination of what factors are present in real-world operations that can be tied back to the empirical underpinnings. The examination of the NASA ASRS reports allows us to evaluate whether or not the things that one might expect (from established human-performance data) to occur, and for what reasons, actually do occur during real-world operations. This determination should, of course, be tempered by the realization that ASRS is a voluntary reporting system and that it is possible that not all types of situations of interest, or that actually occur in the real world, are necessarily represented in the ASRS reports.
Together these sources provide evidence that the confluence of factors affecting pilot responses to alerts can produce response times that are often longer and more variable than expected. Although our focus was on the aviation domain for this research, many of the findings here are applicable to other domains, examples of which include medicine, ground transportation, nuclear powerplant operations, mining operations, maritime operations, and industrial operations. As such, this same approach may be applicable to many other domains in which optimizing human response times is critical to successful system operations.
Footnotes
Acknowledgements
The authors would like to thank the FAA Program Manager, Robert McGuire.
Declaration of Conflicting Interests
The author(s) declared no potential conflicts of interest with respect to the research, authorship, and/or publication of this article.
Funding
This research was funded by the FAA Aviation Research Division in support of the FAA Office of Aviation Safety.