
Abstract
Background:
The effect of tibiotalar joint line level (TTJL) on patient outcomes following total ankle arthroplasty (TAA) remains unclear. It was previously reported that patients with end-stage ankle arthritis have an elevated TTJL compared with nonarthritic ankles, and the TTJL post-TAA remains elevated compared with nonarthritic ankles. The objectives of this study were to (1) propose a reliable radiographic method to measure the TTJL absolute value and (2) determine the effect of TTJL alterations on tibiotalar range of motion (ROM) following TAA.
Methods:
A retrospective review was performed on patients who underwent TAA between January 2018 and April 2021 with a minimum of 1-year postoperative follow-up and complete perioperative ROM radiographs. Radiographic TTJL and ROM measurements were performed by 2 observers. The proposed TTJL measuring technique computes 4 measurements: high, low, center of the talus (center), and center of the axis (axis). Reliability of measurements and correlation between TTJL measurements and ROM were assessed.
Results:
A total of 33 patients were included. Postoperatively, 22 patients had a lowered TTJL compared to 11 patients with an elevated TTJL (2.2 ± 1.3 mm lowered vs 1.9 ± 1.2 mm elevated; P < .0001). Of the 4 TTJL measurements, 3 (low, center, axis) demonstrated a significant positive correlation between lowering the TTJL and improved tibiotalar dorsiflexion and 2 (low, axis) for total ROM (all P < .05). Plantarflexion was not significantly affected by TTJL alterations. Compared to patients with an elevated TTJL, patients with a lowered TTJL had improved tibiotalar dorsiflexion (8.8 vs 2.5 degrees; P = .0015) and total ROM (31.0 vs 22.9 degrees; P = .0191), respectively. The interrater reliability was nearly perfect (intraclass correlation r = 0.96-0.99).
Conclusion:
In this small series, we found that lowering the TTJL level may more closely reestablish the native TTJL and correlates with improved tibiotalar dorsiflexion and total ROM following TAA.
Level of Evidence:
Level IV, case series.
Keywords
Background
With the increased use of total ankle arthroplasty (TAA) for the treatment of end-stage ankle arthritis, the effect of the tibiotalar joint line (TTJL) level on patient outcomes remains unclear. Many ankle arthroplasty concepts have been adopted from the knee and hip arthroplasty literature. The knee arthroplasty literature has extensively studied the importance of restoring the native joint line and the effects of both elevating and lowering the joint line. However, TTJL level has been an understudied and perhaps underappreciated concept in TAA.
Starting in the 1970s, concepts including restoration of flexion and extension gaps to balance the knee ligaments 17 as well as restoration of the knee joint line 28 were introduced. Subsequently, a large body of evidence has been produced to highlight the role of the joint line on knee arthroplasty outcomes and the importance of restoring the physiologic joint line. Specifically, the joint line has been shown to affect implant and collateral ligament stability, weightbearing of loading surfaces, clinical outcomes, functional outcomes (range of motion), wear properties, and prosthesis survival.2,28,38 Joint line elevation after total knee arthroplasty is associated with patella baja, impingement of the patella on the tibial component, increased patellofemoral contact forces, anterior knee pain, increased component wear, extensor mechanism failure, and midflexion instability, whereas joint line depression after total knee arthroplasty may result in patella alta, a potential risk of patella subluxation, tightening of midrange knee motion, and retropatellar pain.14,21,26,28,30 The concept of joint line restoration is particularly important in the setting of revision arthroplasty, and there have been multiple measurement techniques and constant bony landmarks described for perioperative joint line evaluation. A critical threshold of anywhere from 2 to 8 mm, most commonly 4-5 mm, of joint alteration has been described for maintenance of optimal outcomes.7,8,13,25,30,31,36
In regard to the TTJL and ankle arthroplasty, Harnroongroj et al 19 described the first method for measuring the TTJL before and after TAA termed “joint line height ratio.” The authors reported excellent inter- and intrarater reliability of their radiographic measurements (r > 0.9). The authors also reported that ankles with end-stage arthritis have an elevated TTJL compared with nonarthritic ankles, and the TTJL level post-TAA remained elevated compared with nonarthritic ankles. They called for further studies to examine the effect of joint line elevation on patient-reported outcomes and postoperative range of motion (ROM) following TAA.
Thus, we sought to study tibiotalar ROM. Previous knee and ankle arthroplasty literature have identified preoperative ROM as the primary determinant of postoperative ROM following arthroplasty.1,4,24,33 Additionally, multiple studies have reported that the progression of ROM is observed within the first year postoperatively and that patients should expect to plateau and maintain their 1-year postoperative degree of motion for the life of their implant.1,20 TAA has been shown to improve gait function with both pre- and postoperative ROM predictive of overall postoperative gait function.5,6,15 Ankle ROM following TAA is positively correlated with multiple disease-specific and generic health-related quality of life patient-reported outcome measures (PROMs). 11 Given these findings, it is imperative to identify factors that may contribute to the preservation of ROM following TAA.
Although not yet studied in the ankle, femoral joint line restoration has been identified as a major determinant of postoperative ROM following total knee arthroplasty with elevation of the joint line resulting in patella baja and decreased ROM.3,18,34 A recent study by Klemt et al 25 reported a linear negative correlation between joint line elevation in both in vivo knee kinematics and PROMs. Specifically, knee joint line elevation of greater than 2.6 and 2.3 mm resulted in a clinically significant loss in PROMs and maximum flexion angles, respectively. Additionally, a cadaveric study highlighted biomechanical considerations, finding that knee joint line elevation significantly affects knee kinematics, patellofemoral contact area, and produced inferior edge loading/impingement between the patella and tibial components. 16 The authors postulated that their findings result in loss of knee ROM, postoperative pain, and premature component wear. This concern for component wear with joint line alterations was further confirmed with a recent study analyzing retrieved polyethylene components where the authors reported an increased wear rate with both joint line elevation and increased posterior tibial slope. 32 A recent systematic review, summarizing 27 studies with 8 studies included in the correlation analysis, reported a statistically significant negative correlation between joint line elevation and the postoperative Knee Society Score function score. 36 Elevation of the ankle joint line level may lead to similar consequences, which warrants further investigation for improved understanding.
The objectives of this study were to (1) propose a reliable radiographic method to measure the TTJL absolute value that can be applied both pre- and postoperatively following TAA and (2) determine the effect of TTJL alterations on tibotalar range of motion (ROM) following TAA. The hypothesis was that alterations to the TTJL would not significantly impact tibiotalar ROM following TAA.
Methods
Following institutional review board approval, the electronic medical records of all patients who underwent primary TAA at a single institution between January 2018 and April 2021 were retrospectively reviewed. The procedures were performed by 4 foot and ankle fellowship-trained orthopaedic surgeons experienced in ankle arthroplasty. All patients were treated with a similar postoperative protocol: immobilization in a short leg plaster splint for 2 weeks, then immobilization in a controlled ankle motion (CAM) boot with ankle ROM exercises encouraged, nonweightbearing in the CAM boot for a total of 4-6 weeks, and initiation of physical therapy at week 4-6 with weightbearing in the CAM boot for about 2 weeks, at which time the patient transitions into normal shoewear as tolerated. Beginning at 2-3 weeks postoperatively, the patient is instructed to perform nonweightbearing active ankle ROM exercises about 5 times a day for 20 minutes each. Weightbearing and passive ROM exercises are later initiated at physical therapy.
Inclusion criteria for the study required patients to have a minimum of 1-year postoperative follow-up. Additionally, all patients completed pre- and postoperative weightbearing anteroposterior (AP) and lateral ankle radiographs with postoperative lateral dorsiflexion and plantarflexion ROM radiographs at a minimum of 1 year postoperatively. Exclusion criteria included patients undergoing revision ankle arthroplasty, inadequate follow-up, patients with incomplete radiographs, or patients with concomitant pathology or procedures that may alter their constant bony landmarks, particularly the medial and lateral malleoli. Specifically, this included any bony work at the ankle or hindfoot including open reduction and internal fixation of the medial or lateral malleoli, medial or lateral malleoli osteotomy, calcaneal osteotomy, or subtalar or talonavicular arthrodesis. Additionally, patients with a concomitant lengthening procedure (tendo-Achilles lengthening or gastrocnemius recession) were also excluded given the potential to confound ROM.23,24
All weightbearing AP ankle radiographs were taken with the same radiographic technique using X-CEL X-ray (Crystal Lake, IL). The patients were placed in standing position with the beam projection directly perpendicular to the operative leg. The source to image distance was 76 cm with a source setting of 65 kilovoltage peak (kVp) and 1.3 milliampere seconds (mAs).
Weightbearing ROM radiographs were obtained as previously described with high inter- and intrarater reliability.9,23 Lateral dorsiflexion radiographs were taken with the patient standing while asked to bend the ipsilateral knee forward as far as possible without lifting the heel off the floor. Lateral plantarflexion radiographs were taken with the patient standing while asked to straighten their ipsilateral knee and to bring their leg parallel to the floor as far as possible without lifting their toes off the floor. A neutral lateral radiograph with the patient standing in a straight upright position was also obtained along with standing AP and mortise oblique views.
Data collected from the patients’ medical records included age, sex, underlying arthritis etiology, TAA prosthesis implanted, and length of radiographic follow-up. Three third-generation, fixed-bearing prostheses were used: Salto Talaris and Cadence (Smith & Nephew, Watford, England) and Infinity (Stryker, Kalamazoo, MI). Prosthesis type was at the surgeon’s discretion, including experience with the implant and patient factors such as preoperative deformity, bone quality, periarticular cysts, and bone loss.
TTJL measurements were performed on both pre- and postoperative weightbearing imaging, and ROM measurements performed on postoperative weightbearing imaging. Radiographic measurements were made using standard tools on the PACS system (MergePACS; IBM Watson Health, Armonk, NY). All measurements were performed by 2 raters: 1 foot and ankle fellowship-trained senior orthopaedic surgeon and 1 foot and ankle fellow.
Joint Line Measurements
The technique for obtaining the TTJL measurements is outlined in Figures 1 and 2. The technique involves a transmalleolar line (Figure 2, royal blue), a distal tibia-fibula reference circle (Figure 2, yellow), a longitudinal axis line (Figure 2, yellow), and a horizontal reference line (Figure 2, magenta), all of which remain constant from pre- to postoperative. The horizontal reference line is 90 degrees to the long axis line and bisects the center of the distal tibia-fibula circle. It is from this reference line, again, which remains consistent pre- to postoperatively, that the TTJL measurements are made. The “high-side” (high) measurements included the lateral joint line measurement for valgus ankles and the medial joint line measurement for varus ankles. The “low side” (low) measurements included the medial joint line measurement for valgus ankles and the lateral joint line measurement for varus ankles.
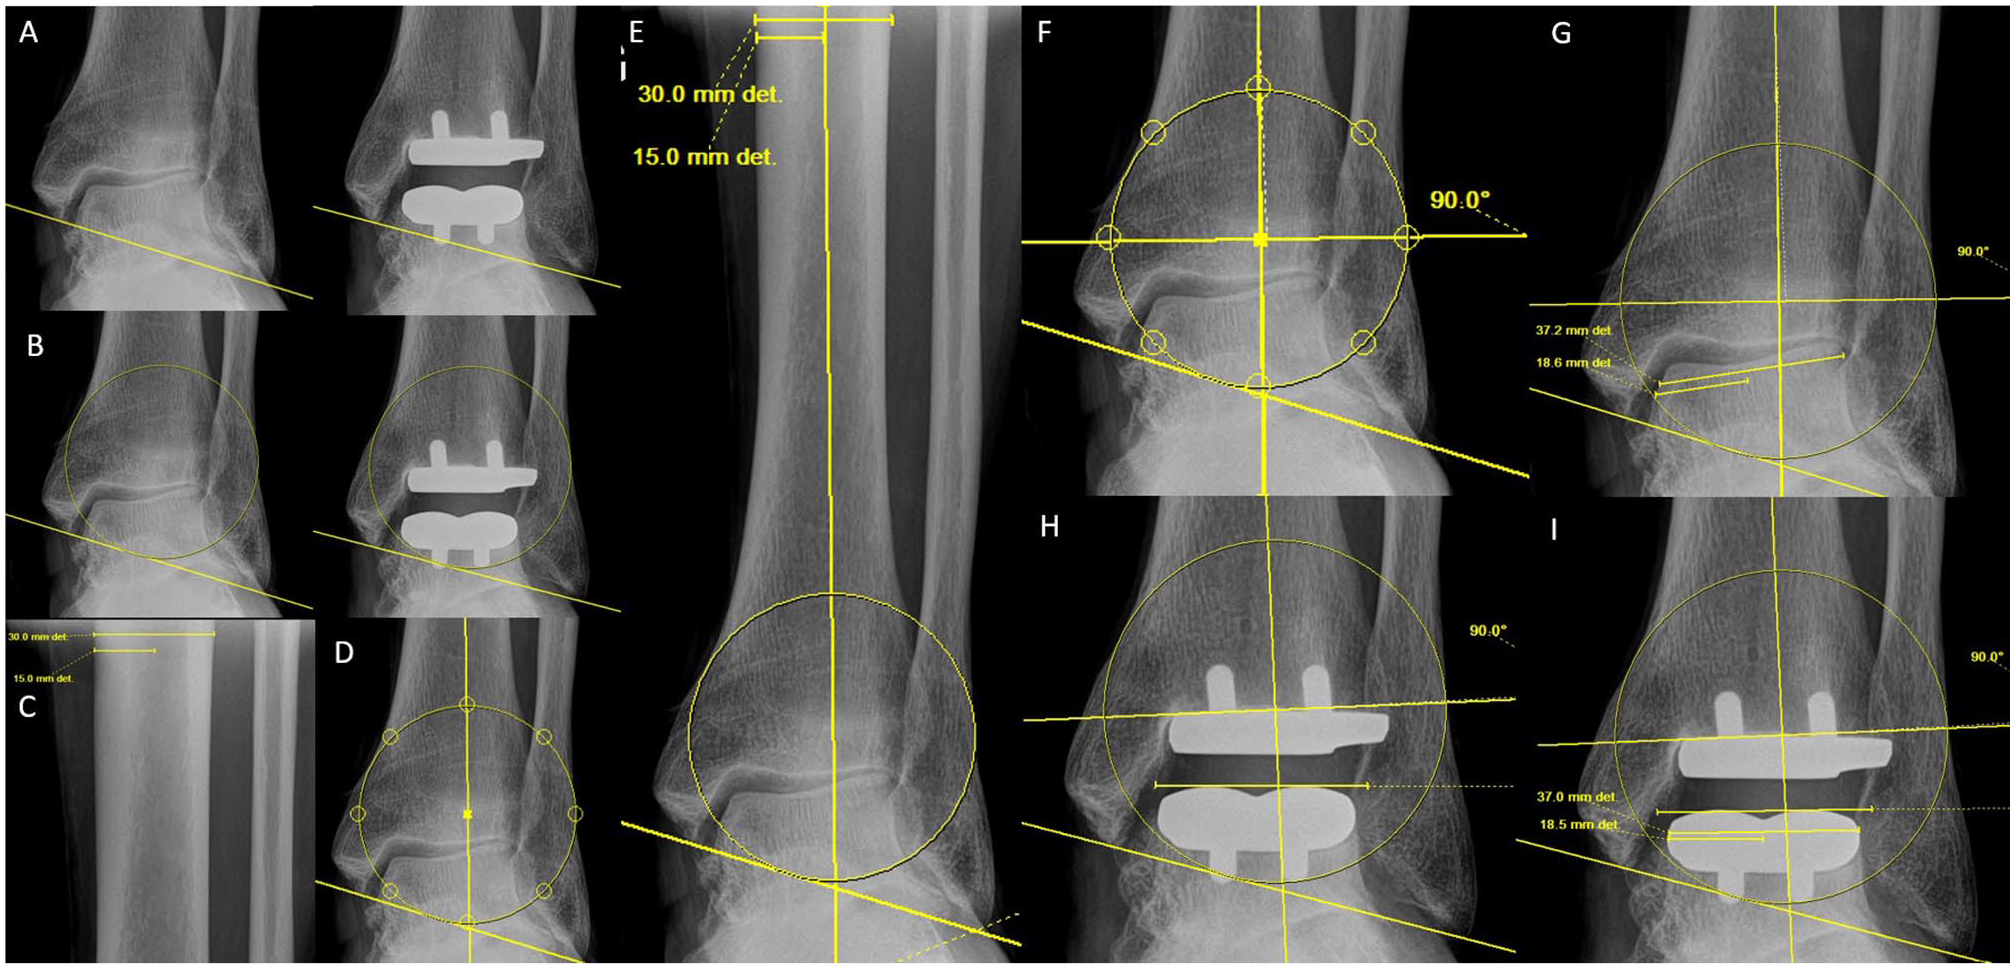
The following technique was used for establishing the reference line for the tibiotalar joint line measurements. It is recommended to open the weightbearing anteroposterior pre- and postoperative radiographs side-by-side on the image viewer to ensure constant landmarks and reference lines. (A) Transmalleolar line: Using the ruler or line tool, draw a straight line from the most distal aspect of the medial malleolus to the most distal aspect of the lateral malleolus. This transmalleolar line should remain consistent between the pre- and postoperative radiographs. Typically, the most distal aspect of the medial malleolus represents the anterior colliculus. If osteophytes were debrided or there was any other interval change from pre- to postoperative, the tip of the posterior colliculus may be used. Regardless, the most important factor is that the medial malleolus landmark remain constant. (B) Circle: Using the circle tool, draw a circle above the transmalleolar line to include the lateralmost extent of the distal fibula and the medialmost extent of the distal tibia. The distal aspect of the circle should be in contact with the transmalleolar line. (C) Identify the center of proximal tibia: Using the measuring tool, measure the width of the proximal tibia as far proximal as the radiograph allows. Take half of that measurement to identify the center of the proximal tibia. (D, E) Longitudinal axis line: From the center of the proximal tibia, draw a line that bisects the center of the circle distally. The PACS software used identifies and marks the circle center. (F) Horizontal reference line: Using the Cobb angle tool, draw a horizontal line 90 degrees perpendicular to the long axis line. Move this horizontal line to bisect the center of the circle. This is the horizontal reference line. (G) Identify the center of the talus: Using the ruler tool, measure the width of the proximal talar body, just distal to where the talar shoulder starts. Take half of that measurement to identify the center of the talus. (H, I) Identify the top of the prosthetic talus: Using the rule or line tool, draw a horizontal line across the top of the talar component on the postoperative radiograph. The final joint line measurements are vertical lines drawn perpendicular from the horizontal reference line to the top of the preoperative native talus or postoperative prosthetic talar component.
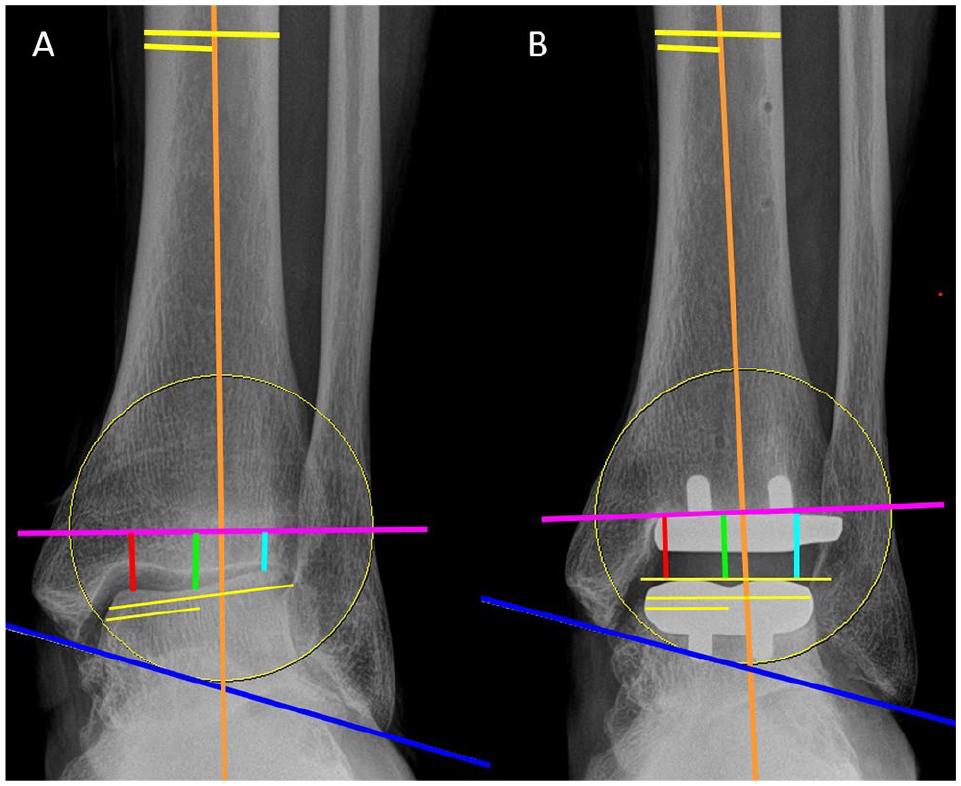
(A) Preoperative and (B) postoperative weightbearing anteroposterior radiographs with longitudinal axis line (orange), transmalleolar line (royal blue), and horizontal reference line (magenta). The 4 joint line measurements are high (light blue), low (red), center-of-talus (green), and center-of-axis (orange). In this example, there is a valgus deformity at the tibiotalar joint. The high-side measurement is lateral for a valgus ankle and medial for a varus ankle (high-side measurement has the smaller value). The following technique was used for establishing joint line measurements: Draw 4 vertical lines from the horizontal reference line (magenta) to the top of the talus at the following 4 locations. Medial joint line (red): Measure at the medial aspect of the talus, just lateral to the medial talar shoulder; the medial joint line represents the low-side measurement for a valgus ankle the high-side measurement for a varus ankle. Lateral joint line (light blue): Measure at the lateral aspect of the talus, just medial to the lateral talar shoulder; the lateral joint line represents the high-side measurement for a valgus ankle and the low-side measurement for a varus ankle. Medial and lateral joint line points should represent the “highest” or “lowest” aspect of the talar dome based on coronal plane deformity; Center-of-axis joint line (orange): Measure at the center of the circle. Center-of-talus joint (green): Measure at the central point of the talar width. [See online article for color figure.]
Range of Motion Measurements
Postoperative tibiotalar ROM was measured using the technique described by Coetzee and Castro 9 and further demonstrated to be reliable by Jeng et al. 23 The Cobb angle was measured between a line drawn on the top of the tibial component baseplate and a second line drawn under the anterior and posterior aspects of the talar component on the lateral radiograph. This angle was measured with the ankle in maximal dorsiflexion and maximal plantarflexion (Figure 3).
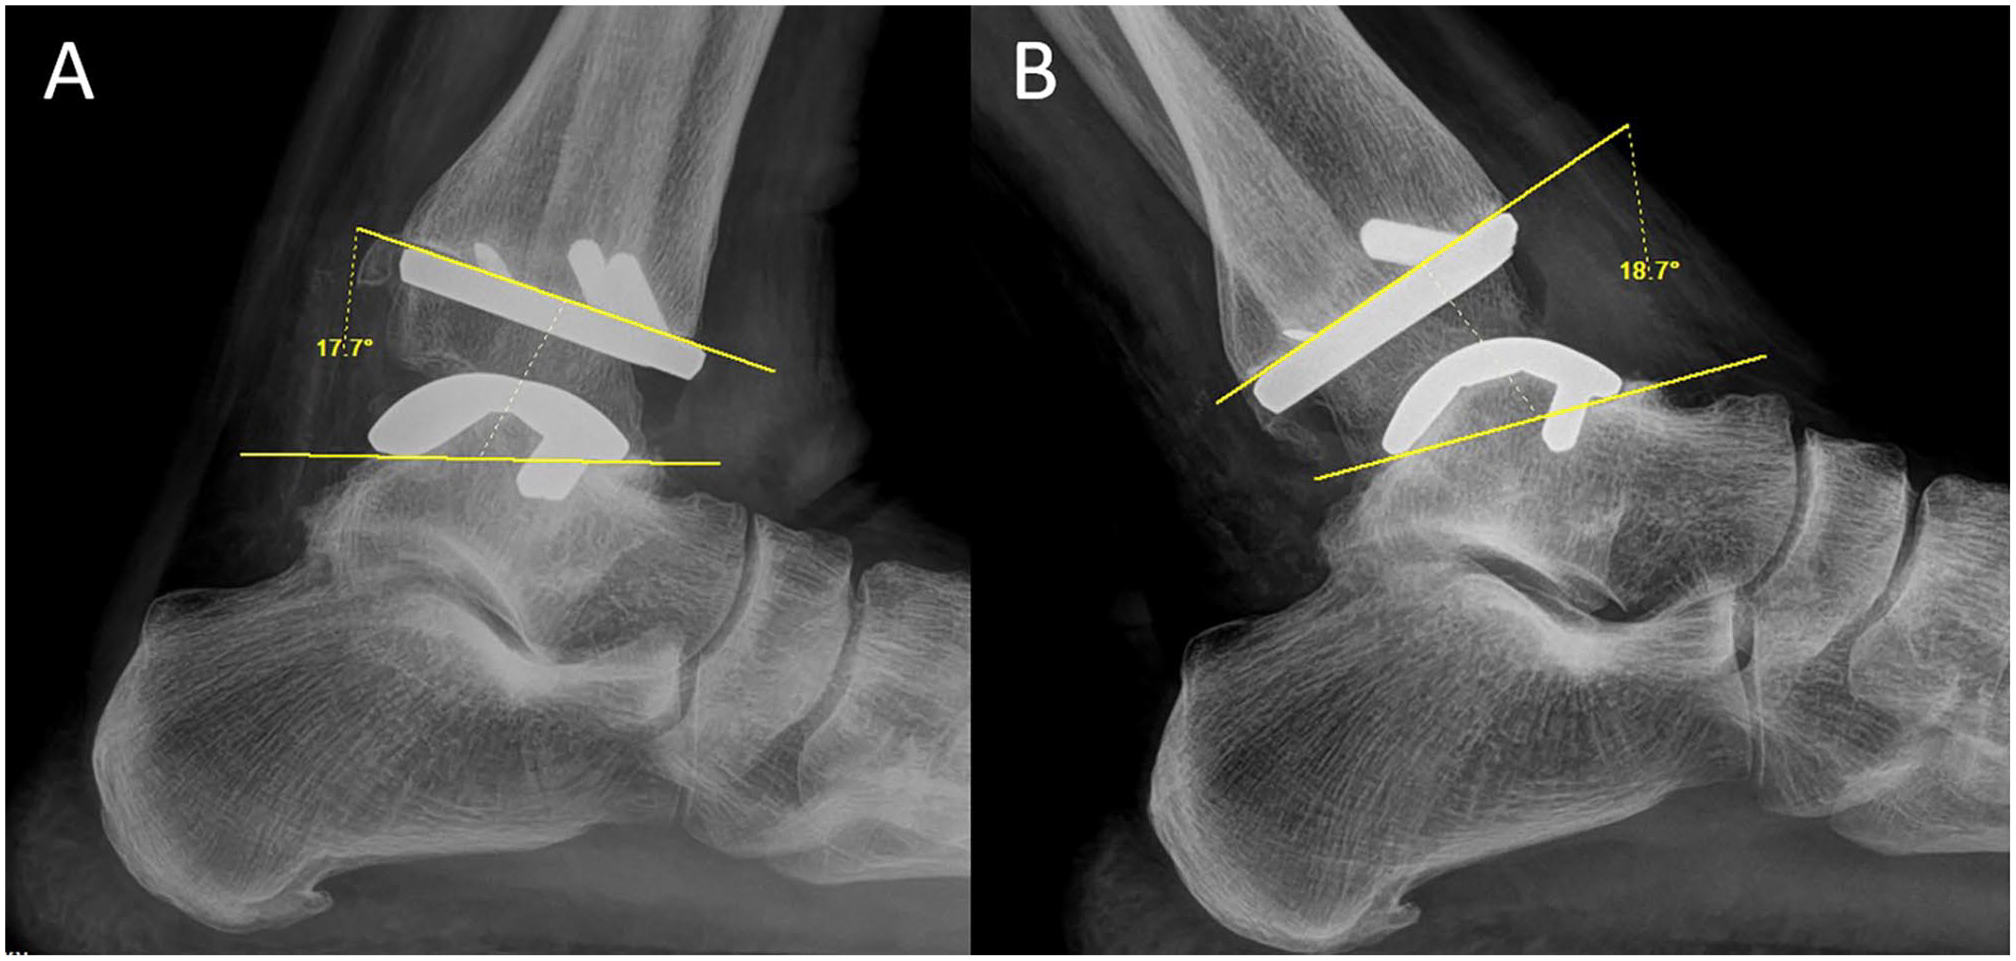
Postoperative (A) dorsiflexion and (B) plantarflexion lateral weightbearing radiographs measuring tibiotalar range of motion.
Statistics
Descriptive statistics were reported for patient, operative, and outcome data. All continuous variables were analyzed for normality using histograms, box plots, and the Kolmogorov-Smirnov test, and for homogeneity of variance using the Levene test. The ROM and TTJL measurements were confirmed to be parametric. Continuous variables were summarized with means, standard deviations, and 95% CIs. Categorical variables were summarized with frequency and percentage. The primary outcome measures were change in TTJL and postoperative tibiotalar ROM.
Independent 2-sample t tests and chi-square tests were used to determine significant differences between groups for continuous independent variables and categorical variables, respectively. Paired t tests were used to determine differences between pre- and postoperative TTJL measurements. Bivariate models were constructed to assess the association between changes in the TTJL and postoperative ROM. Multivariable models were then constructed to control for potential confounding variables including age, sex, and prosthesis type. Lastly, to further identify if an association exists between change in TTJL and postoperative ROM, Pearson correlation coefficients were determined for postoperative tibiotalar ROM by change in TTJL. A linear relationship and the absence of outliers were confirmed with both a fitted line plot and a residuals vs fits plot. This allowed us to confirm assumptions for the Pearson correlation coefficient. Intraclass correlation coefficients (ICCs) and the corresponding 95% CIs were calculated to assess interobserver reliability. Because of the high interrater reliability found across all parameters for the 2 raters, the averaged values were used for further analysis. All statistical tests were 2-sided, and a probability of .05 or less was considered significant for the analyses. All analyses were performed using SAS, version 9.2 (SAS Institute, Cary, NC).
The axis measurement was used as the reference; however, it is important to understand that the ankle joint has a continuously moving axis of rotation that varies considerably during the arc of motion and differs significantly between individuals.27,35 Seminal work by Inman described a fixed, single axis of motion with a cone-model talar apex directed medially, and whose major axis coincides with the line connecting the tips of the medial and lateral malleolus. 22 This was later partially refuted to a moving axis with a laterally oriented apex, 35 but with the axis remaining close to the midpoint of a line between the tips of the malleoli. 27 Nonetheless, the articular surface morphology, malleoli, and overall kinematics of the ankle are altered in the posttraumatic setting, challenging TTJL determination.
Results
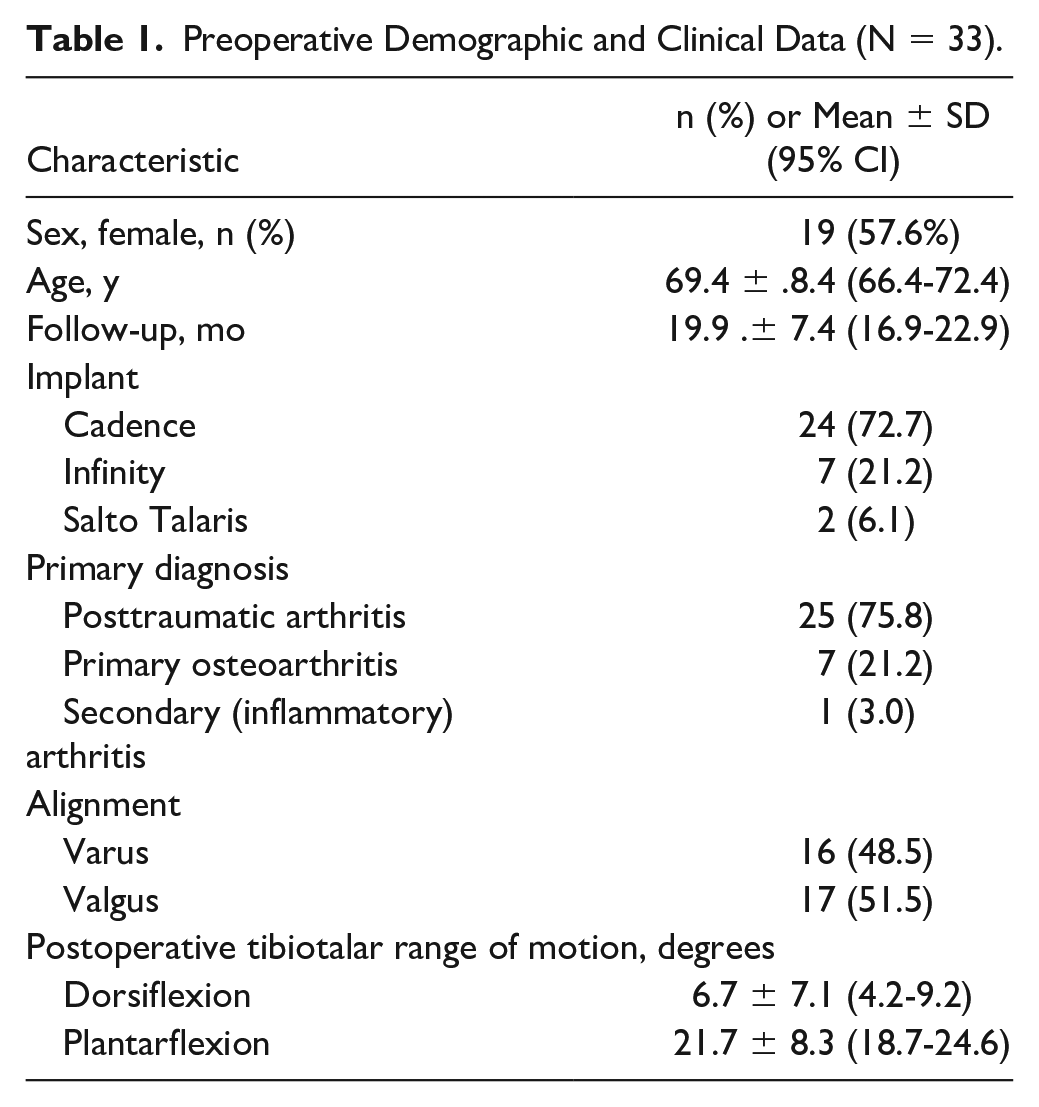
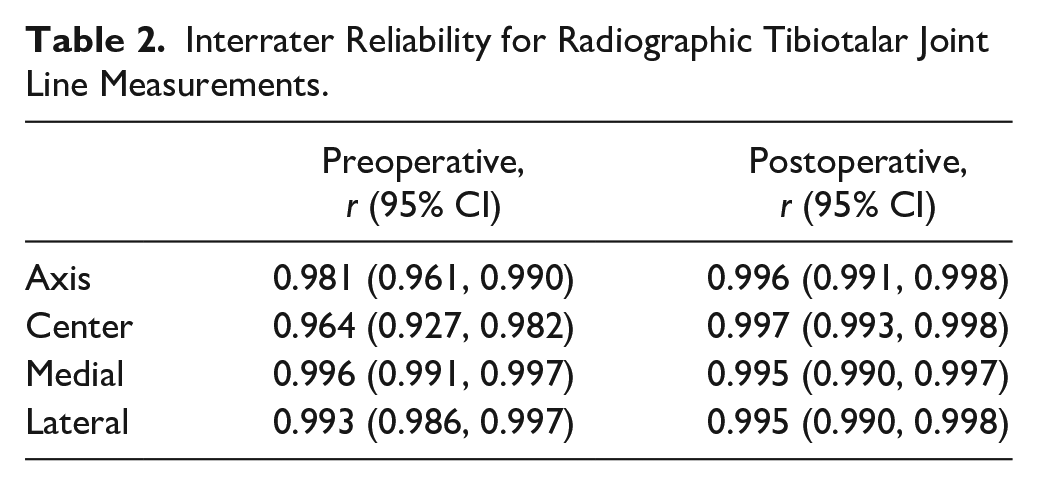
A total of 33 patients were included in this study. Initially, there were 48 patients who underwent TAA during the study time period. Two were excluded for concomitant surgery or pathology potentially altering the bony landmarks (one patient excluded for a concomitant syndesmosis arthrodesis and another for a postoperative tibial stress fracture), and 13 were excluded for concomitant lengthening procedures (tendoachilles lengthening or gastrocnemius recession). The patients’ demographic and clinical information are shown in Table 1. There were 19 (57.6%) female patients. The average age was 69.4 (±8.4) years and an average radiographic follow-up of 19.9 (±7.4) months. There were 17 (51.5%) valgus-aligned ankles and 16 (48.5%) varus ankles. The average postoperative tibiotalar ROM was 6.7 (±7.1) degrees of dorsiflexion to 21.7 (±8.3) degrees of plantarflexion. The interrater reliability was excellent, ranging from ICC r = 0.96-0.99 (Table 2).
Preoperative Demographic and Clinical Data (N = 33).
Interrater Reliability for Radiographic Tibiotalar Joint Line Measurements.
The TTJL measurements are outlined in Table 3. The pre- and postoperative TTJL measurements were as follows: center (9.1 mm, 9.4 mm; P = .4051), axis (8.6 mm, 9.5 mm; P = .0434), low (10.3 mm, 9.5 mm; P = .1112), and high (6.8 mm, 9.3 mm; P < .0001), respectively. Using the change in axis joint line measurement as a reference, a total of 22 patients had a lowered TTJL (axis joint line height increased from pre- to postoperative), compared to 11 patients with an elevated TTJL (axis joint line height decreased from pre- to postoperative) (2.2 ± 1.25 mm lowered vs 1.9 ± 1.2 mm elevated; P < .0001).
Tibiotalar Joint Line Measurements.
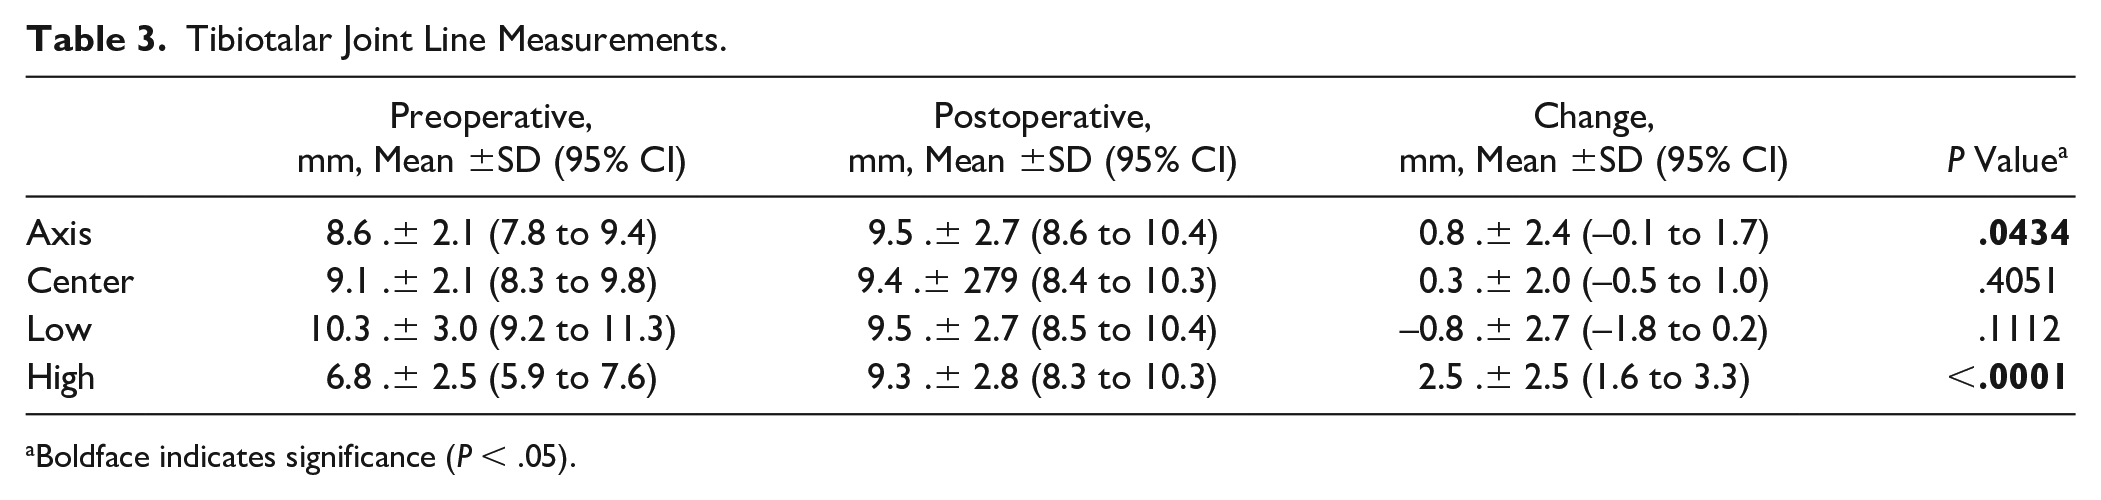
Boldface indicates significance (P < .05).
In univariable regression modeling, 3 TTJL measurements (low, P = .0472; axis, P = .0214; center, P = .0278) were significant independently weakly associated with postoperative dorsiflexion; the high joint line measurement was not significantly associated (P = .0743). Two TTJL measurements (low, P = .0121; axis, P = .0132) were significant and independently moderately associated with postoperative total ROM; the high (P = .1956) and center (P = .0583) TTJL measurements were not significant. None of the TTJL measurements were significantly associated with postoperative plantarflexion (all P > .05). When controlling for potential confounding variables including age, sex, and prosthesis type in multivariate modeling, the axis and center remained significant. The low TTJL measurement became nonsignificant for improved dorsiflexion in a bivariate model controlling for sex alone (P = .0509) but remained significant in a multivariable model when controlling for all 3 covariates (P = .0481) (Table 4).
Multivariable Regression Analysis. a
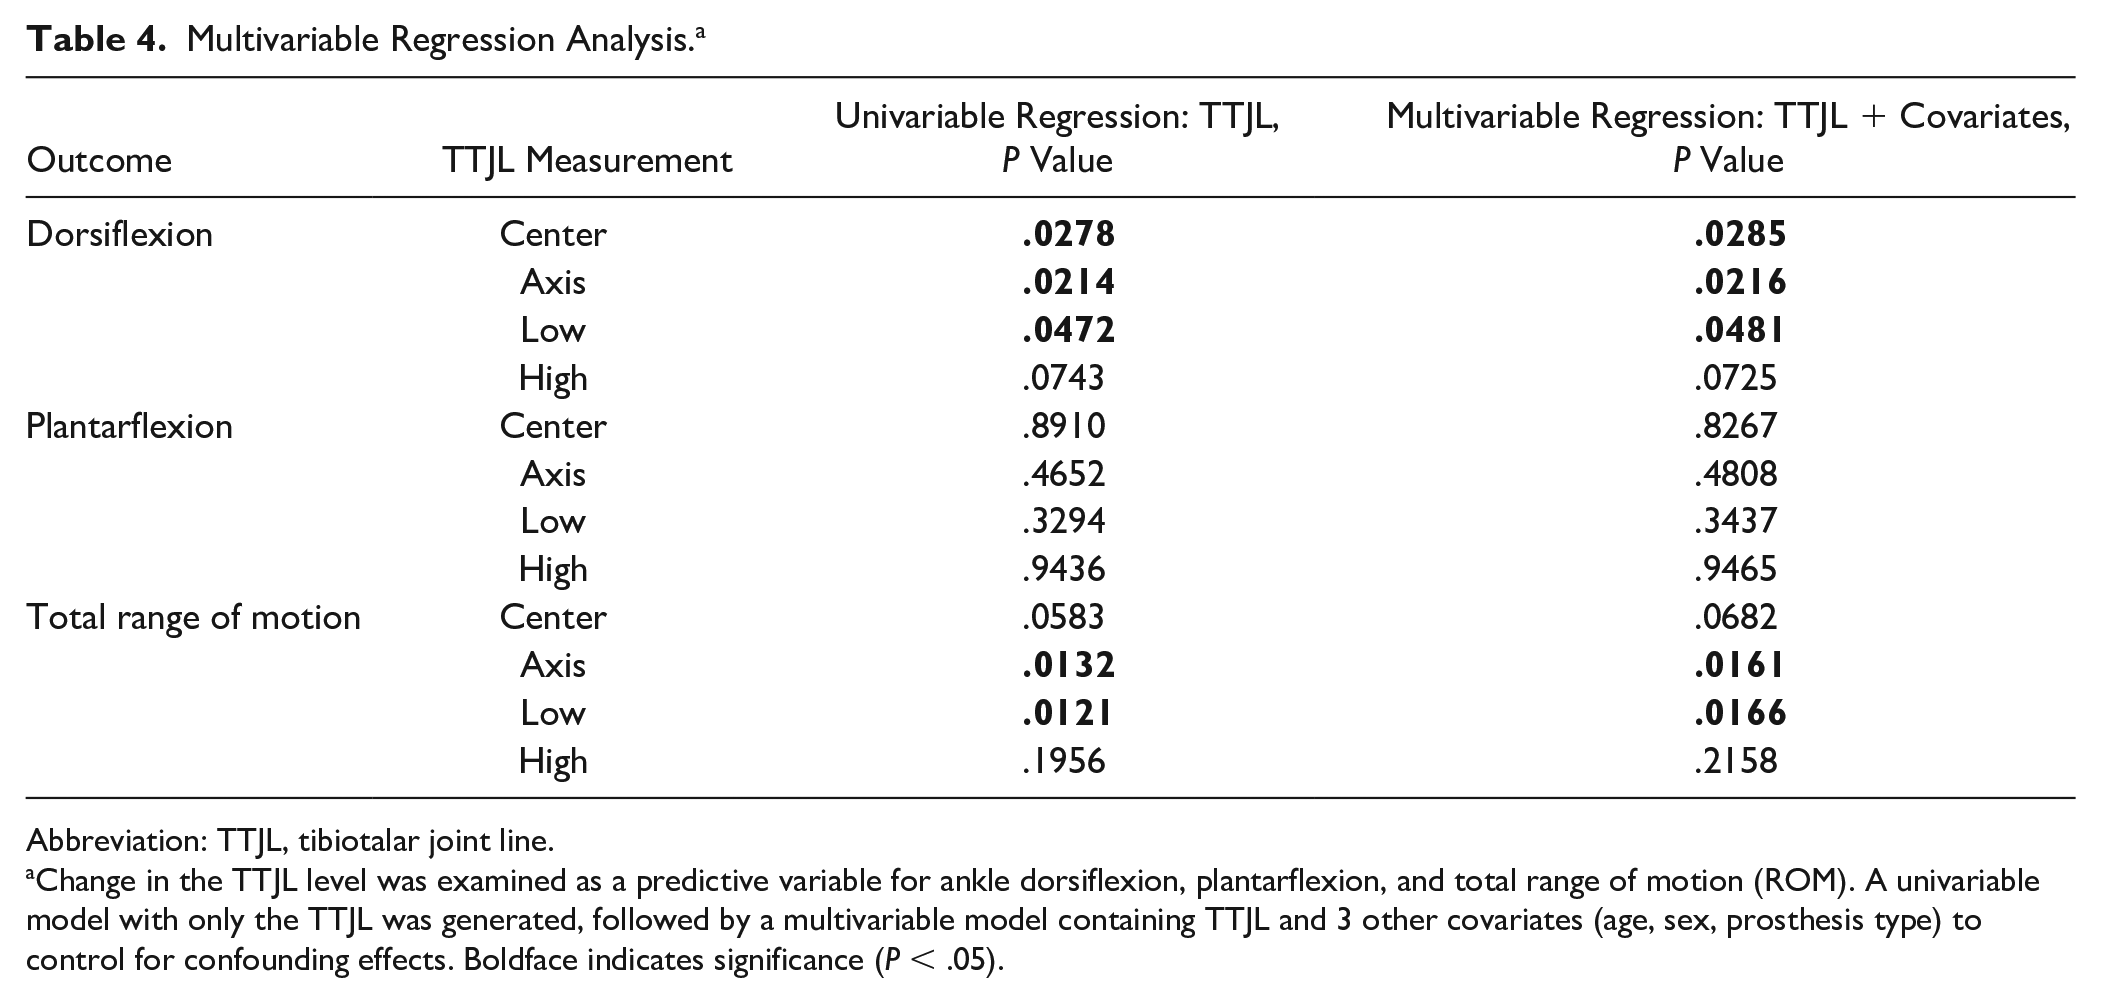
Abbreviation: TTJL, tibiotalar joint line.
Change in the TTJL level was examined as a predictive variable for ankle dorsiflexion, plantarflexion, and total range of motion (ROM). A univariable model with only the TTJL was generated, followed by a multivariable model containing TTJL and 3 other covariates (age, sex, prosthesis type) to control for confounding effects. Boldface indicates significance (P < .05).
Of the 4 TTJL measurements, 3 (low, axis, center) demonstrated a significant moderate positive correlation between lowering the TTJL and improved tibiotalar dorsiflexion and total ROM (all P < .05) (Table 5). Plantarflexion was not significantly affected by TTJL alterations. Compared to patients with an elevated TTJL, patients with a lowered TTJL had improved tibiotalar dorsiflexion (8.8 vs 2.5 degrees; P = .0015) and total ROM (31.0 vs 22.9 degrees; P = .0191), respectively.
Correlation Between Changes in Tibiotalar Joint Line Level and Postoperative Range of Motion. a
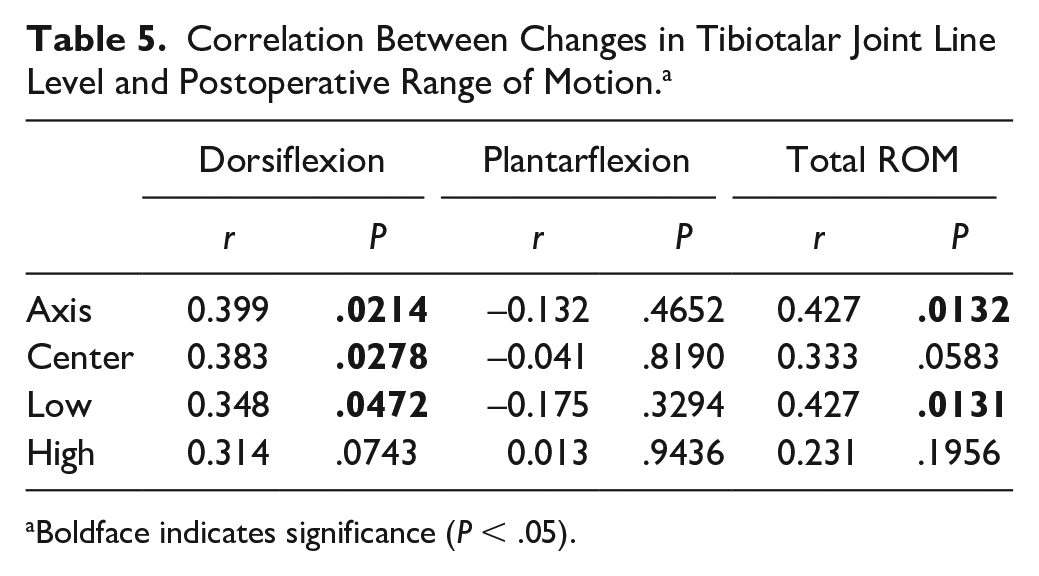
Boldface indicates significance (P < .05).
Discussion
This study presents a novel method to measure perioperative TTJL changes following ankle arthroplasty via an absolute value. To account for coronal plane deformity, this measurement technique results in 4 TTJL measurements: center, axis, high, and low. The inter-rater reliability for the measurements was excellent, ranging from ICC = 0.96-0.99. Most commonly (66.7%), the TTJL was lowered postoperatively. Three of the TTJL measurements (low, center, axis), demonstrated a weak positive correlation between lowering the TTJL and improved tibiotalar dorsiflexion and 2 (low, axis) moderately for total ROM. Plantarflexion was not significantly affected by joint line alterations. Compared to patients with an elevated joint line, patients with a lowered TTJL had an average improved tibiotalar dorsiflexion of 6.3 degrees and total ROM 8.1 degrees. These findings in this small cohort disproved our initial study hypothesis that alterations to the TTJL would not significantly impact tibiotalar ROM following TAA.
To our knowledge, there is only 1 prior study evaluating the TTJL in TAA. Harnroongroj et al 19 described a technique to measure a joint line ratio and reported excellent inter- and intrarater reliability. Their study included weightbearing AP radiographs of the operative ankle taken preoperatively, 1 year postoperatively, and of the contralateral ankle, which was studied as a nonarthritic control. Their technique involved 2 main measurements, vertical intermalleolar distance (VIMD) and vertical joint line distance (VJLD), with the joint line height ratio (JLHR) defined as the ratio of VJLD/VIMD). They reported that pre- and post-TAA JLHRs were significantly higher compared with the nonarthritic contralateral ankle. There were no significant differences between pre- and postoperative JLHRs; thus, they reported the joint line remained elevated post-TAA compared with nonarthritic ankles.
The current study used an absolute value joint line measurement rather than a joint line ratio, which similarly resulted in excellent interobserver reliability. The current study did find a significant difference in the joint line absolute value measurement between pre- and postoperative when referencing the axis (depressed 0.8 mm) and high (depressed 2.5 mm) measurements. Although the apparent overall joint line changes are small, this is consistent with knee arthroplasty literature noting knee joint line elevation as small as 2.6 and 2.3 mm resulting in a clinically significant loss in PROMs and maximum flexion angles, respectively. 25 This suggests an increased need to improve surgical precision to optimize patient outcomes following TAA.
In the context of Harnroongroj et al’s 19 findings showing an elevated TTJL in arthritic ankles, a depressed TTJL post-TAA may represent normalization of the TTJL closer to the physiologic, native ankle. This may be explained by considering the degenerative process of ankle arthritis. End-stage ankle arthritis results in advanced cartilage loss and direct contact of the subchondral bone of the tibia and talus. With the higher bone density of the talus than that of the tibia, this results in greater subchondral bone destruction and erosion of the distal tibia resulting in an elevated TTJL. This is consistent with the previous study demonstrating an elevated TTJL with arthritic compared to non-arthritic ankles. 19 This joint line elevation must be considered during ankle arthroplasty, particularly when planning the tibial bone resection and the ideal TTJL position. Lowering the TTJL as demonstrated in the current study may more closely reestablish the native, physiologic TTJL.
An interesting finding in the current study is the potential implication on TTJL alterations and postoperative tibiotalar ROM. The current study found a positive yet weak correlation between lowering the TTJL and improved tibiotalar dorsiflexion and total ROM with no effect on plantarflexion. Although these findings may initially seem counterintuitive, this finding may be related to the lowered or depressed TTJL correcting the elevated TTJL seen in end-stage arthritis, more closely approximating the native joint line position. One potential explanation for these findings may be improved tensioning and excursion of the myotendinous units and other soft tissue stabilizers about the ankle. Although no formal evidence exists, the concept of “overstuffing” the joint is loosely discussed surrounding TAA. The concern is that underresecting the tibia or talus, oversizing the polyethylene, or improper soft tissue balancing may cause overtensioning or “overstuffing” of the joint and thus limit ROM. The evidence from our relatively small cohort may refute the concern that “overstuffing” the joint decreases postoperative ROM as a positive correlation was found between lowering the TTJL and improved dorsiflexion and total ROM.
Given these findings, the current authors recommend preoperative joint line considerations to begin with preoperative bilateral weightbearing AP radiographs. The operative TTJL should be compared to the contralateral, particularly if the contralateral is nonarthritic. The amount of bony resection, soft tissue balancing, and polyethylene size are all significant determinants of the final TTJL position.
This study had a number of limitations. We reviewed a relatively small cohort of ankles with several different designs. Joint kinematics will be different for each design and to some extent even within a single design depending on implant size. An additional potential confounder may be prosthesis type with variation in tibial cut depth; however, Harnroongroj et al 19 did not find a significant difference in post-TAA JLHR with regard to the distal tibial resection level on each implant. Multiple other studies have reported no significant ROM differences between TAA prostheses types or fixed- vs mobile-bearing designs.10,24,37 We express the TTJL was measured and studied using an absolute value rather than a ratio. The goal of this absolute value is to provide more practical applications and predictions, similar to the most common method used in the knee arthroplasty literature. 14 However, the absolute value does not account for sex, BMI, and size of the ankle, which may be potential confounders when assessing an absolute value. Neither does it adjust for potential difference is magnification that can result from small differences in patient positioning during radiograph acquisition. Additionally, standardized markers were not included in the radiographs, preventing us from precisely accounting for the magnification. There may also have been variability in patient ability to perform full lateral dorsiflexion and plantarflexion radiographs.
Furthermore, both the previously studied JLHR 19 and the absolute value in the current study are possible, albeit challenging, to measure intraoperatively. This presents an excellent opportunity for the use of CT-guided PSI to correct the native joint line using the contralateral normal side as a reference. Another consideration for future research is the identification of reliable intraoperative landmarks for TTJL determination such as those extensively studied in the knee arthroplasty literature (adductor tubercle, 12 medial or lateral epicondyle 29 ). Similar to the JLHR, this absolute value method cannot be used in conditions where the constant measurement landmarks are changed, including lateral or medial malleolar fracture, osteotomy, malunion, or nonunion. An additional limitation to the current study is the lack of preoperative ROM data. Thus, ROM was studied as a single postoperative data point rather than change in ROM from preoperative to postoperative.
Conclusion
We conducted this study to investigate if TTJL alterations following TAA impacted range of motion. Lowering the TTJL level may more closely reestablish the native joint line, and weakly correlated with improved tibiotalar dorsiflexion and moderately correlated with total ROM following TAA. Future investigation should continue to study the importance of TTJL alterations in ankle arthroplasty with a focus on reliable intraoperative landmarks and further correlations with clinical and functional outcomes, biomechanics, gait, prosthesis survivability, and others. This may allow the surgeon to establish a desired postoperative joint line for optimal clinical outcomes following TAA.
Supplemental Material
sj-pdf-1-fai-10.1177_10711007231199963 – Supplemental material for The Effect of Tibiotalar Joint Line Level Alterations on Tibiotalar Range of Motion Following Total Ankle Arthroplasty
Supplemental material, sj-pdf-1-fai-10.1177_10711007231199963 for The Effect of Tibiotalar Joint Line Level Alterations on Tibiotalar Range of Motion Following Total Ankle Arthroplasty by Amanda N. Fletcher, John T. Campbell, Patrick J. Maloney, Rebecca A. Cerrato and Clifford L. Jeng in Foot & Ankle International
Footnotes
Ethical Approval
Institutional Review Board approval was obtained prior to the initiation of this research study.
Declaration of Conflicting Interests
The author(s) declared no potential conflicts of interest with respect to the research, authorship, and/or publication of this article. ICMJE forms for all authors are available online.
Funding
The author(s) received no financial support for the research, authorship, and/or publication of this article.
References
Supplementary Material
Please find the following supplemental material available below.
For Open Access articles published under a Creative Commons License, all supplemental material carries the same license as the article it is associated with.
For non-Open Access articles published, all supplemental material carries a non-exclusive license, and permission requests for re-use of supplemental material or any part of supplemental material shall be sent directly to the copyright owner as specified in the copyright notice associated with the article.