
Abstract
Background:
Ankle arthritis leads to an elevated joint line compared to the nonarthritic ankle, as measured by the “joint line height ratio” (JLHR). Previous work has shown that the JLHR may remain elevated after total ankle arthroplasty (TAA). However, the clinical impact of this has yet to be determined. This study assessed the correlation between postoperative JLHR, post-TAA range of motion (ROM), and 1-year Patient-Reported Outcome Measurement Information System (PROMIS) scores.
Methods:
A retrospective review of 150 patients who underwent primary TAA was performed. Preoperative and postoperative JLHR, as well as postoperative dorsiflexion, plantarflexion, and total ROM, was calculated on weightbearing radiographs at a minimum of 1-year follow-up. Correlation between JLHR, post-TAA ROM, and 1-year PROMIS scores was investigated using Pearson correlation and multiple linear regression models. Interobserver reliability for the JLHR was also calculated.
Results:
Interobserver reliability for the JLHR was excellent (r = 0.98). Mean (SD) JLHR changed from 1.66 (0.45) to 1.55 (0.26) after TAA (P < .001), indicating that the joint line was lowered after TAA. An elevated joint line was correlated with decreased post-TAA dorsiflexion (r = −0.26, P < .001), total ROM (r = −0.18, P = .025), and worse 1-year PROMIS physical function (r = −0.22, P = .046), pain intensity (r = 0.22, P = .042), and pain interference (r = 0.29, P = .007). There was no correlation between the JLHR and post-TAA plantarflexion (r = −0.025, P = .76). Regression analysis identified a 0.5-degree reduction in post-TAA dorsiflexion with each 0.1-unit increase in JLHR (Coeff. = −5.13, P = .005).
Conclusion:
In this patient cohort, we found that an elevated joint line modestly correlated with decreased postoperative dorsiflexion, total ROM, and worse 1-year PROMIS scores. These data suggest that effort likely should be made toward restoring the native joint line at the time of TAA. In addition, future studies investigating the clinical outcomes after TAA may consider including a measure of joint line height, such as the JLHR, because we found it was associated with patient-reported outcomes.
Level of Evidence:
Level III, retrospective review of prospectively collected data.
Keywords
Introduction
Total ankle arthroplasty (TAA) is a well-recognized treatment for patients with end-stage ankle arthritis, resulting in significant improvements in function and pain, restoration of gait, and mobility preservation.8,14,15,16,17,36 Numerous studies have demonstrated that TAA can effectively preserve ankle range of motion (ROM) and improve gait parameters.2,6,17,22 Ankle arthritis is associated with erosion of the distal tibial plafond and talus and can often result in an elevated joint line over time.4,25,26,35 During surgery, the joint line of the arthritic ankle is typically used as a reference point when performing bone cuts. Consequently, although the ankle joint line may appear unchanged after TAA, it might still be elevated compared to the native joint. 18 Although TAA has been effective in treating end-stage ankle arthritis, there is still a lack of evidence on whether TAA can restore the joint line to its native position and if an elevated joint line affects the overall TAA outcomes.
Restoration of the joint line has been proposed as an essential principle in total knee arthroplasty (TKA) that correlates with better clinical outcomes and ROM.5,9,12,21,23,31,32 Elevation of the joint line in TKA can result in restricted ROM, increased patellofemoral issues, and worse overall clinical results. 31 Similarly, restoring the native joint line of the ankle joint may also help improve ROM and clinical outcomes in patients undergoing TAA. However, most previous studies investigating ROM after TAA have looked at the effect of preoperative ROM or concomitant procedures while not specifically assessing changes to the joint level.6,7,13,22,30
Recently, a radiographic measurement method of the joint line level in TAA was described. 18 The “joint line height ratio” (JLHR) identifies ankle-specific landmarks that remain constant following TAA. Patients with end-stage ankle arthritis showed an elevated joint line compared to the nonarthritic contralateral side. In addition, in that study, TAA successfully maintained the preoperative joint line level but did not restore the native joint line. The clinical implications of these findings on postoperative ROM and patient-reported outcomes remain unclear.
Therefore, our goal was to investigate the effect of the level of the ankle joint, as measured by the JLHR, on postoperative ankle ROM and 1-year Patient-Reported Outcome Measurement Information System (PROMIS) scores in the physical function, pain intensity, and pain interference domains. We hypothesized that a higher postoperative joint line would be correlated with worse post-TAA dorsiflexion and worse postoperative 1-year PROMIS scores.
Methods
Patient Selection
We used an Institutional Review Board–approved prospective registry in our institution’s Orthopaedic Foot and Ankle Department that collects pre- and postoperative clinical and radiographic outcomes. We reviewed data from all patients who underwent primary TAA between October 2017 and February 2022. Results were reported in accordance with the STROBE (strengthening the reporting of observational studies in epidemiology) statement and checklist for retrospective studies. 34
There were 762 primary TAAs between October 2017 and February 2022. All TAAs were performed by 4 fellowship-trained foot and ankle fellows. Patients who underwent primary TAA with a minimum radiographic follow-up of 1 year were included. To maximize sample size and power, a minimum of 1-year radiographic follow-up was selected because it has been previously demonstrated that there is no significant improvement in ROM following 6 months after TAA. 2 The exclusion criteria included (1) concomitant fibular or medial malleolar osteotomy, which would distort bony landmarks used to obtain the JLHR; (2) patients with radiographic component loosening at the time of follow-up, which could alter the joint line position; (3) and ankle arthrodesis takedowns. Component loosening was diagnosed with radiographs and CT scans. Significant osteolysis about an implant with progression between sequential radiographs, progressive cyst formation, or component subsidence was considered implant loosening.
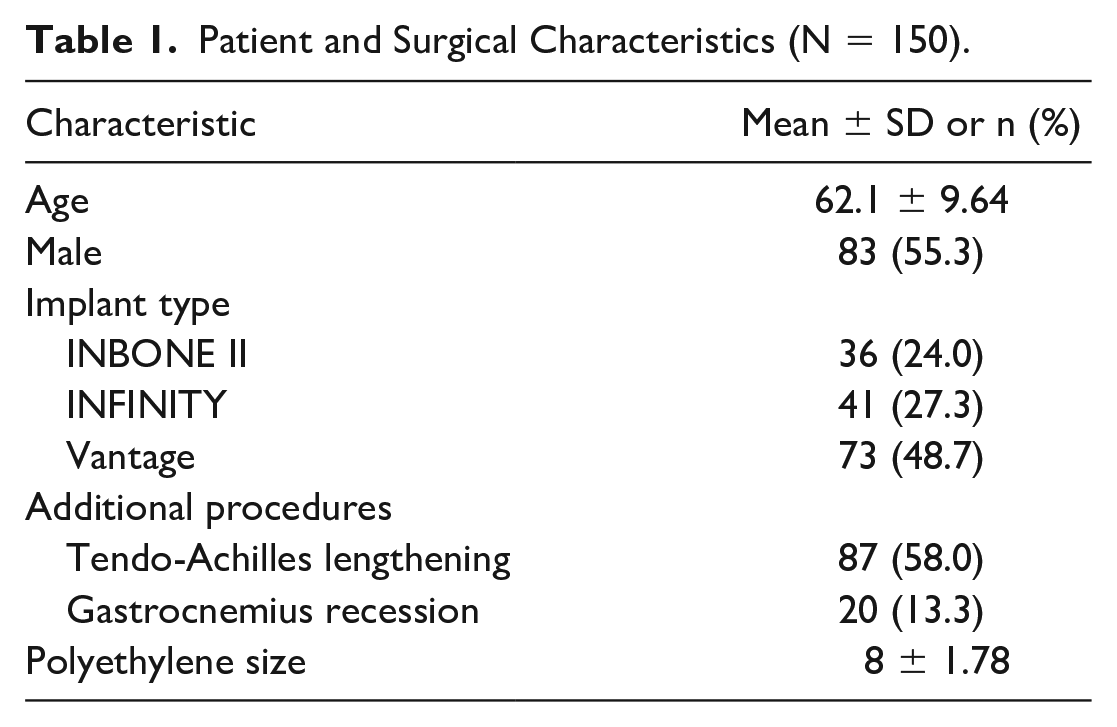
In total, 264 patients had a minimum 1-year radiographic follow-up with standard anteroposterior (AP), lateral, and ROM weightbearing ankle radiographs (tibiotalar dorsiflexion and plantarflexion). Fourteen patients were excluded (7 concomitant fibular osteotomies, 3 concomitant medial malleolar osteotomies, 3 component loosening, and 1 arthrodesis takedown). Within the 250 patients who met the inclusion criteria, 150 patients were randomly selected for the radiographic measurements based on power analysis for a multivariable prediction model for a continuous outcome with 6 parameters and an approximate r-squared of 0.2. 29 The cohort consisted of 67 females and 83 males, with an average age of 62 years (range 28-67). The mean (SD) final follow-up was 21.20 months (8.92, 95% CI 19.60, 22.79) (Table 1).
Patient and Surgical Characteristics (N = 150).
Clinical and Outcomes Data Collection
Medical records were reviewed to collect basic demographics (age, sex, laterality) and surgical protocol (implant type, polyethylene thickness [mm], concomitant procedures including tendo-Achilles lengthening [TAL], and gastrocnemius recession [GR]). Primary TAA was performed using one of 3 TAA systems (Vantage [Exactech, Gainesville, FL], Infinity [Stryker, Kalamazoo, MI], and INBONE II [Stryker]). All implants were fixed bearing. There were 36, 41, and 73 patients who received Inbone II, Infinity, and Vantage TAA, respectively. TAL and GR were performed to either facilitate deformity correction or improve the range of motion. Both procedures have been shown to increase ankle dorsiflexion following TAA. 28 Patients with severely restricted ankle dorsiflexion, where the ankle was unable to reach neutral with the trial components, underwent a TAL prior to implanting the final components. In addition, if a minimum of 5-10 degrees of ankle dorsiflexion was not achieved after the TAA procedure, patients would undergo a TAL or gastrocnemius recession. A Sliverskiold test was used to determine which procedure should be done to improve dorsiflexion of the total ankle. Eighty-seven patients (58.0%) underwent TAL, and 20 (13.3%) underwent GR during the primary TAA (Table 1). Patient-Reported Outcomes Measurement Information System (PROMIS) scores were collected using a computer adaptive testing system 1 year postoperatively. Patient outcomes were assessed in 3 domains: Physical Function (PF), Pain Intensity (PI), and Pain Interference (PIF). Each PROMIS domain score is expressed as a t-score ranging from 0 to 100. The average score for the US population is represented by 50, and higher scores indicate more of the measure. 11 Reported minimal clinically important differences in patients with end-stage ankle arthritis for the PROMIS PF, PI, and PIF domains are 3.8, 4.8, and 5.0, respectively. 11
Radiographic Assessment
All 150 patients had available pre- and postoperative weightbearing AP and lateral radiographs and postoperative lateral ROM ankle radiographs. Of these, 97 patients also had preoperative lateral ROM radiographs. All radiographic measurements were performed twice by 1 fellowship-trained foot and ankle orthopaedic surgeon and 1 trained research assistant using the Picture Archiving and Communication System (PACS).
The JLHR was captured via radiographic measurements from pre- and postoperative weightbearing AP ankle radiographs using a previously described methodology. 18 In the previous study describing the JLHR, mean nonarthritic contralateral ankle, pre-TAA, and post-TAA JLHR values averaged 1.39, 1.54, and 1.62, respectively. In the same study, pre- and post-TAA JLHRs were significantly higher than the nonarthritic contralateral ankle (P < .05), but there was no significant difference between pre- and post-TAA JLHRs (P = .15). 18 Increased JLHR values correlate with a higher joint line level. The benefit of this measurement technique is that it can be performed without calibration markers because it is expressed as a ratio instead of an absolute value. The JLHR is calculated as the ratio between the vertical joint line distance (VJLD) and the vertical intermalleolar distance (VIMD) measured on the weightbearing AP radiographs, further detailed in Figure 1. 18
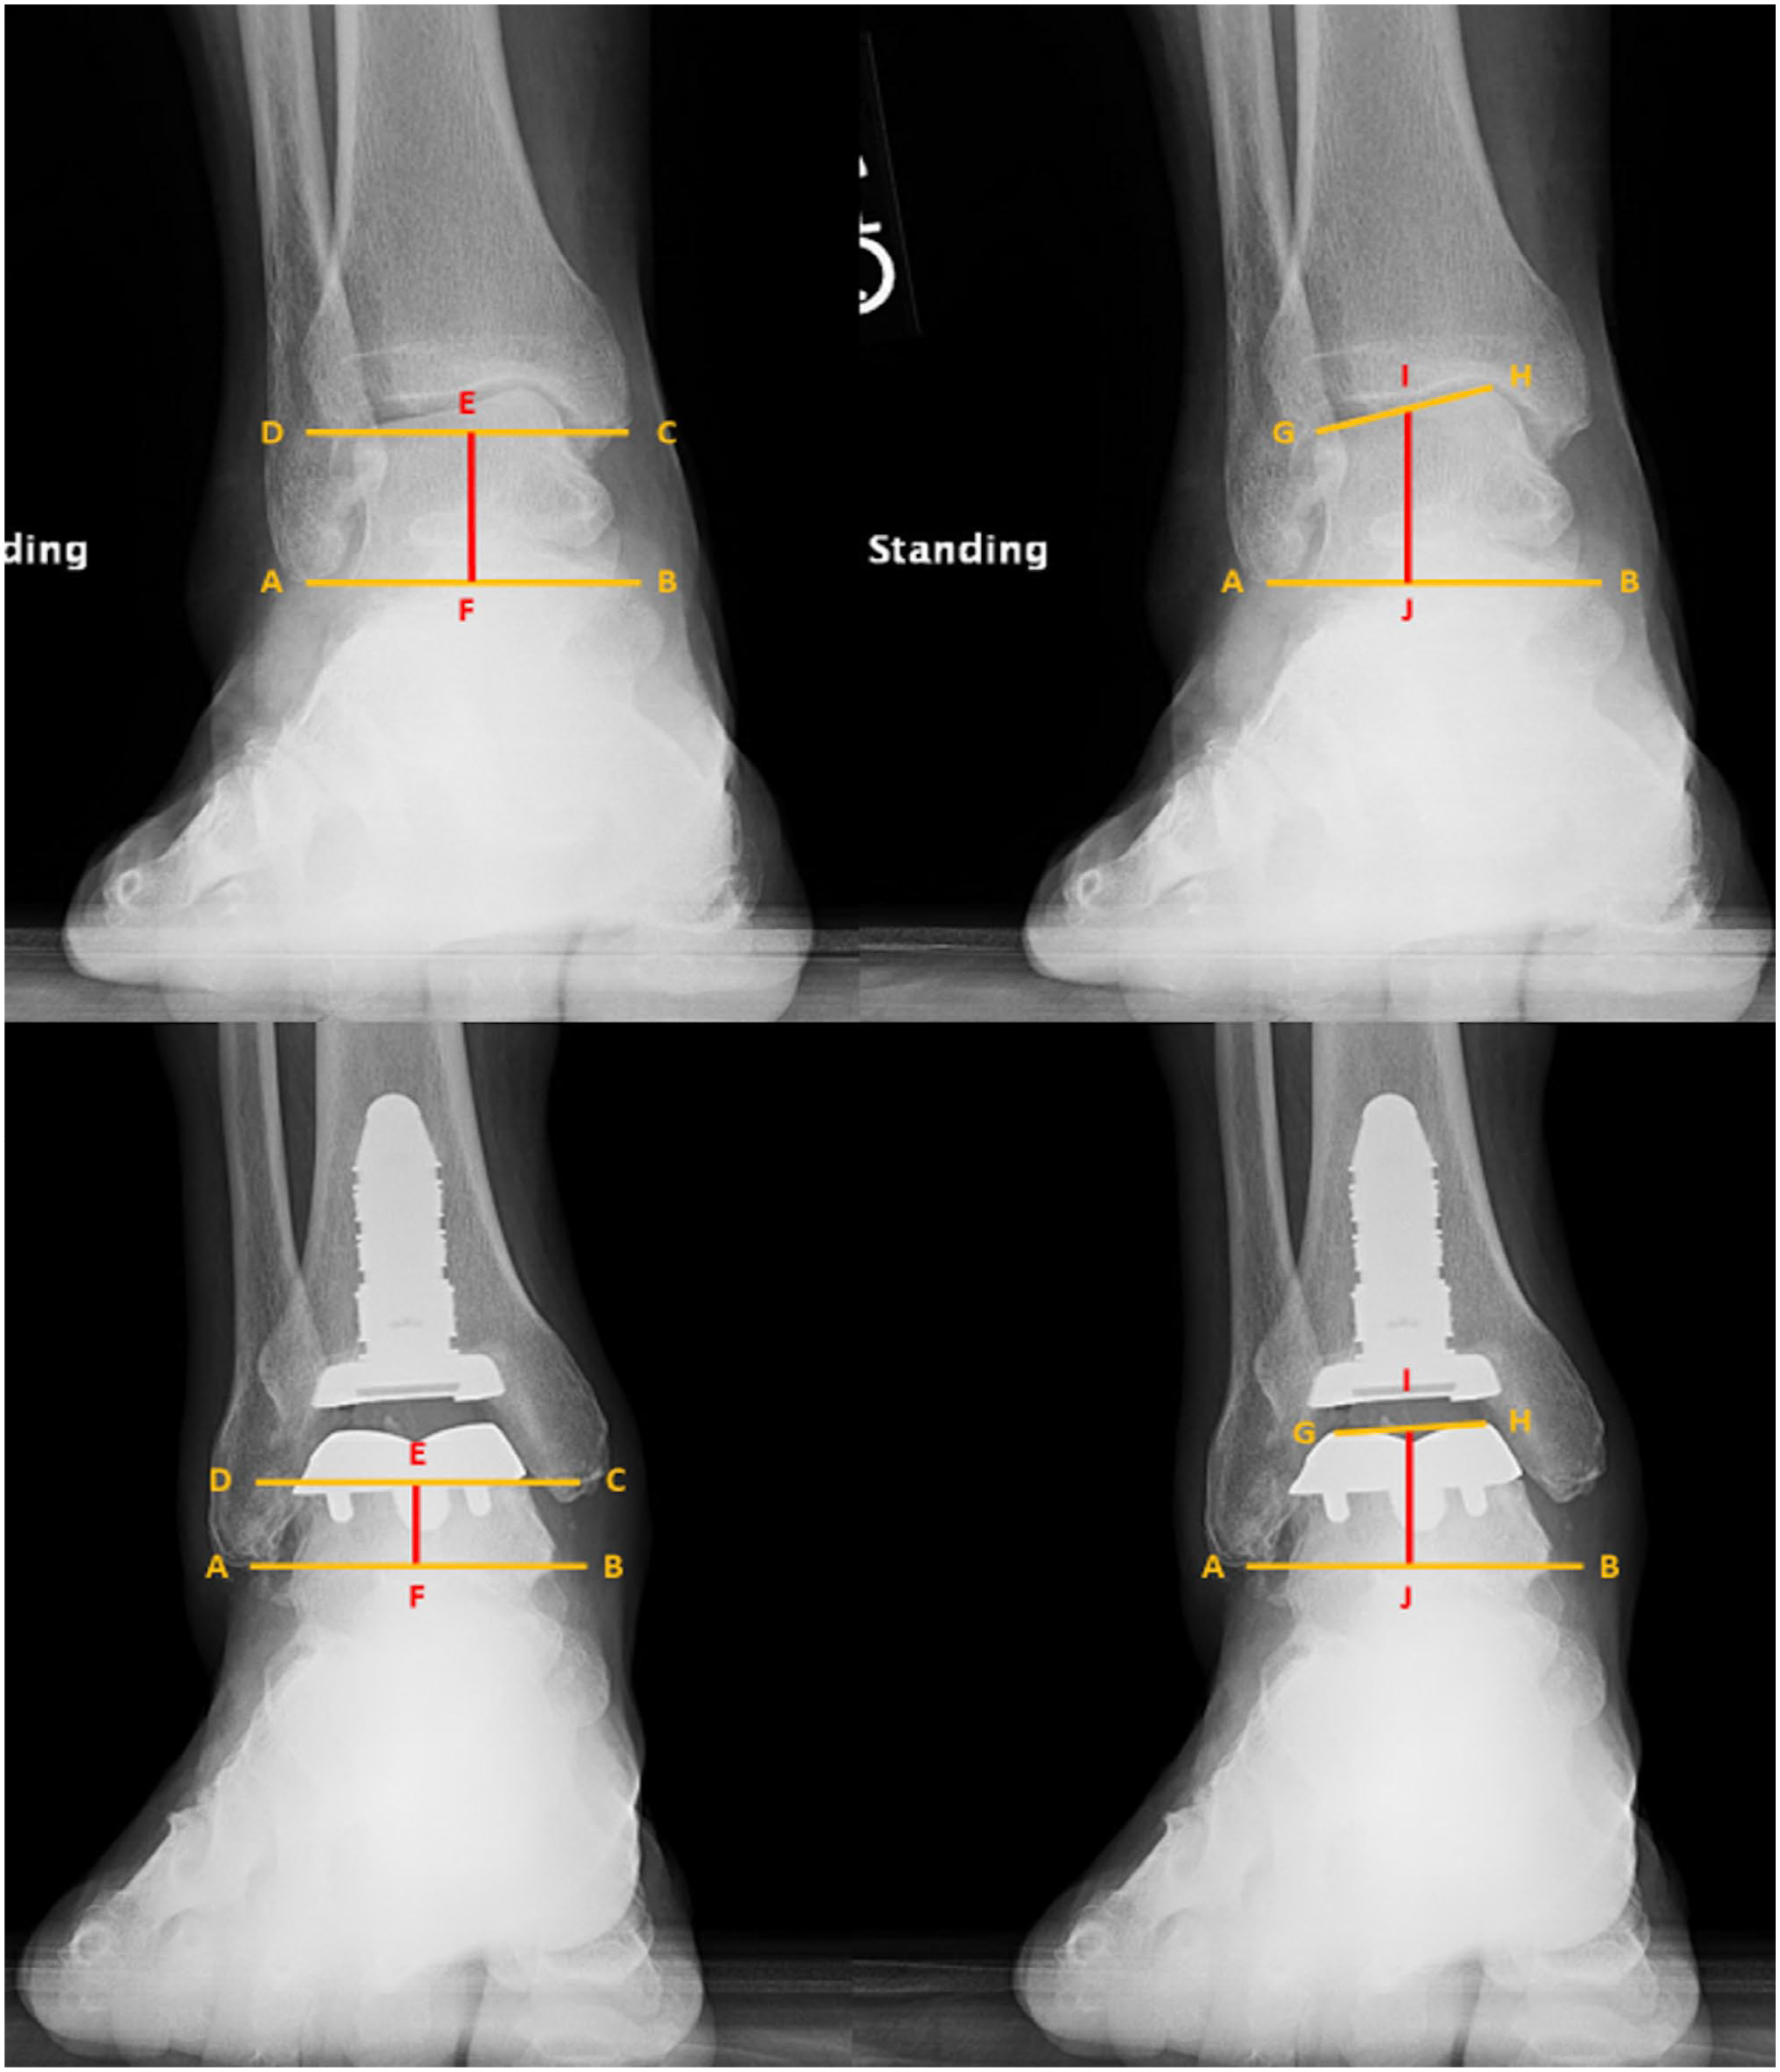
Measurement of joint line height ratio (JLHR) on preoperative radiographs by calculating the ratio between the vertical joint line distance (VJLD) and the vertical intermalleolar distance (VIMD). VJLD is measured by first drawing a line originating from the tip of the fibula parallel to the ground (AB). Then, a line GH is drawn between the medialmost (H) and lateralmost (G) points of the talar dome (for preoperative radiographs) or the uppermost medial and lateral points of the talar component (for postoperative radiographs). The midpoint I of line GH is identified, and a line IJ originating from point I is drawn perpendicularly to connect to AB. VJLD is measured as the length of line IJ in millimeters. VIMD is measured by first drawing a line originating from the tip of the lateral malleolus parallel to the ground (AB). Then, a line CD is drawn parallel to the ground originating from the tip of the posterior colliculus of the medial malleolus (C). Finally, a line EF connecting between and perpendicular to lines AB and CD is drawn. VIMD is measured as the length of line EF in millimeters.
Pre- and postoperative tibiotalar ROM (dorsiflexion, plantarflexion, and total ROM) was captured via measurements from weightbearing lateral ankle radiographs in neutral, maximum dorsiflexion, and maximum plantarflexion positions using previously described methods (Figure 2). 10 Tibial component sagittal alignment was obtained by measuring the angle between the long axis of the tibia and the inferior aspect of the tibial component in the weightbearing lateral ankle radiograph.
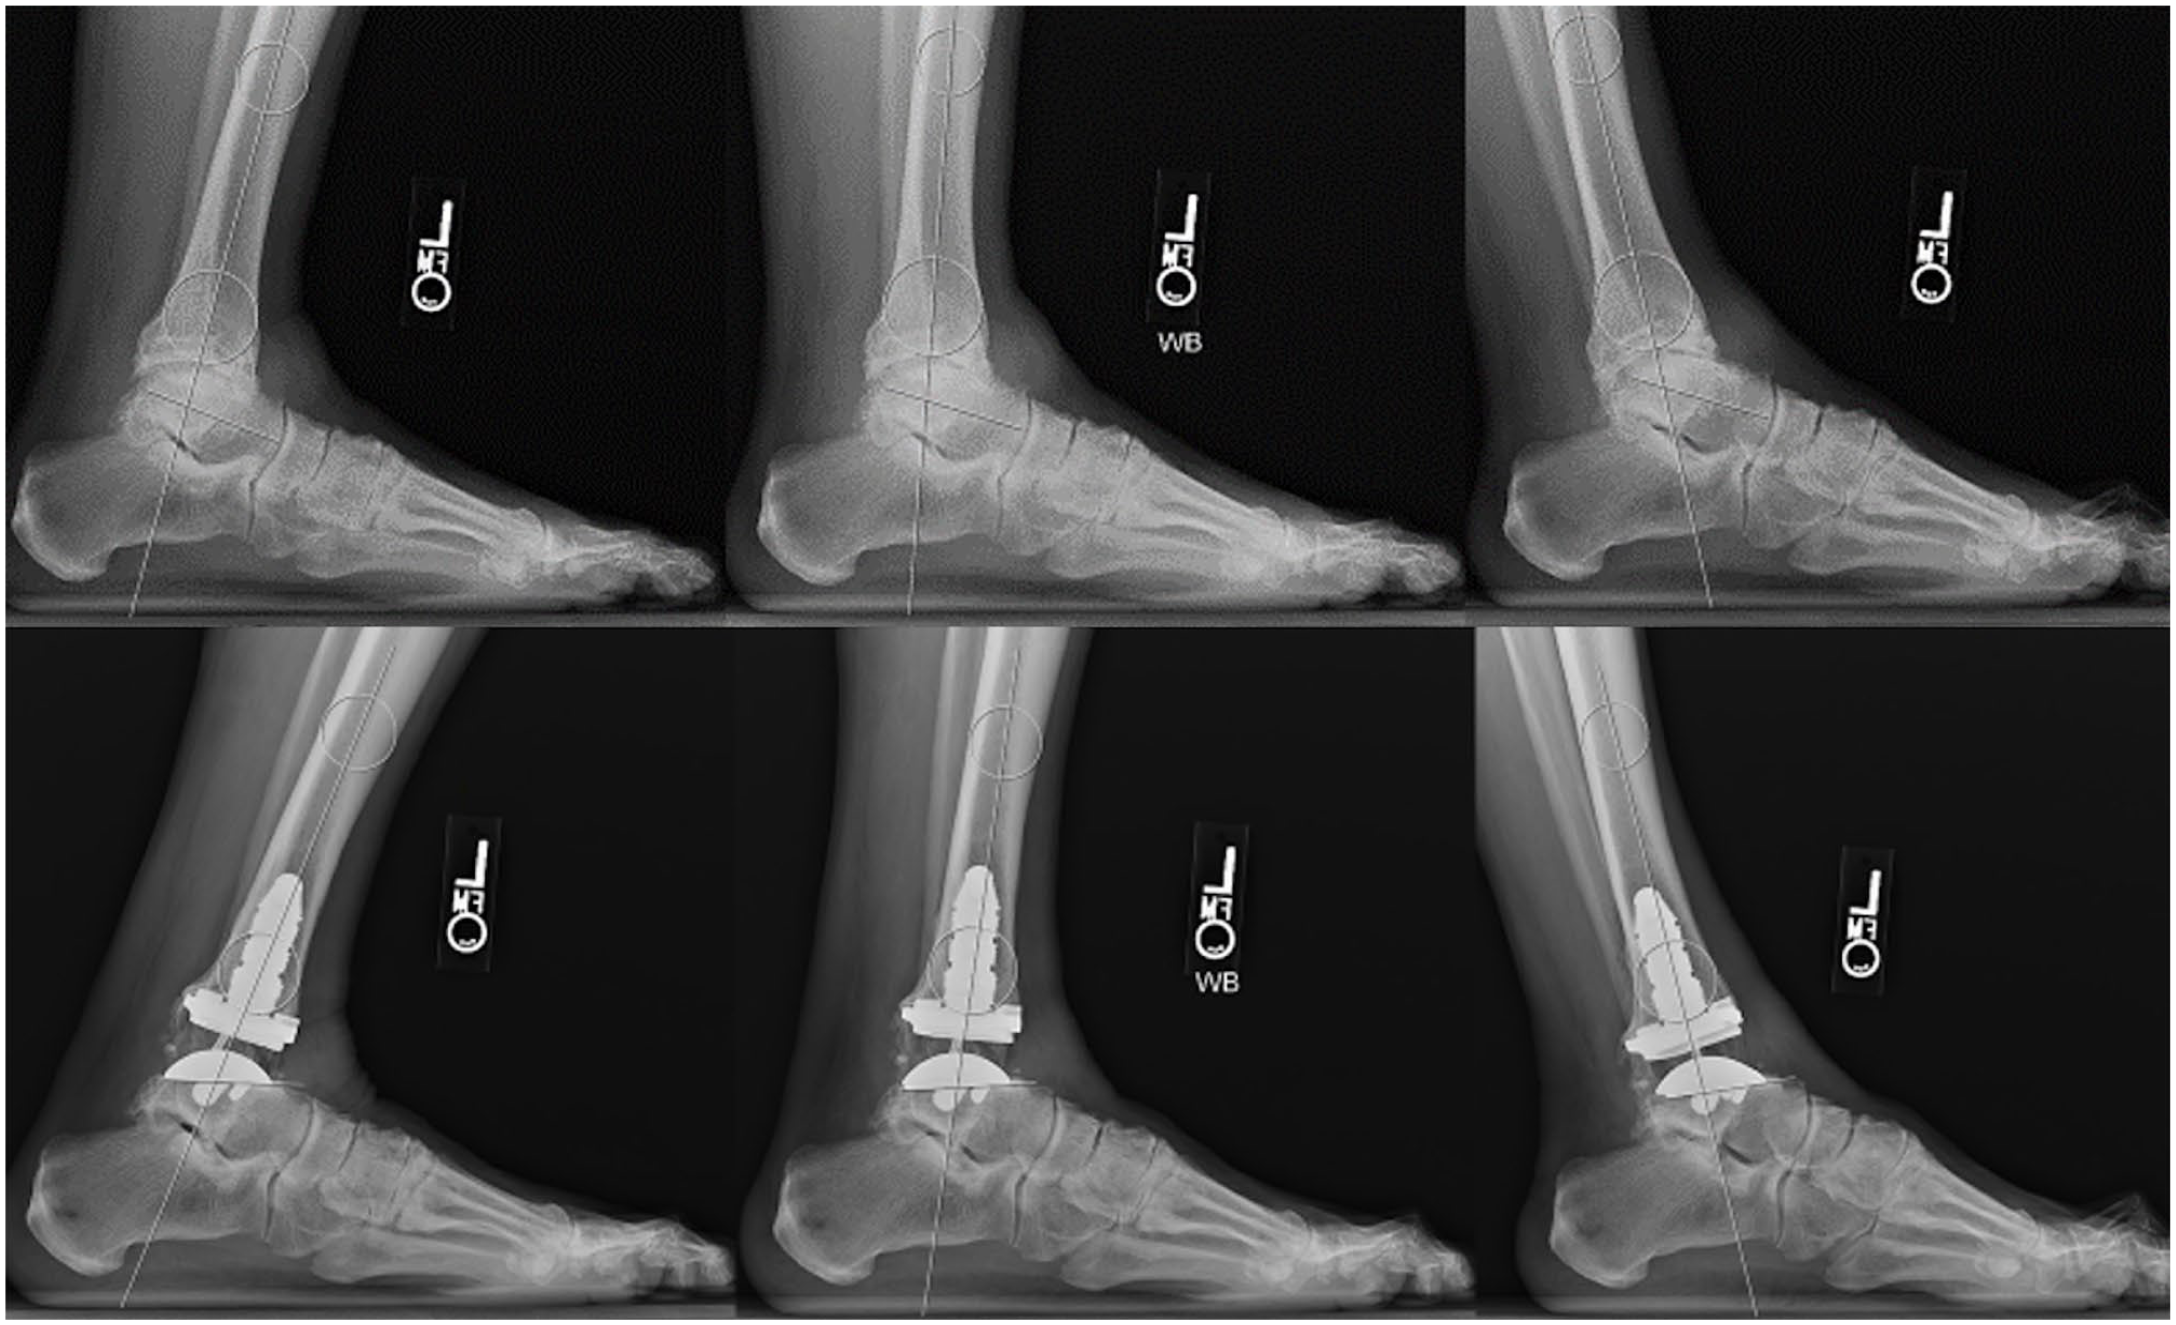
Measurement of plantarflexion, dorsiflexion, and total tibiotalar range of motion on preoperative and postoperative radiographs (degrees).
Statistical Analysis
Descriptive statistics were reported with mean, median, and SD for continuous variables and frequency and percentage for categorical variables. Variables were analyzed for normality using the Shapiro Wilk test. For JLHR measurements, the agreement between 2 graders was assessed using the intraclass correlation coefficient using the 2-way random effects model. Because the interobserver reliability of the JLHR was excellent (r = 0.98, 95% CI 0.96-0.98), the average of the 2 raters was used for further analysis.
A paired Wilcoxon signed-rank test was used to compare the pre- and post-TAA JLHR, tibiotalar ROM, and 1-year PROMIS scores, using complete casewise data. Adjusted P values using the Benjamini Hochberg procedure were presented for the paired Wilcoxon signed rank test to minimize alpha inflation. The correlation between post-TAA JLHR and post-TAA tibiotalar dorsiflexion, plantarflexion, total ROM, and 1-year postoperative PROMIS scores (PF, PI, and PIF) was assessed using the Pearson correlation coefficient (rho). The same method was used to perform a correlation analysis between pre- with post-TAA ROM and post-TAA dorsiflexion with 1-year PROMIS scores (PF, PI, and PIF). Finally, 3 multiple linear regression models were used to investigate the association of postoperative JLHR with post-TAA tibiotalar dorsiflexion, plantarflexion, and total ROM as outcomes, respectively, after adjusting for pre-TAA ROM, tibial component sagittal alignment, use of GR and/or TAL, and polyethylene thickness (mm). Predictive mean matching was used to address missing values in the regression models, using the rule of thumb of 1 imputed data set for every 1% missing data.3,19 Statistical significance was established as alpha less than 0.05. Analysis was conducted on R: A Language and Environment for Statistical Computing (R Core Team 2022, Vienna, Austria) with rms and irr packages. 20
Results
Joint Line Height Ratio and Range of Motion
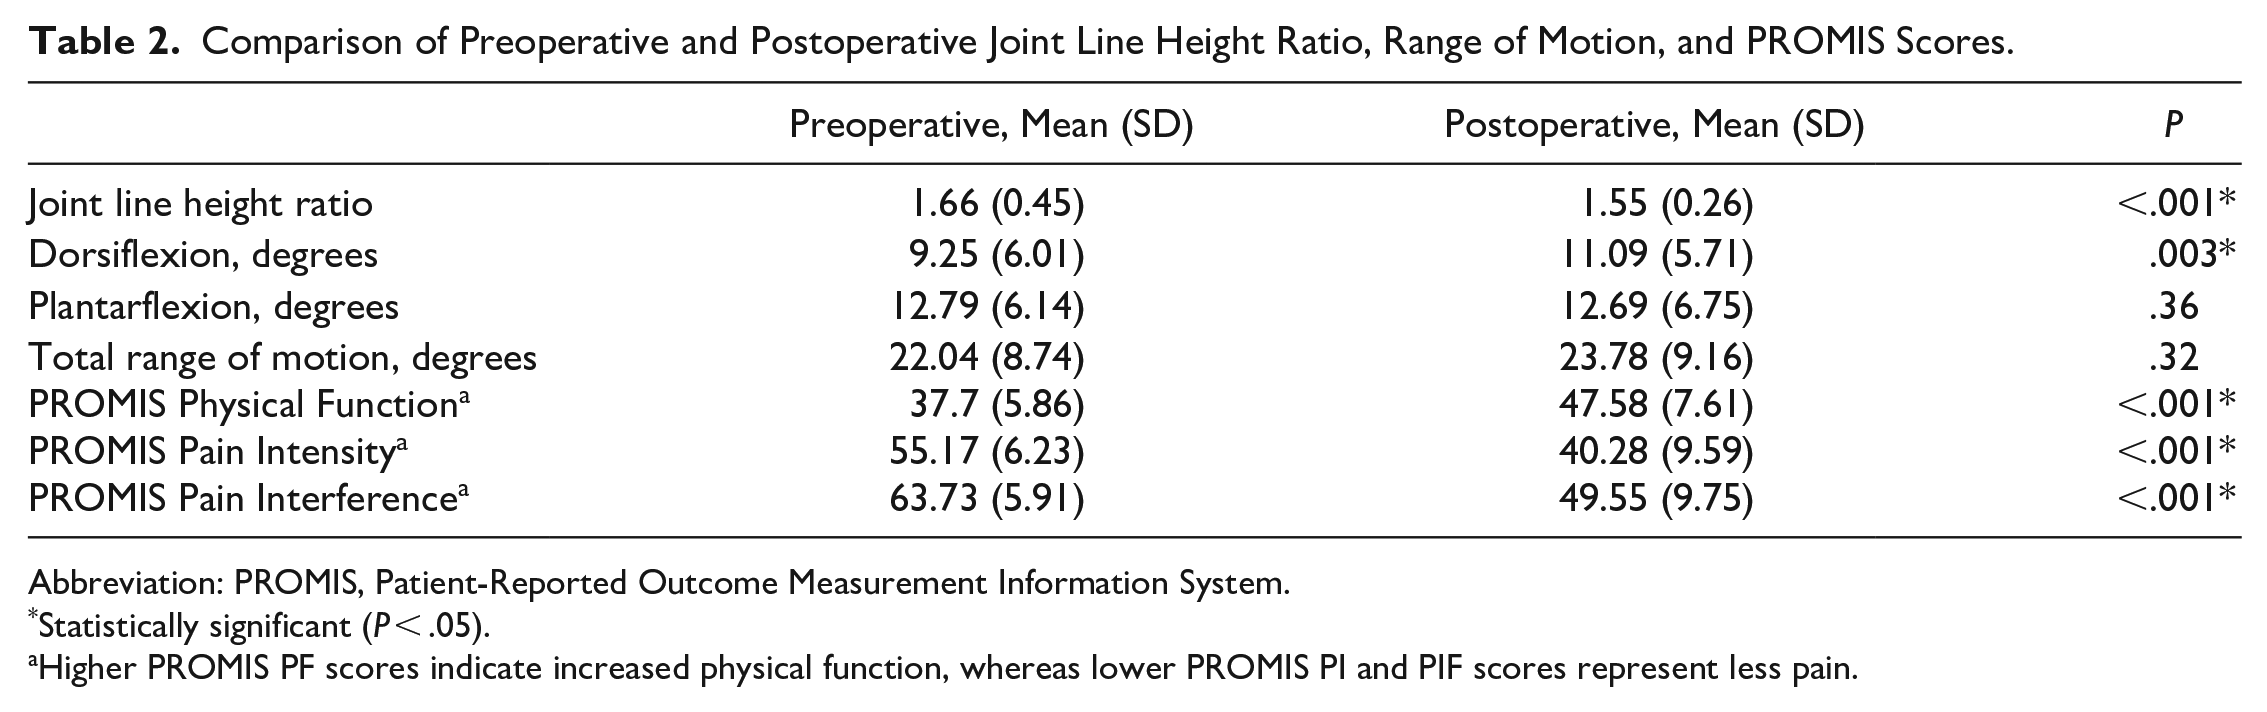
Mean (SD) JLHR was 1.66 (0.45) pre-TAA compared to 1.55 (0.26) post-TAA, with a mean difference of 0.12 (95% CI 0.06, 0.17, P < .001), indicating the joint line was significantly lowered postoperatively. Mean (SD) postoperative JLHR was 1.55 (0.29), 1.49 (0.22), and 1.58 (0.27) for the Inbone II, Infinity, and Vantage TAA systems, respectively (P = .36). Lowering of the joint line was observed in 84 of 150 patients (56%) after TAA. In addition, there was a statistically significant modest improvement in dorsiflexion after TAA with a mean increase of 1.6 degrees (95% CI 0.30, 3.01, P = .003). No difference was observed between pre- and post-TAA plantarflexion and total ROM (Table 2).
Comparison of Preoperative and Postoperative Joint Line Height Ratio, Range of Motion, and PROMIS Scores.
Abbreviation: PROMIS, Patient-Reported Outcome Measurement Information System.
Statistically significant (P < .05).
Higher PROMIS PF scores indicate increased physical function, whereas lower PROMIS PI and PIF scores represent less pain.
Joint Line Height Ratio and Range of Motion Correlation
Postoperative JLHR had an inverse correlation with post-TAA dorsiflexion (r = −0.264, 95% CI −0.40, −0.11, P = .001), and total ROM (r = −0.18, 95% CI −0.33, −0.02, P = .025), respectively, indicating that a higher joint line correlated with decreased post-TAA dorsiflexion and total ROM. There was no correlation between post-TAA JLHR and post-TAA plantarflexion (r = −0.03, 95% CI −0.19, 0.14, P = .76). In addition, there was a correlation between pre- and postoperative tibiotalar dorsiflexion (r = 0.33, 95% CI 0.14, 0.5, P = .001) and plantarflexion (r = 0.34, 95% CI 0.16, 0.51, P < .001) (Table 3).
JLHR and ROM Pearson Correlation.
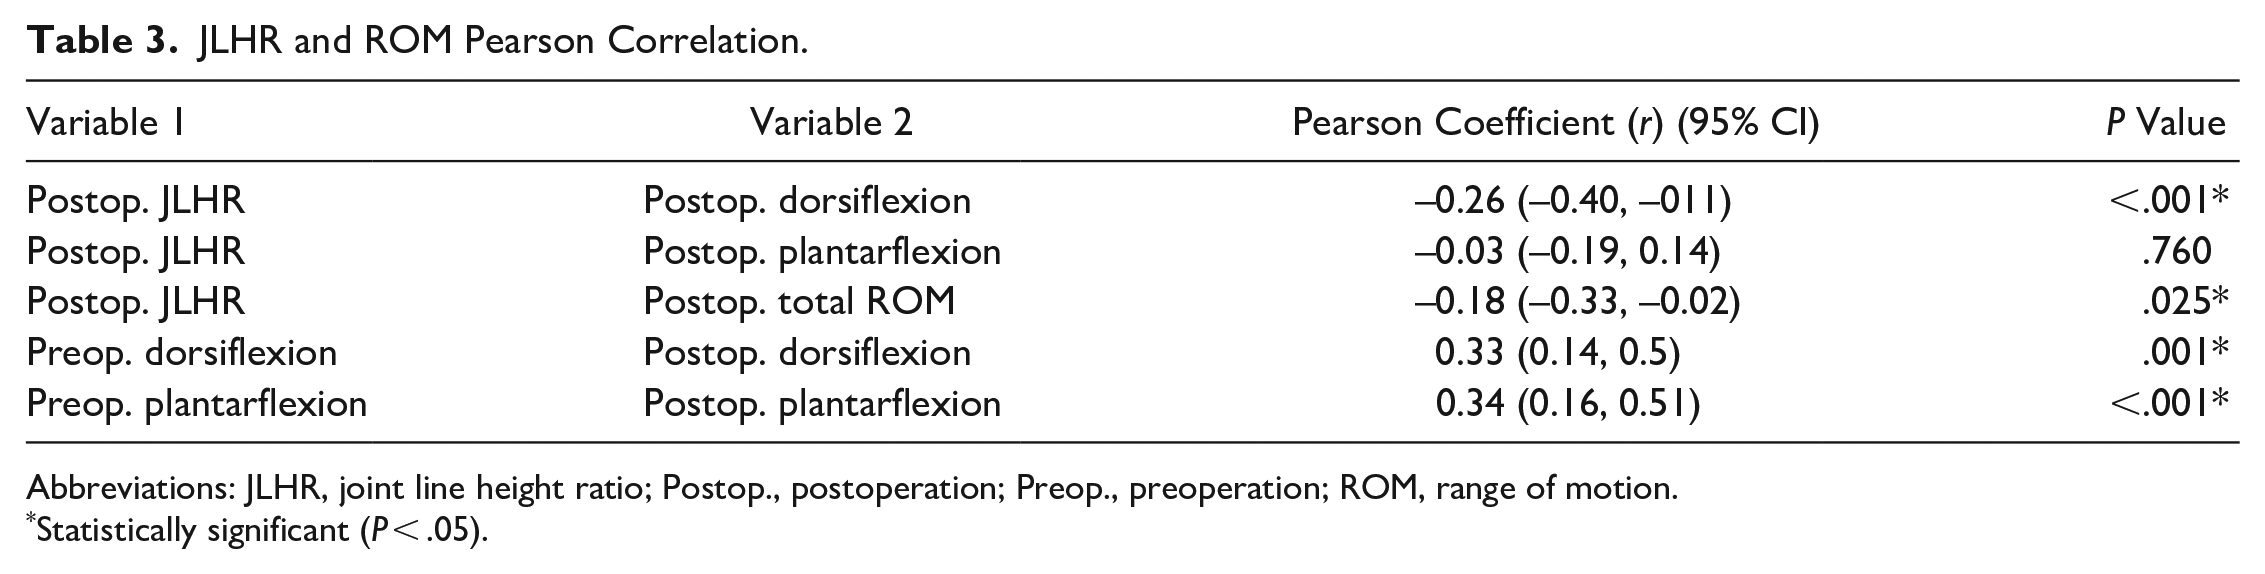
Abbreviations: JLHR, joint line height ratio; Postop., postoperation; Preop., preoperation; ROM, range of motion.
Statistically significant (P < .05).
PROMIS Outcomes
A significant difference was observed between pre- and post-TAA PROMIS PF (−10.01, P < .001), PI (14.88, P < .001), and PIF (14.09, P < .001) (Table 2). There was a correlation between postoperative JLHR and 1-year PROMIS scores in all 3 domains assessed. JHLR was negatively correlated with PROMIS PF (r = −0.22, P = .046) and positively correlated with PROMIS PI (r = 0.22, P = .042) and PROMIS PIF (r = 0.29, P = .007), indicating that a higher post-TAA joint line was correlated with decreased 1-year PF and increased PI and PIF scores. In addition, there was a correlation between post-TAA dorsiflexion and 1-year PROMIS PIF (r = −0.21, P = .048) (Table 4).
One-Year PROMIS Scores Pearson Correlation.
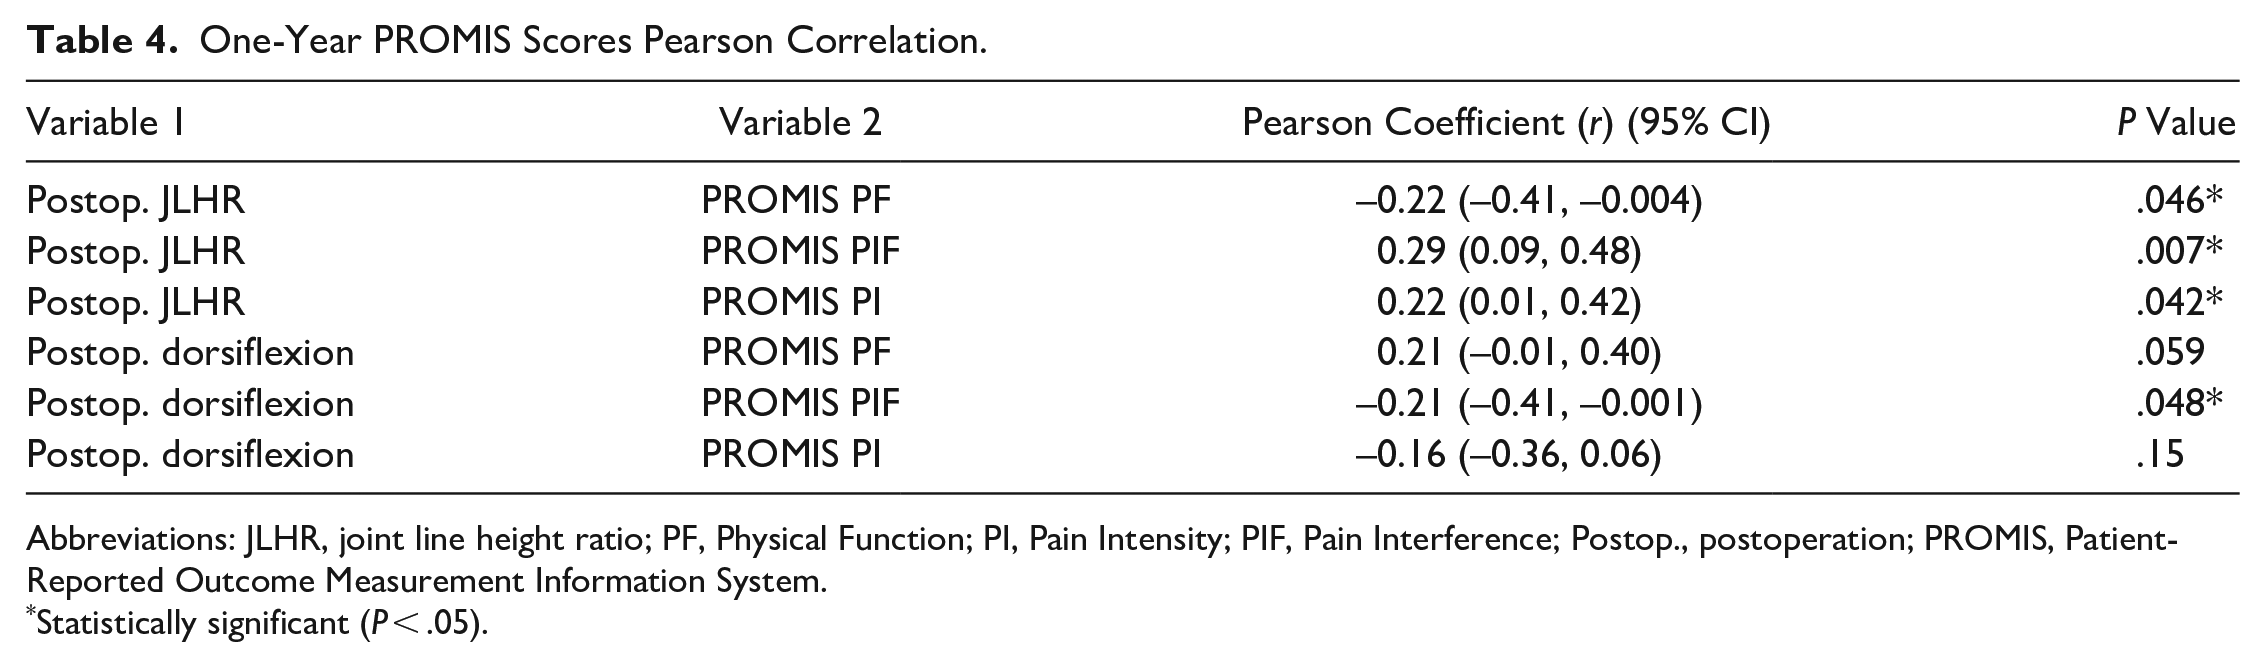
Abbreviations: JLHR, joint line height ratio; PF, Physical Function; PI, Pain Intensity; PIF, Pain Interference; Postop., postoperation; PROMIS, Patient-Reported Outcome Measurement Information System.
Statistically significant (P < .05).
Multivariable Linear Regression Model
Regression analysis identified an association between the postoperative JLHR and post-TAA dorsiflexion (coeff. [SE] = −5.13 [1.78], P = .005), suggesting that post-TAA dorsiflexion was 0.5 degrees lower in a patient with 0.1-unit increase in JLHR. Post-TAA dorsiflexion was not associated in the regression model with preoperative dorsiflexion, tibial component sagittal alignment, TAL, GR, and polyethylene thickness (Figure 3). Conversely, there was no association between post-TAA JLHR with a postoperative plantarflexion and total ROM. The regression model is further detailed in Table 5.
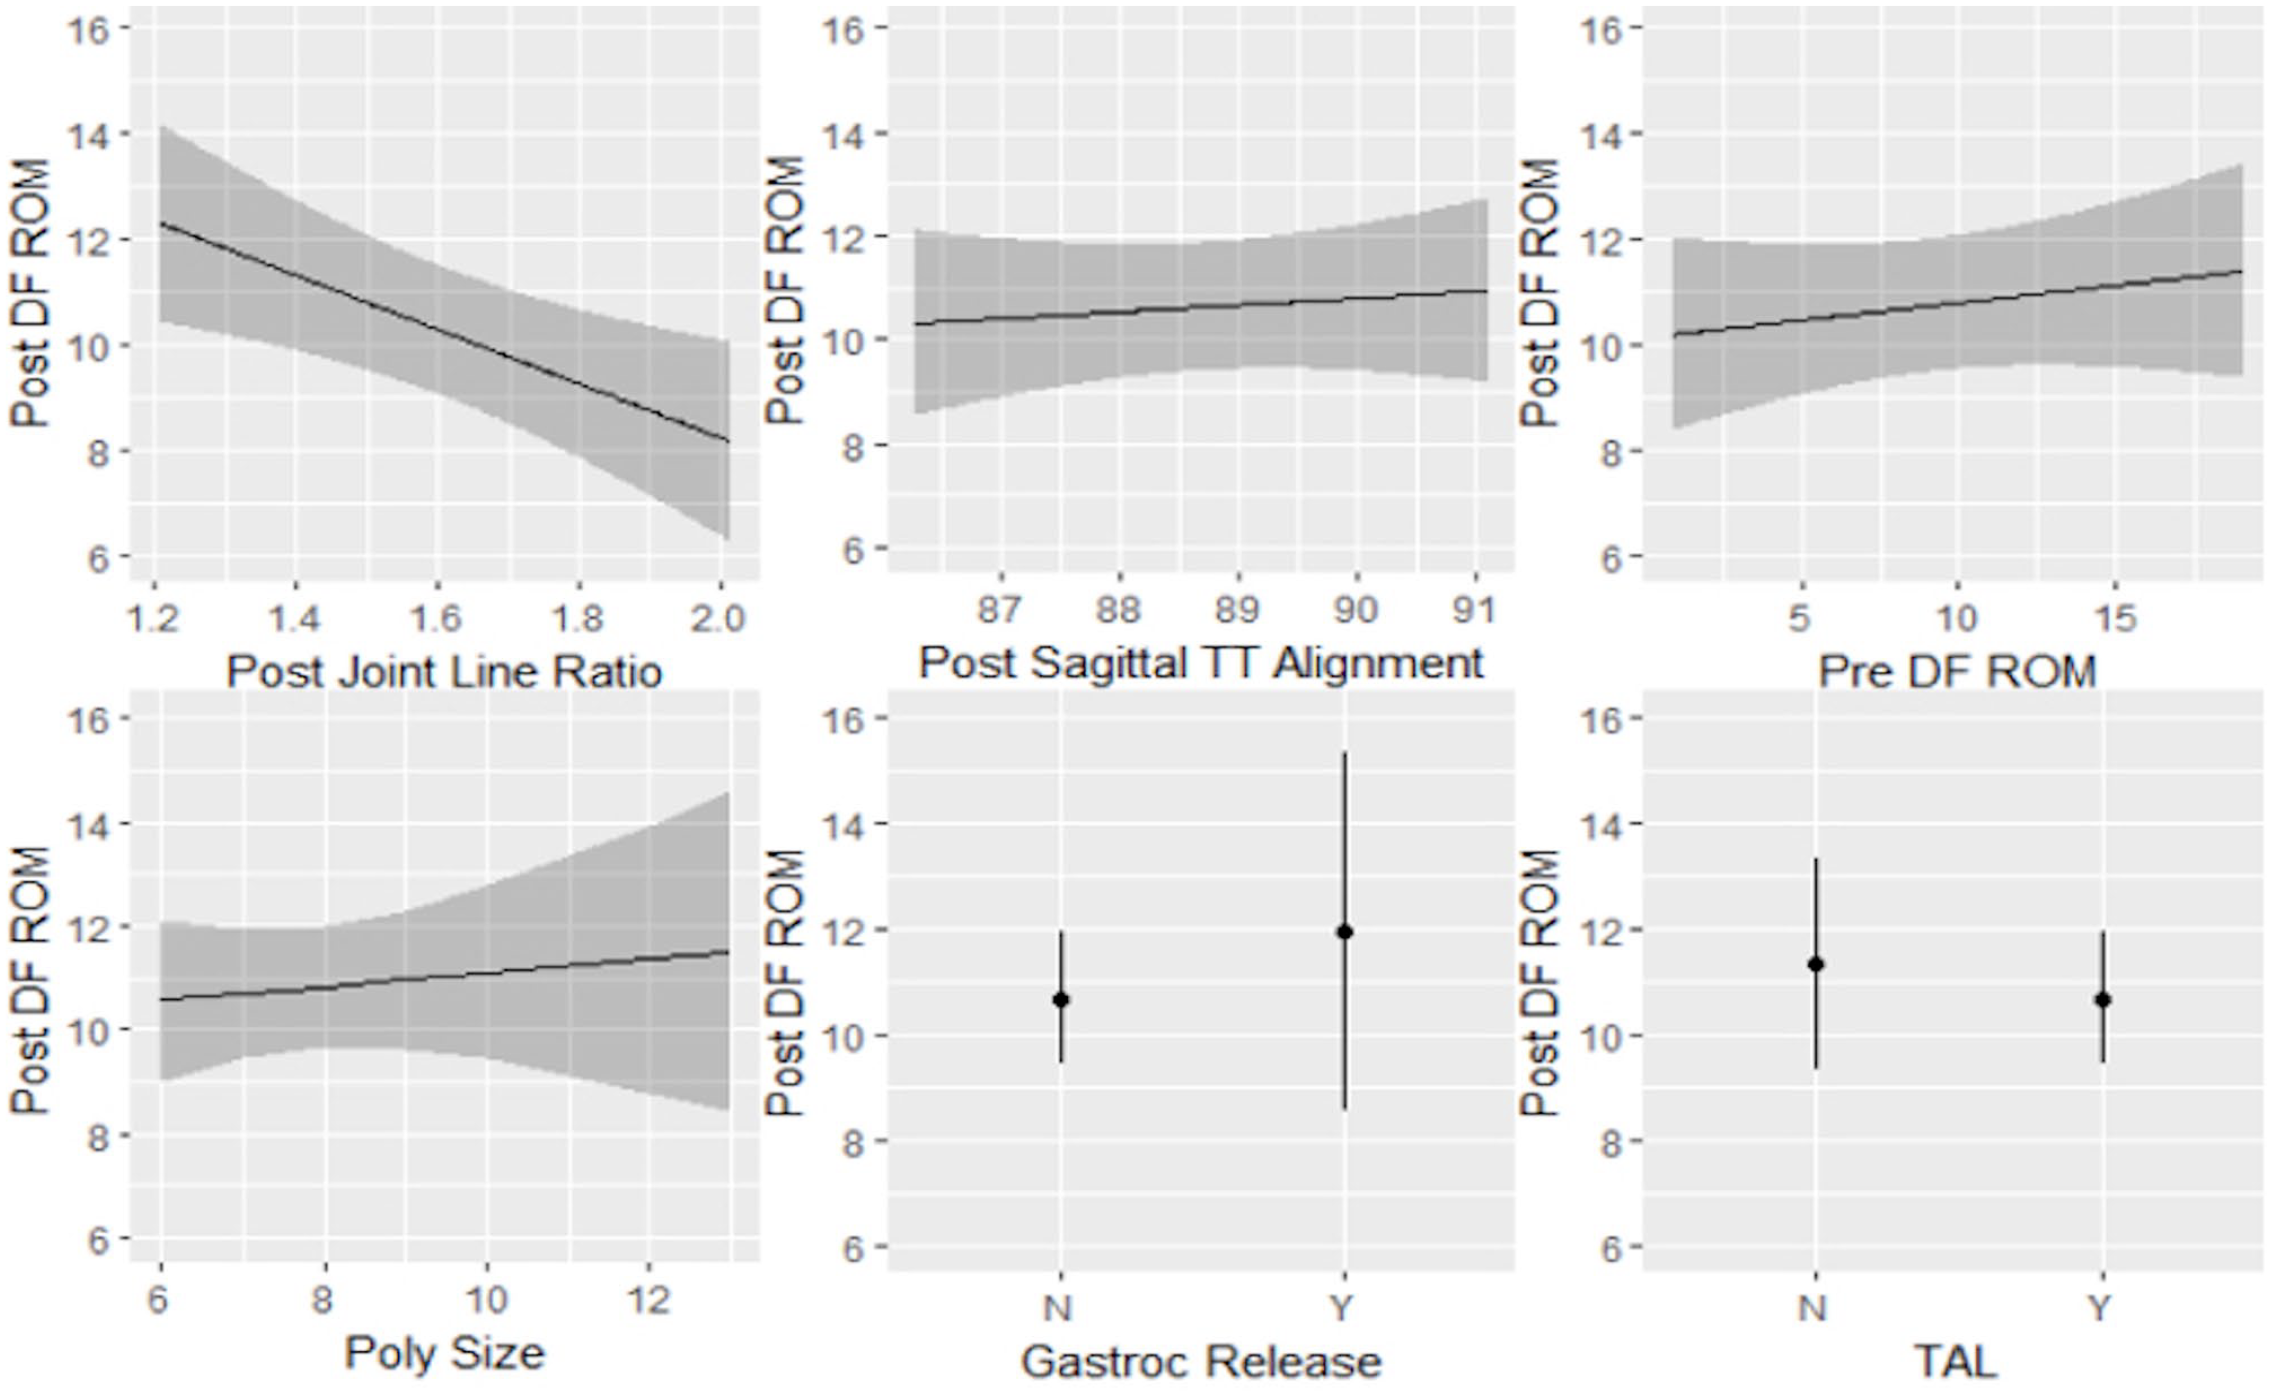
Partial logistic regression plots with postoperative TAA dorsiflexion (Post DF ROM) as the outcome. Restricted postoperative TAA tibiotalar dorsiflexion was significantly associated with an elevated joint line after TAA (coeff. = −5.13, P = .005). No association was found between postoperative TAA tibiotalar dorsiflexion and postoperative tibial component sagittal alignment, preoperative dorsiflexion ROM, polyethylene size, gastrocnemius release, or Achilles tendon lengthening. ROM, range of motion; TAA, total ankle arthroplasty.
Multivariable Linear Regression Models With Postoperative Tibiotalar Dorsiflexion, Plantarflexion, and Total ROM as Outcomes.
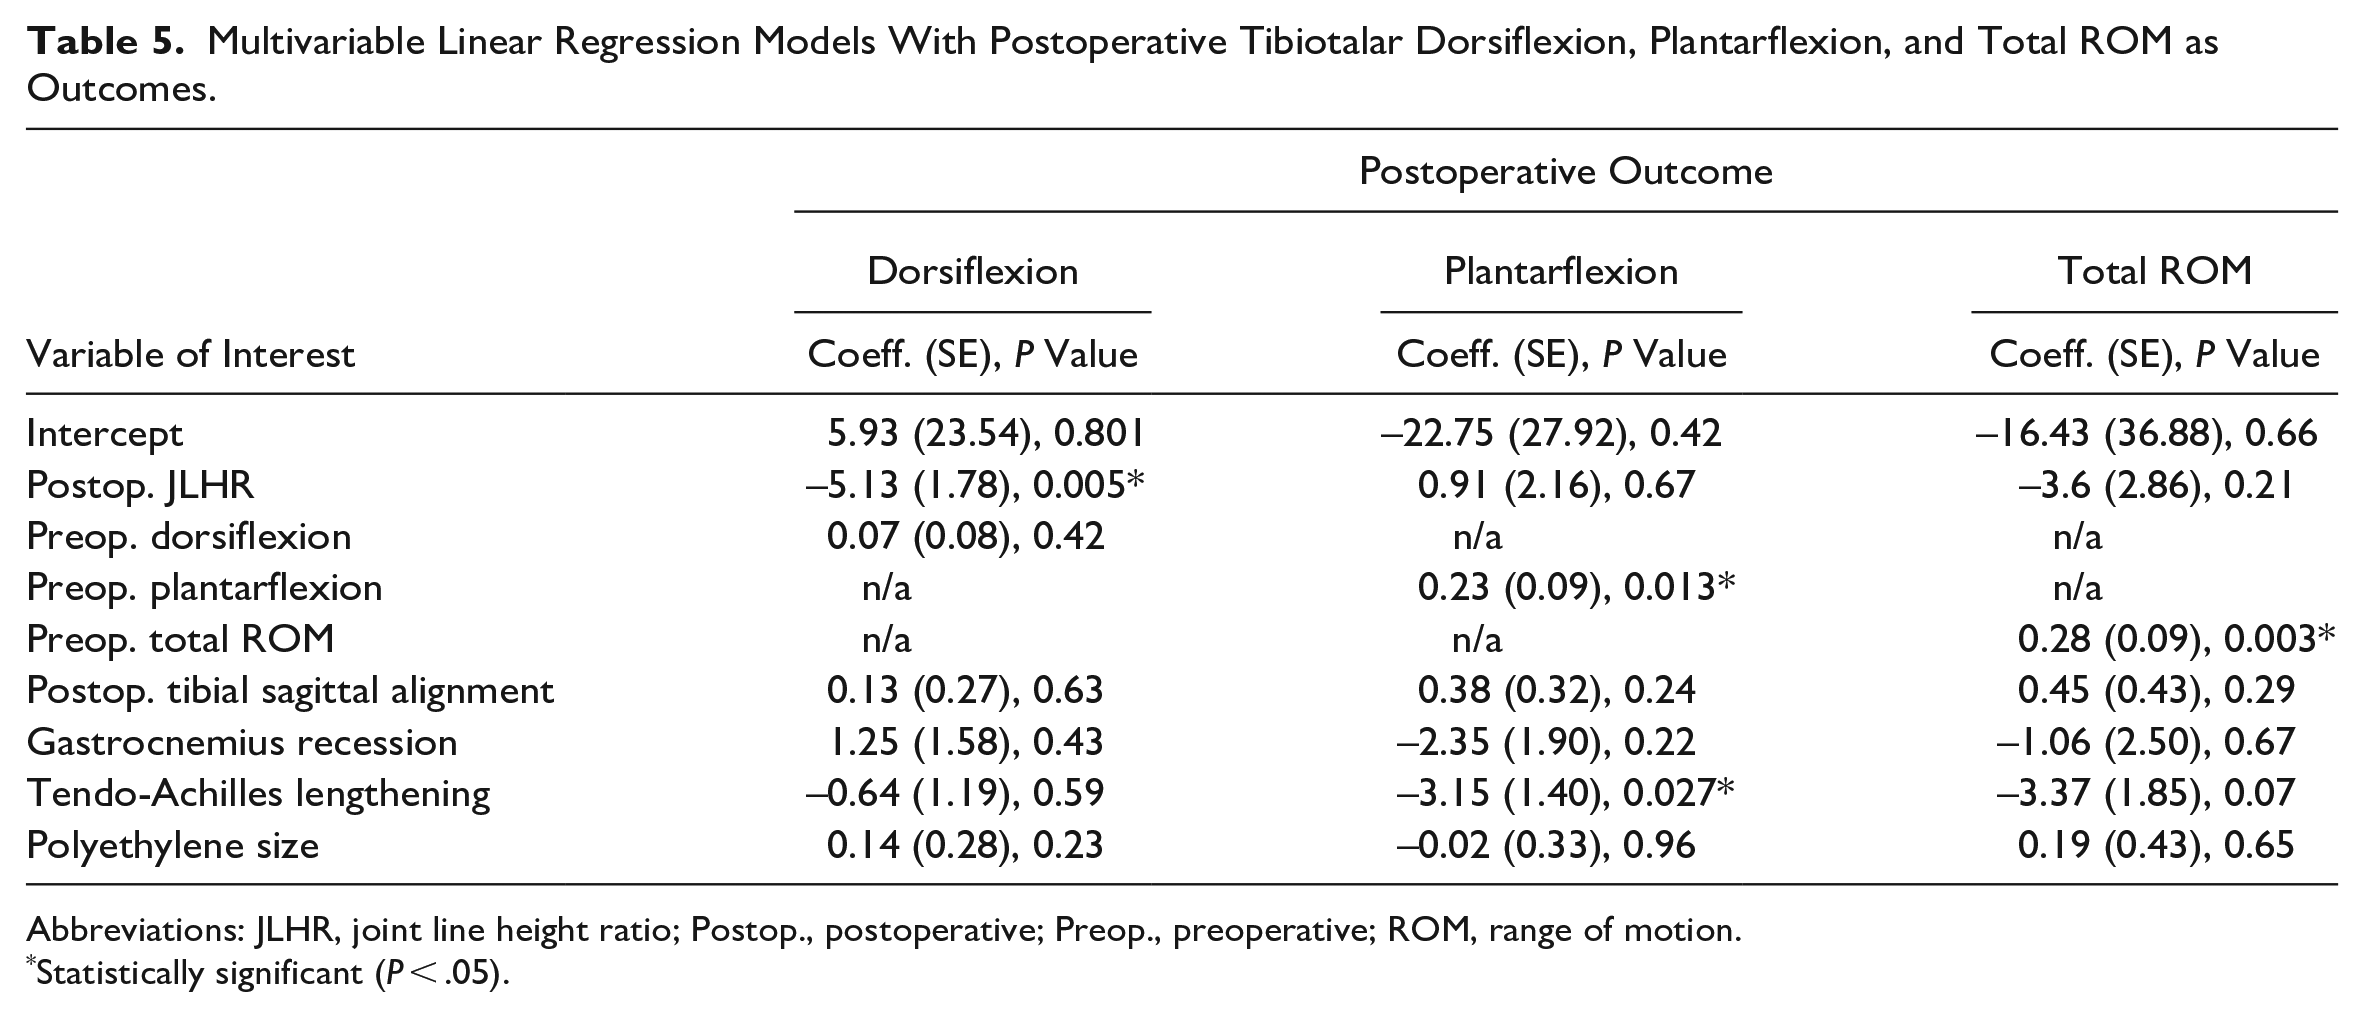
Abbreviations: JLHR, joint line height ratio; Postop., postoperative; Preop., preoperative; ROM, range of motion.
Statistically significant (P < .05).
Discussion
Our results suggest that the postoperative joint line level, as measured by the JLHR, was lowered following TAA, though it remained elevated compared to previously reported normative values. 18 A higher JLHR after TAA was correlated with less post-TAA tibiotalar dorsiflexion and total ROM and worse 1-year PROMIS scores in the PF, PI, and PIF domains. In addition, the JLHR exhibited excellent interobserver reliability between the 2 graders. This finding is similar to the reliability published by the original study describing the JHLR. 18
In ankle arthritis, the distal tibia often experiences more significant subchondral erosion than the talus, resulting in an elevated joint line over time. 4 In the previous study describing the JLHR, the authors found no difference between the pre- and post-TAA joint line levels, and the joint line remained elevated compared to the nonarthritic contralateral ankle. 18 Years of adaptation, including soft tissue contracture, bone erosion, and deformity, make restoring the native joint line after TAA challenging. Although our findings indicate that the joint line was lowered after TAA, it is likely that it remained elevated, as evidenced by the comparison between the mean post-TAA JLHR from our study (1.55) and the mean JLHR of the nonarthritic contralateral ankle (1.39) reported in the original research describing the JLHR. 18 Thus, using the contralateral nonarthritic side as a template for the tibial and talar cuts may be more suitable when planning the procedure. During surgery, the level of the ankle joint can be affected by adjusting the amount of bone resection from the tibia and talus, as well as choosing the appropriate polyethylene thickness. Minimizing the tibial resection is the most effective way to lower the level of the joint, however, this may lead to resecting too much talar bone. If a patient has significant erosive changes in the talus, undersection of the talus may be necessary, and the postoperative joint line may become elevated. Undersizing the polyethylene can elevate the joint line; however, this may lead to instability of the total ankle. Oversizing the polyethylene can lower the joint line, and this can be useful in cases when the smallest insert has symmetric laxity to varus and valgus stress. However, when the ankle is stable, increasing the polyethylene size may lead to overtension of the periarticular ligaments and tendons, causing stiffness postoperatively. Therefore, we recommend using implant stability as the primary factor when choosing a polyethylene size and using the amount of bone resected from the tibia and talus as the primary means of affecting the joint line level postoperatively.
Using the JLHR as a measurement method of the level of the ankle joint has several advantages. 18 It is a reliable method based on widely available standard ankle radiographs that use constant bony landmarks. It is expressed as a ratio instead of an absolute value, eliminating the discrepancies that may arise due to magnification. However, understanding the JLHR can be challenging from a clinical perspective and does not offer an actionable measurement that can be used during surgery. To contextualize JLHR interpretation, it is necessary to consider how it is obtained (Figure 1). The JLHR is calculated after dividing the vertical joint line distance (VJLD) by the vertical intermalleolar distance (VIMD). The VIMD is usually preserved in patients without osteotomies because it relies on constant bony landmarks from the fibular tip and medial malleolus. On the other hand, the VJLD is directly influenced by the amount of bone resection and polyethylene thickness. Thus, changes in the JLHR are dependent on modifications of the VJLD. It is worth noting that differences between pre- and postoperative JLHRs are usually small and occur within decimal units. In our study, the mean pre- to post-TAA JLHR difference was 0.12, which indicates a postoperative lowering of the joint line by a few millimeters. For instance, a 1-mm change in tibial resection would correlate to a change of around 0.05 in the resultant JLHR, assuming constant VIMD and polyethylene size. Despite the JLHR being a reliable method to measure the joint line level, utilizing calibrated radiographs would allow for more relevant information regarding how many millimeters to lower the joint line, thus better guiding surgical decision making.
Range of motion is an important metric used for studying patients after TAA.2,7,13,30 Previous evidence demonstrated that preoperative ROM was the main factor determining the eventual post-TAA ROM. 10 Another study showed that patients with stiff ankles improved function and gait more significantly than patients with good mobility. 7 In our research, we found a clinically modest but statistically significant improvement in dorsiflexion after TAA, but no significant increase in plantarflexion and total ROM was observed. In addition, there was a correlation between pre- and post-TAA dorsiflexion and plantarflexion, confirming findings from previous studies. 10 Notably, a higher joint line correlated with decreased dorsiflexion and total ROM. However, the regression analysis showed only a small association between the JLHR and postoperative dorsiflexion. A JLHR increase of 0.1 unit would result in a 0.5-degree reduction in ankle dorsiflexion. This would be a substantial change in the JLHR for a modest motion improvement, highlighting that although restoring the joint line after TAA may influence ROM, there are other factors that may play a greater role. Several studies demonstrated that joint line elevation after TKA correlates with restricted ROM, joint stiffness, and acquired patella baja.5,23,31 The results of our study show that an elevated joint line after TAA, as measured by the JLHR, led to similar consequences on post-TAA ROM. Changes to the joint line level may impact the functional length of the long flexors and extensors of the ankle, thus affecting how these muscles are able to generate force and enact dorsiflexion and plantarflexion. An elevated joint line shortens the functional length of the musculotendinous unit, thus limiting its ability to generate force. Restoring the joint line can help reestablish the length-force relationships of the extrinsic muscles, but lowering it beyond normal values may overtension the periarticular ligaments and result in a passive restriction to motion.
Our study showed we achieved a minimal clinically important difference between pre- and postoperative 1-year PROMIS scores following TAA. 11 In addition, we observed a correlation between an elevated postoperative joint line and worse PF and increased PI and PIF PROMIS scores, concordant with previous studies in TKA reporting worse patient-reported outcomes due to joint line elevation.23,27 These results can be partially explained by the association between a higher JLHR and restricted postoperative ROM. Various authors have suggested that maintaining motion at the ankle joint may slow the progression of arthritis in the adjacent hindfoot joints.24,33 Postoperative ROM after TAA has also been demonstrated to correlate with multiple clinical outcome measures. In a previous study, radiographic dorsiflexion after TAA was positively correlated with multiple clinical outcomes (FADI, SF-36 Mental Component Summary, and SMFA Bother and Function Indices) in a cohort with prospectively collected data. 13 In addition, patients with limited post-TAA ROM at long-term follow-up tend to have higher pain levels. 30 It is worth noting that the elevation of the joint line had a small effect on the 1-year PROMIS scores, and the large sample size may explain the significance. Therefore, it should only be considered as an additional factor. Although it is not possible to accurately determine the clinical implications of the joint line level on overall TAA outcomes, our findings suggest that the joint height should be considered during preoperative planning since it appeared as a significant contributing factor.
This study demonstrates the influence of the joint line level, as measured by the JLHR, on clinical outcomes and ankle ROM following TAA in a cohort with prospectively collected data. However, our work has some limitations. First, despite the post-TAA JLHR being significantly lowered compared to preoperative values, no comparison between the postoperative and nonarthritic contralateral ankle JLHRs was performed. This is the main limitation of our study. Though ankle arthritis is often posttraumatic and presents unilaterally, this is not always true. Often patients do not have a nonarthritic contralateral ankle for comparison. Practically as well, we did not have contralateral ankle radiographs available for the entire cohort of patients. Future research using the contralateral ankle as a template is still warranted. Second, a substantial limitation of the JLHR is its reliance on constant bony landmarks, which may hinder clinical application in cases with concomitant fibular and malleolar osteotomies, malunions, and TAA revisions. Third, we acknowledge that our effects are small, and the large sample size may have influenced our findings regarding the association between the JLHR, ROM, and 1-year PROMIS scores. A considerable change in the JLHR is required for a clinically meaningful improvement of the postoperative ROM. In addition, patient-related factors such as age, significant comorbidities, adjacent joint arthritis, and arthritic etiology were not included in the analysis. Therefore, although we observed a correlation between the JLHR and 1-year PROMIS scores, other factors may have influenced these results. Future studies assessing the clinical implications of the joint line level in TAA should control for the myriad of clinical factors. Lastly, more than a 1-year follow-up period is needed to evaluate long-term clinical and functional outcomes and to determine the joint level’s role in reoperation and revision after TAA. 1
Conclusion
The JLHR was a reliable method to determine the level of the ankle joint. Following TAA, the joint line level, as measured by the JLHR, was significantly lowered but not fully restored when compared to normative values. A higher JLHR modestly correlated with decreased postoperative ROM and worse 1-year PROMIS scores. Although a significant change in the JLHR is necessary for a modest improvement in ROM, the joint line level appeared as an additional factor that may impact the success of treating end-stage ankle arthritis with TAA. Therefore, the authors think it should be considered during preoperative planning and determined by adjusting the amount of bone resection and polyethylene size based on proper soft tissue balancing and deformity correction. Future studies investigating ROM and clinical outcomes after TAA should consider including a measure of joint line height, such as JLHR, because we found it was associated with ROM and patient-reported outcomes.
Supplemental Material
sj-pdf-1-fai-10.1177_10711007231198515 – Supplemental material for Influence of Joint Line Level on Clinical Outcomes and Range of Motion in Total Ankle Arthroplasty
Supplemental material, sj-pdf-1-fai-10.1177_10711007231198515 for Influence of Joint Line Level on Clinical Outcomes and Range of Motion in Total Ankle Arthroplasty by Joaquin Palma, Isabel Shaffrey, Jaeyoung Kim, Agnes Cororaton, Jensen Henry, Scott J. Ellis and Constantine A. Demetracopoulos in Foot & Ankle International
Footnotes
Ethical Approval
Ethical approval for this study was obtained from our hospital’s institutional review board (#2020-2132).
Declaration of Conflicting Interests
The author(s) declared no potential conflicts of interest with respect to the research, authorship, and/or publication of this article. ICMJE forms for all authors are available online.
Funding
The author(s) received no financial support for the research, authorship, and/or publication of this article.
References
Supplementary Material
Please find the following supplemental material available below.
For Open Access articles published under a Creative Commons License, all supplemental material carries the same license as the article it is associated with.
For non-Open Access articles published, all supplemental material carries a non-exclusive license, and permission requests for re-use of supplemental material or any part of supplemental material shall be sent directly to the copyright owner as specified in the copyright notice associated with the article.