
Abstract
This study examines the relationship between financial inclusion, renewable energy, and CO2 emissions using data from 11 Middle East and North Africa (MENA) countries from 2004 to 2019. Evidence from fixed effects-ordinary least squares (FE-OLS), dynamic ordinary least squares (DOLS), fully modified ordinary least squares (FMOLS), and canonical correlation regression (CRR) showed that financial inclusion contributes significantly to decarbonization. Country-specific analysis indicated that financial inclusion is associated with mitigating CO2 emissions in Egypt, Israel, Qatar, and Tunisia while significantly spurring CO2 emissions in Algeria, Lebanon, and Saudi Arabia. In addition, renewable energy contributes significantly to decarbonization in MENA, especially in Algeria, Lebanon, Tunisia, and Turkey. We recommend that policies promoting financial inclusion and renewable energy usage would contribute to the attainment of the carbon-neutrality goal by MENA countries.
Introduction
This study examines the role of financial inclusion and renewable energy in decarbonization. Financial inclusion implies that all individuals and businesses have access to a range of financial products and services, such as transactions, payments, savings, credit, and insurance, to satisfy their needs in a reasonable, suitable, reliable, and sustainable manner (World Bank, 2018). Accordingly, higher access to these financial services is supposed to accelerate the rate of economic growth and decrease income inequality through offering chances to all people in the society; thus, a prominent level of financial inclusivity within a country can be considered an indicator of its economic stability (Sahay et al., 2015). The increasing interest in this study area stems from increasing policymakers’ awareness of the benefits of inclusive financial systems. International organizations have played a vital role in this context. For instance, in 2005, the United Nations adopted the aim of building inclusive financial systems around the globe and specified 2005 as the Year of Microcredit. 1 According to the Global Findex Database 2021, financial inclusion has increased significantly over the last decade. For instance, the global account ownership rate has increased from 50% in 2011 to 76% in 2021. Additionally, account ownership in developing countries improved by 30 percentage points, from 42% in 2011 to 71% in 2021—a more than 70% rise. 2
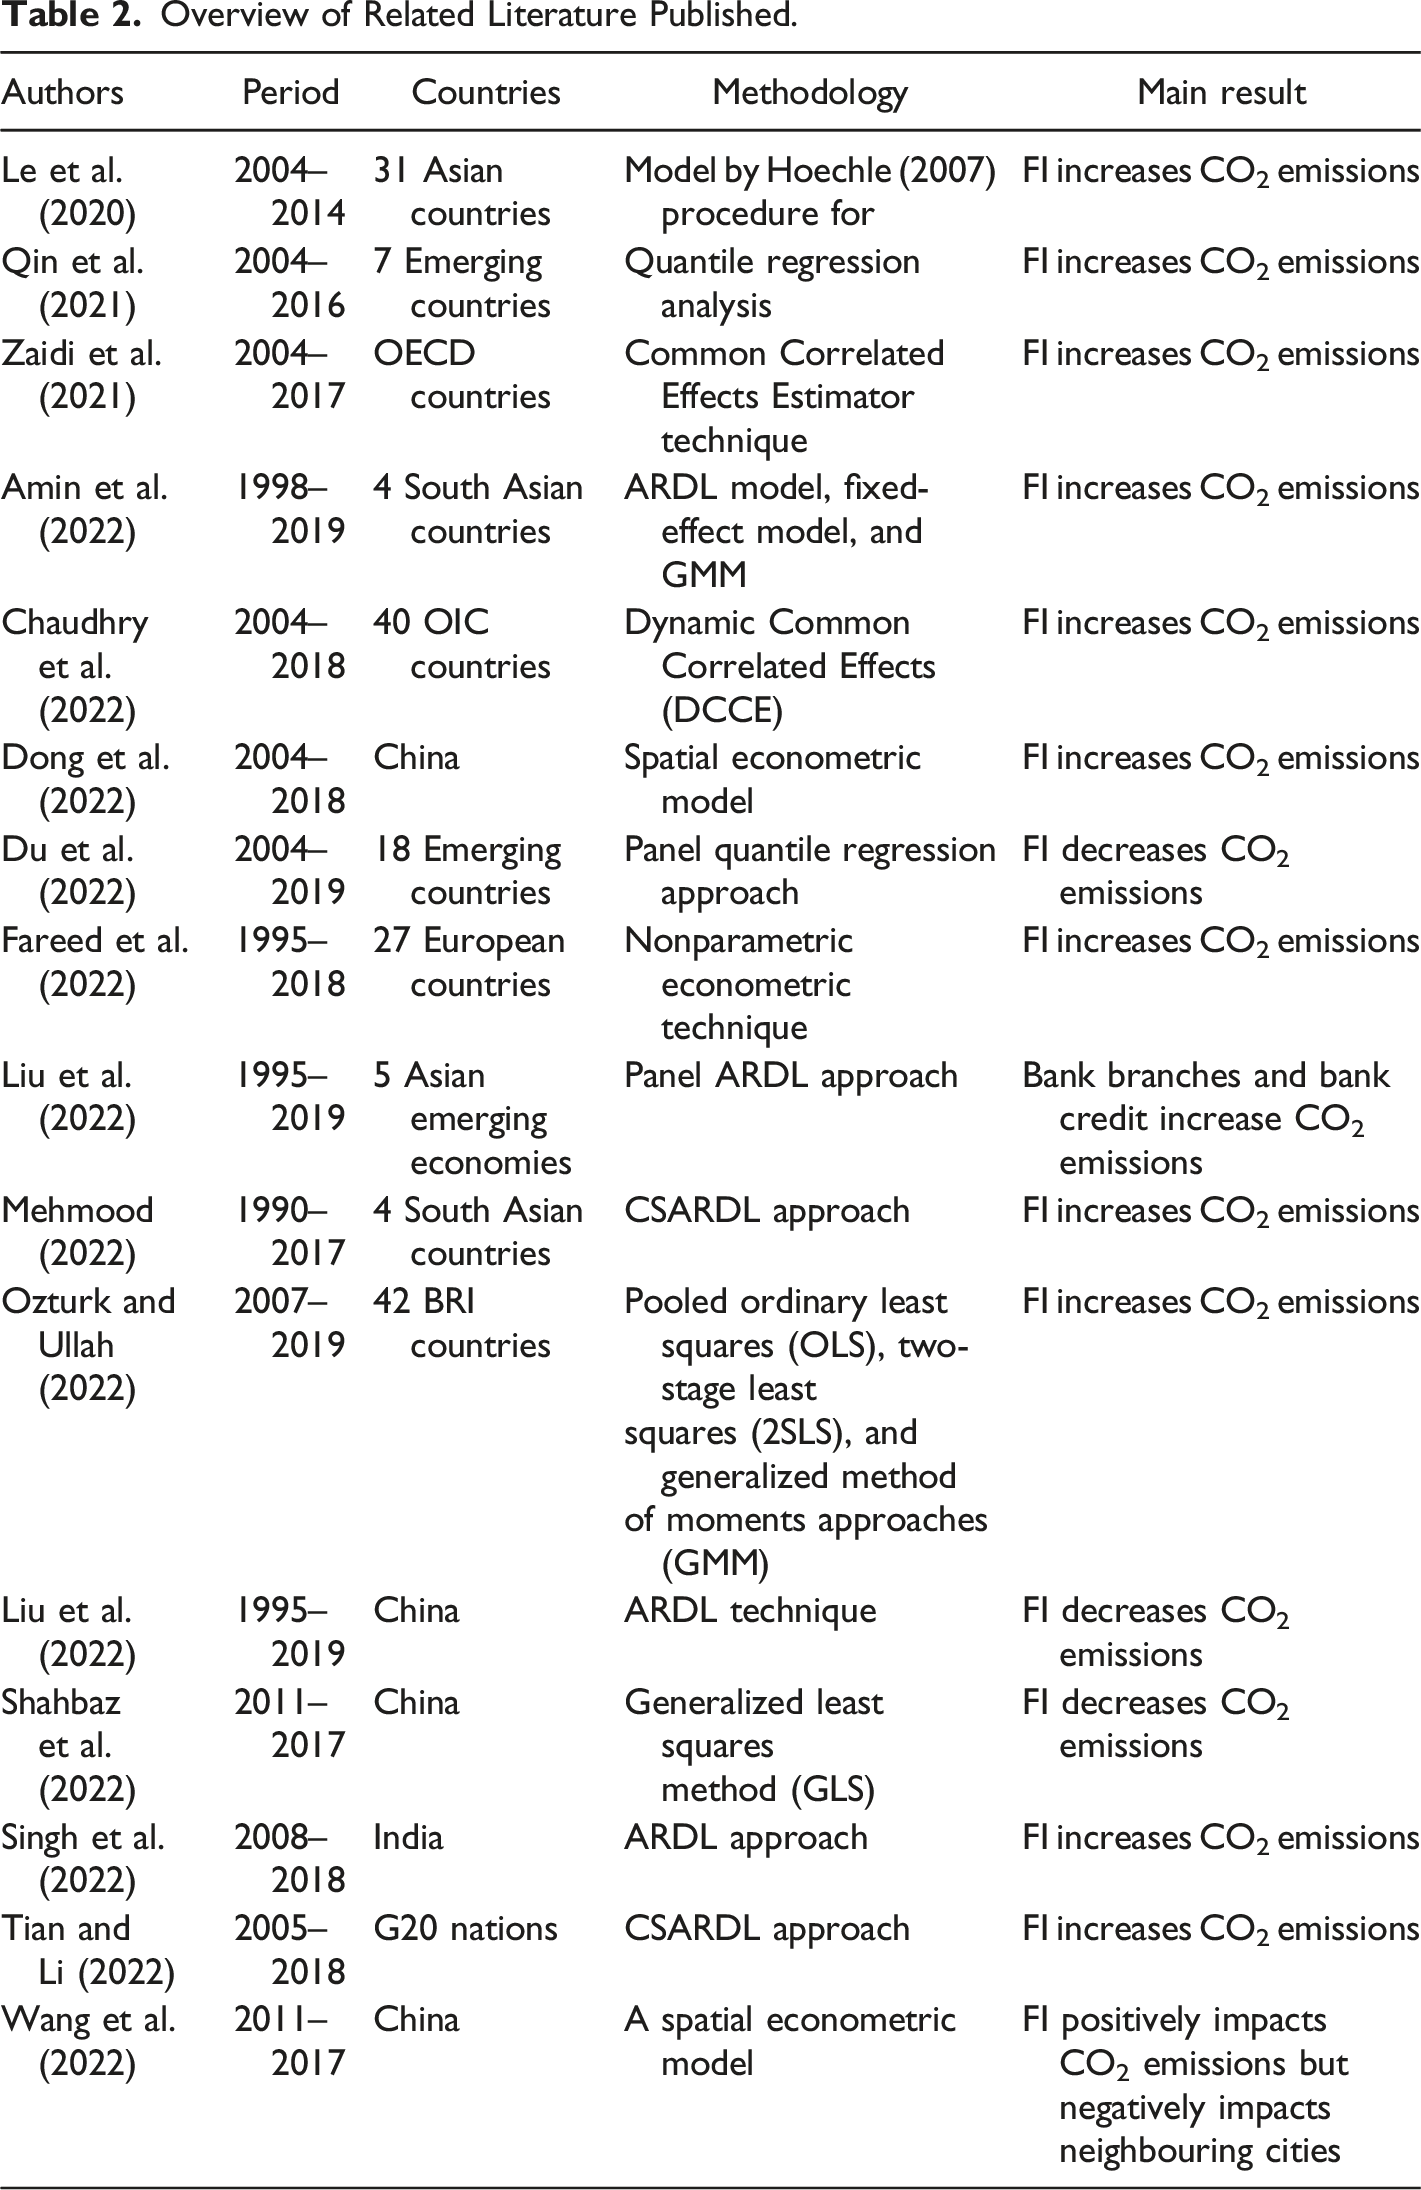
The question that motivates this study is “Has the improvement in financial development and specifically financial inclusion been associated with mitigation or contribution to carbon (CO 2 ) emissions? In theory, the effect of financial inclusion on CO2 emissions is mixed. On the one hand, Du et al. (2022) argue that financial inclusion significantly reduces energy emissions by promoting technological advancements in the energy supply to diminish pollution. On the other hand, higher financial inclusion promotes manufacturing and industrial activities, which may contribute to a higher level of CO2 emissions that, in turn, increases global warming (Jensen, 1996). Whereas there is a different theoretical argument on the impact of financial inclusion on environmental pollution, the empirical findings are also contradictory (Mehmood, 2022; Shahbaz et al., 2022). For instance, Le et al. (2020), Fareed et al. (2022), and Ozturk and Ullah (2022) discovered that financial inclusion brings about environmental pollution in Asia, Europe, and Belt and Road initiative countries. Conversely, Du et al. (2022), Liu et al. (2022), and Wang et al. (2022) indicated that financial inclusion leads to a decrease in environmental pollution in emerging economies, including China.
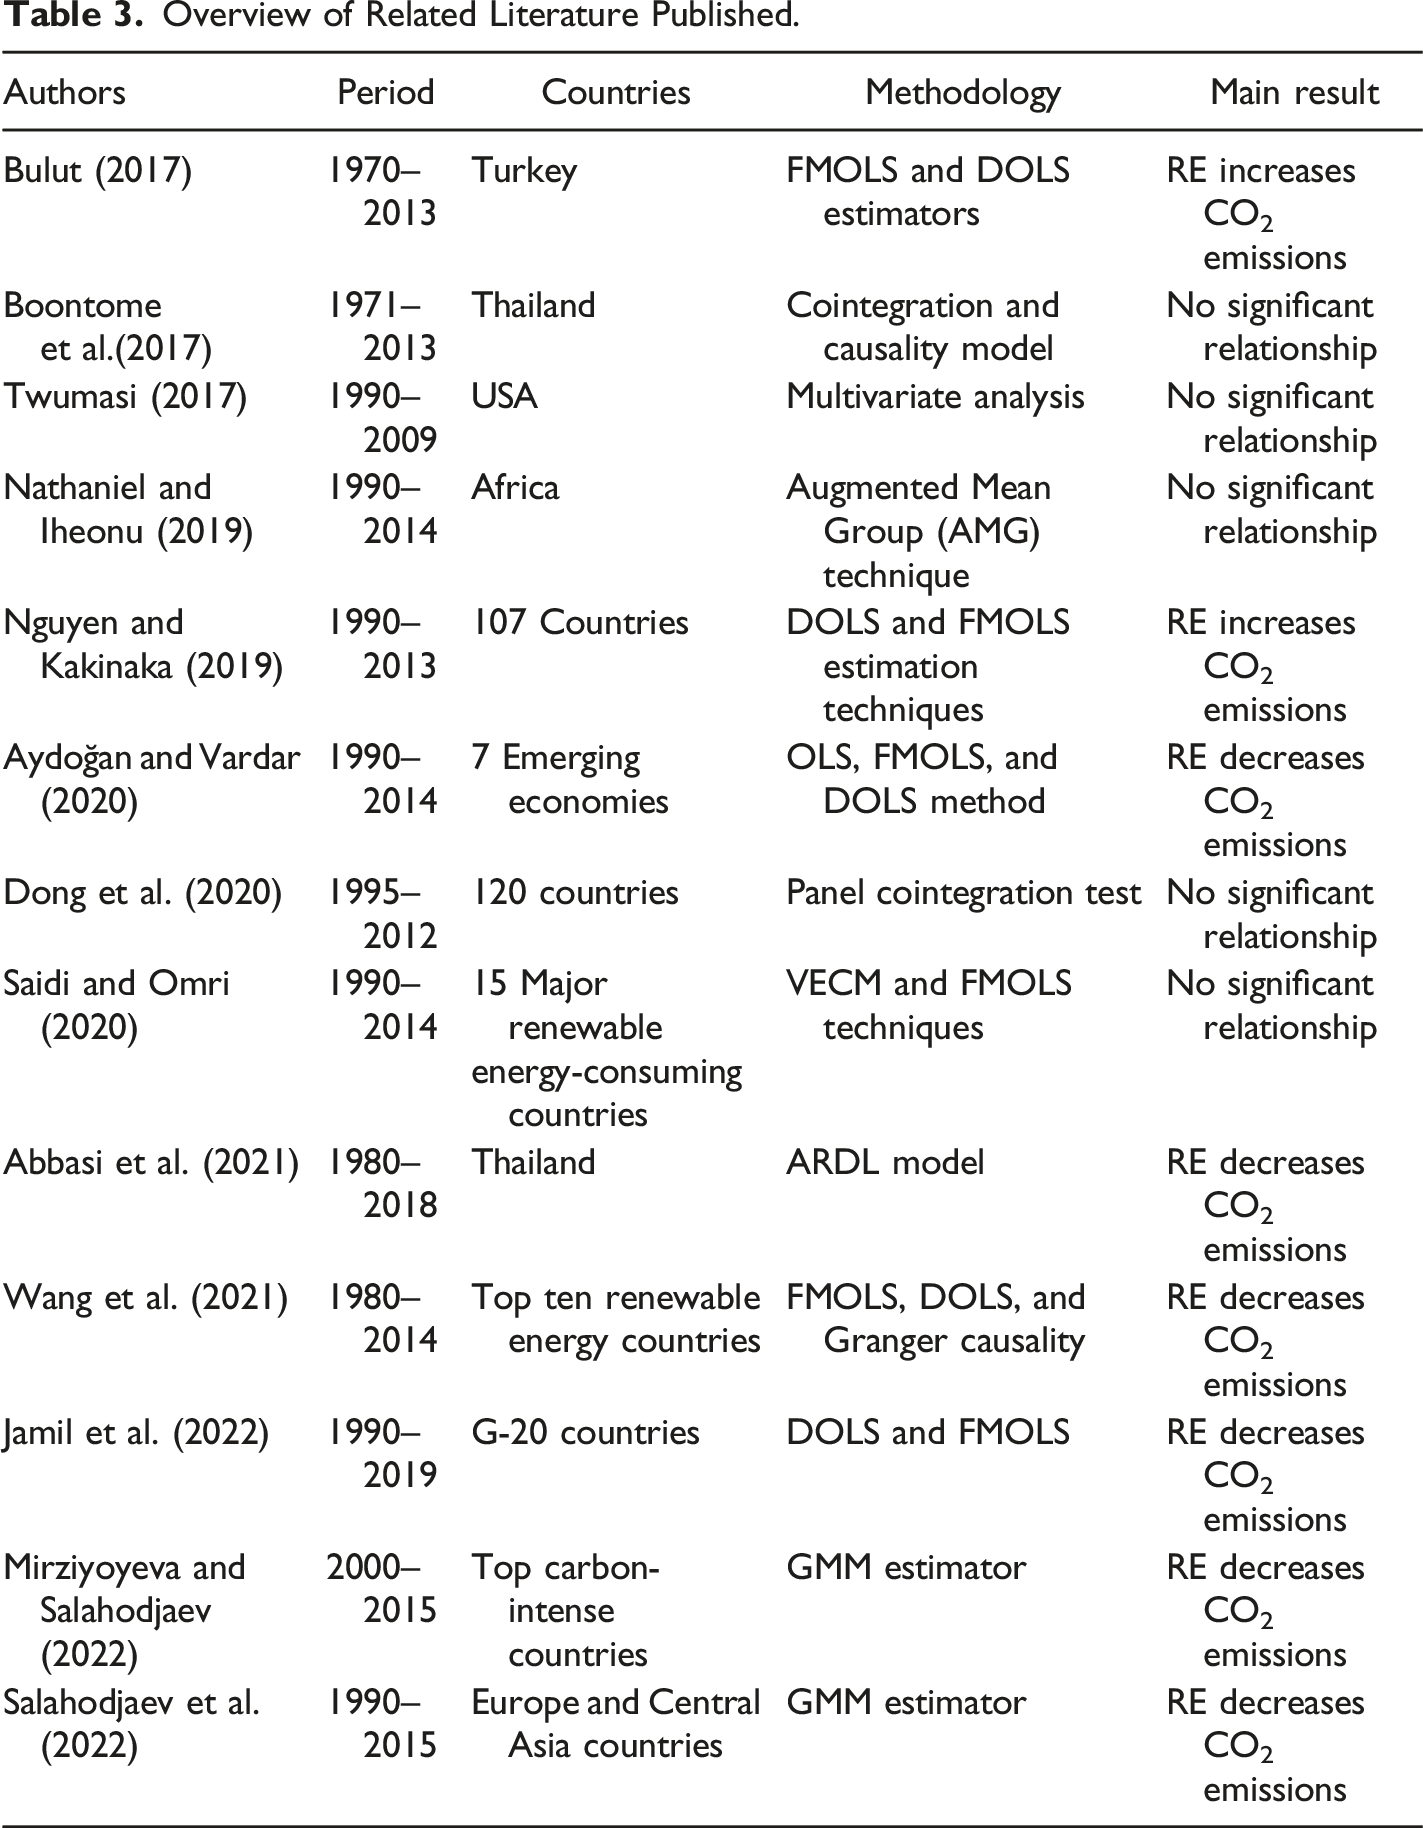
Besides, the discussion on the importance of renewable energy in promoting environmental sustainability has remained unresolved. While some empirical studies suggest (see, e.g.,, Aydoğan & Vardar, 2020; Jamil et al., 2022; Wang et al., 2021) that renewable energy reduces CO2 emissions per capita, other studies such as Boontome et al. (2017); Nathaniel and Iheonu (2019); and Twumasi (2017) showed that renewable energy has a negligible effect on environmental pollution.
This study, therefore, contributes to the literature by assessing the effect of financial inclusion on renewable energy-CO2 emissions link utilizing data from 11 Middle East and North Africa (MENA) countries from 2004 to 2019. In view of the aim of this paper, several questions arouse the authors’ interest. (1) How does financial inclusion affect the environment in the MENA region? (2) Does the effect of financial inclusion on the environment vary across MENA countries? (3) Does renewable energy negatively impact the environment in the MENA region as a panel? (4) Does the relationship between renewable energy and CO 2 emissions vary across MENA countries?
Percentage of the Adult Population With an Account at a Financial Institution.
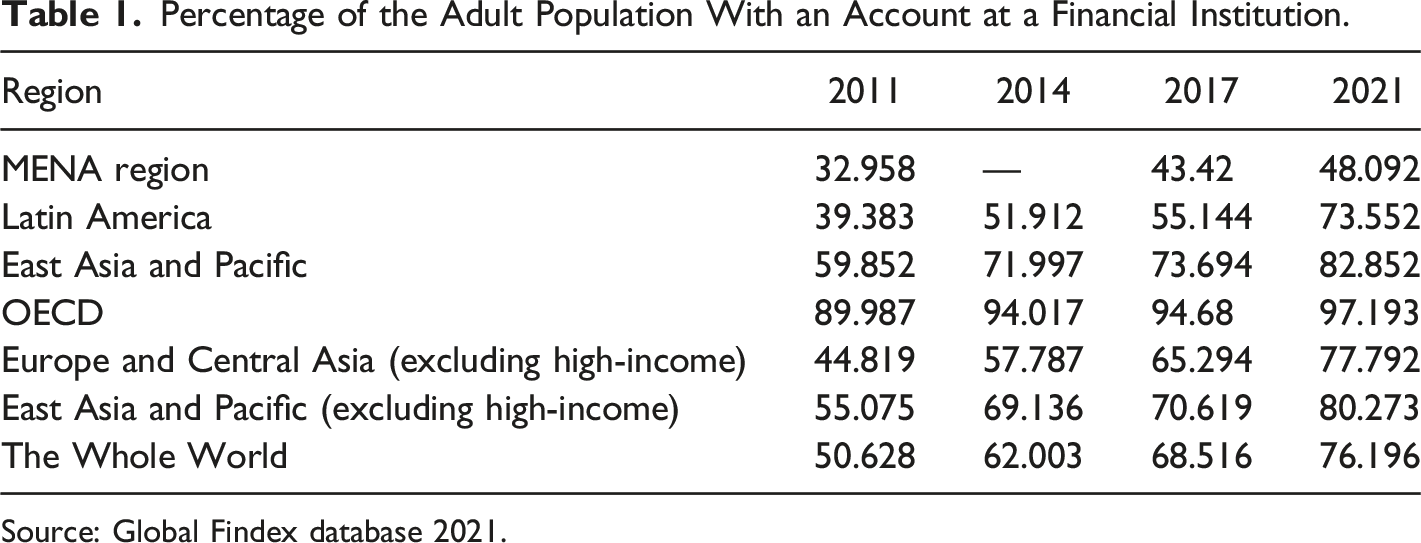
Source: Global Findex database 2021.
Second, CO2 emissions per capita in the region have also risen over the last two decades. According to the World Bank (2022), CO2 emissions per capita were 4.4 metric tons in 2004. By 2010, that amount increased to 5.4 metric tons and then continued to rise to 5.6 metric tons by 2015 before it fell slightly to 5.4 metric tons in 2019 (see Figure 1). Trend of carbon emissions in the MENA region. Source: World Bank.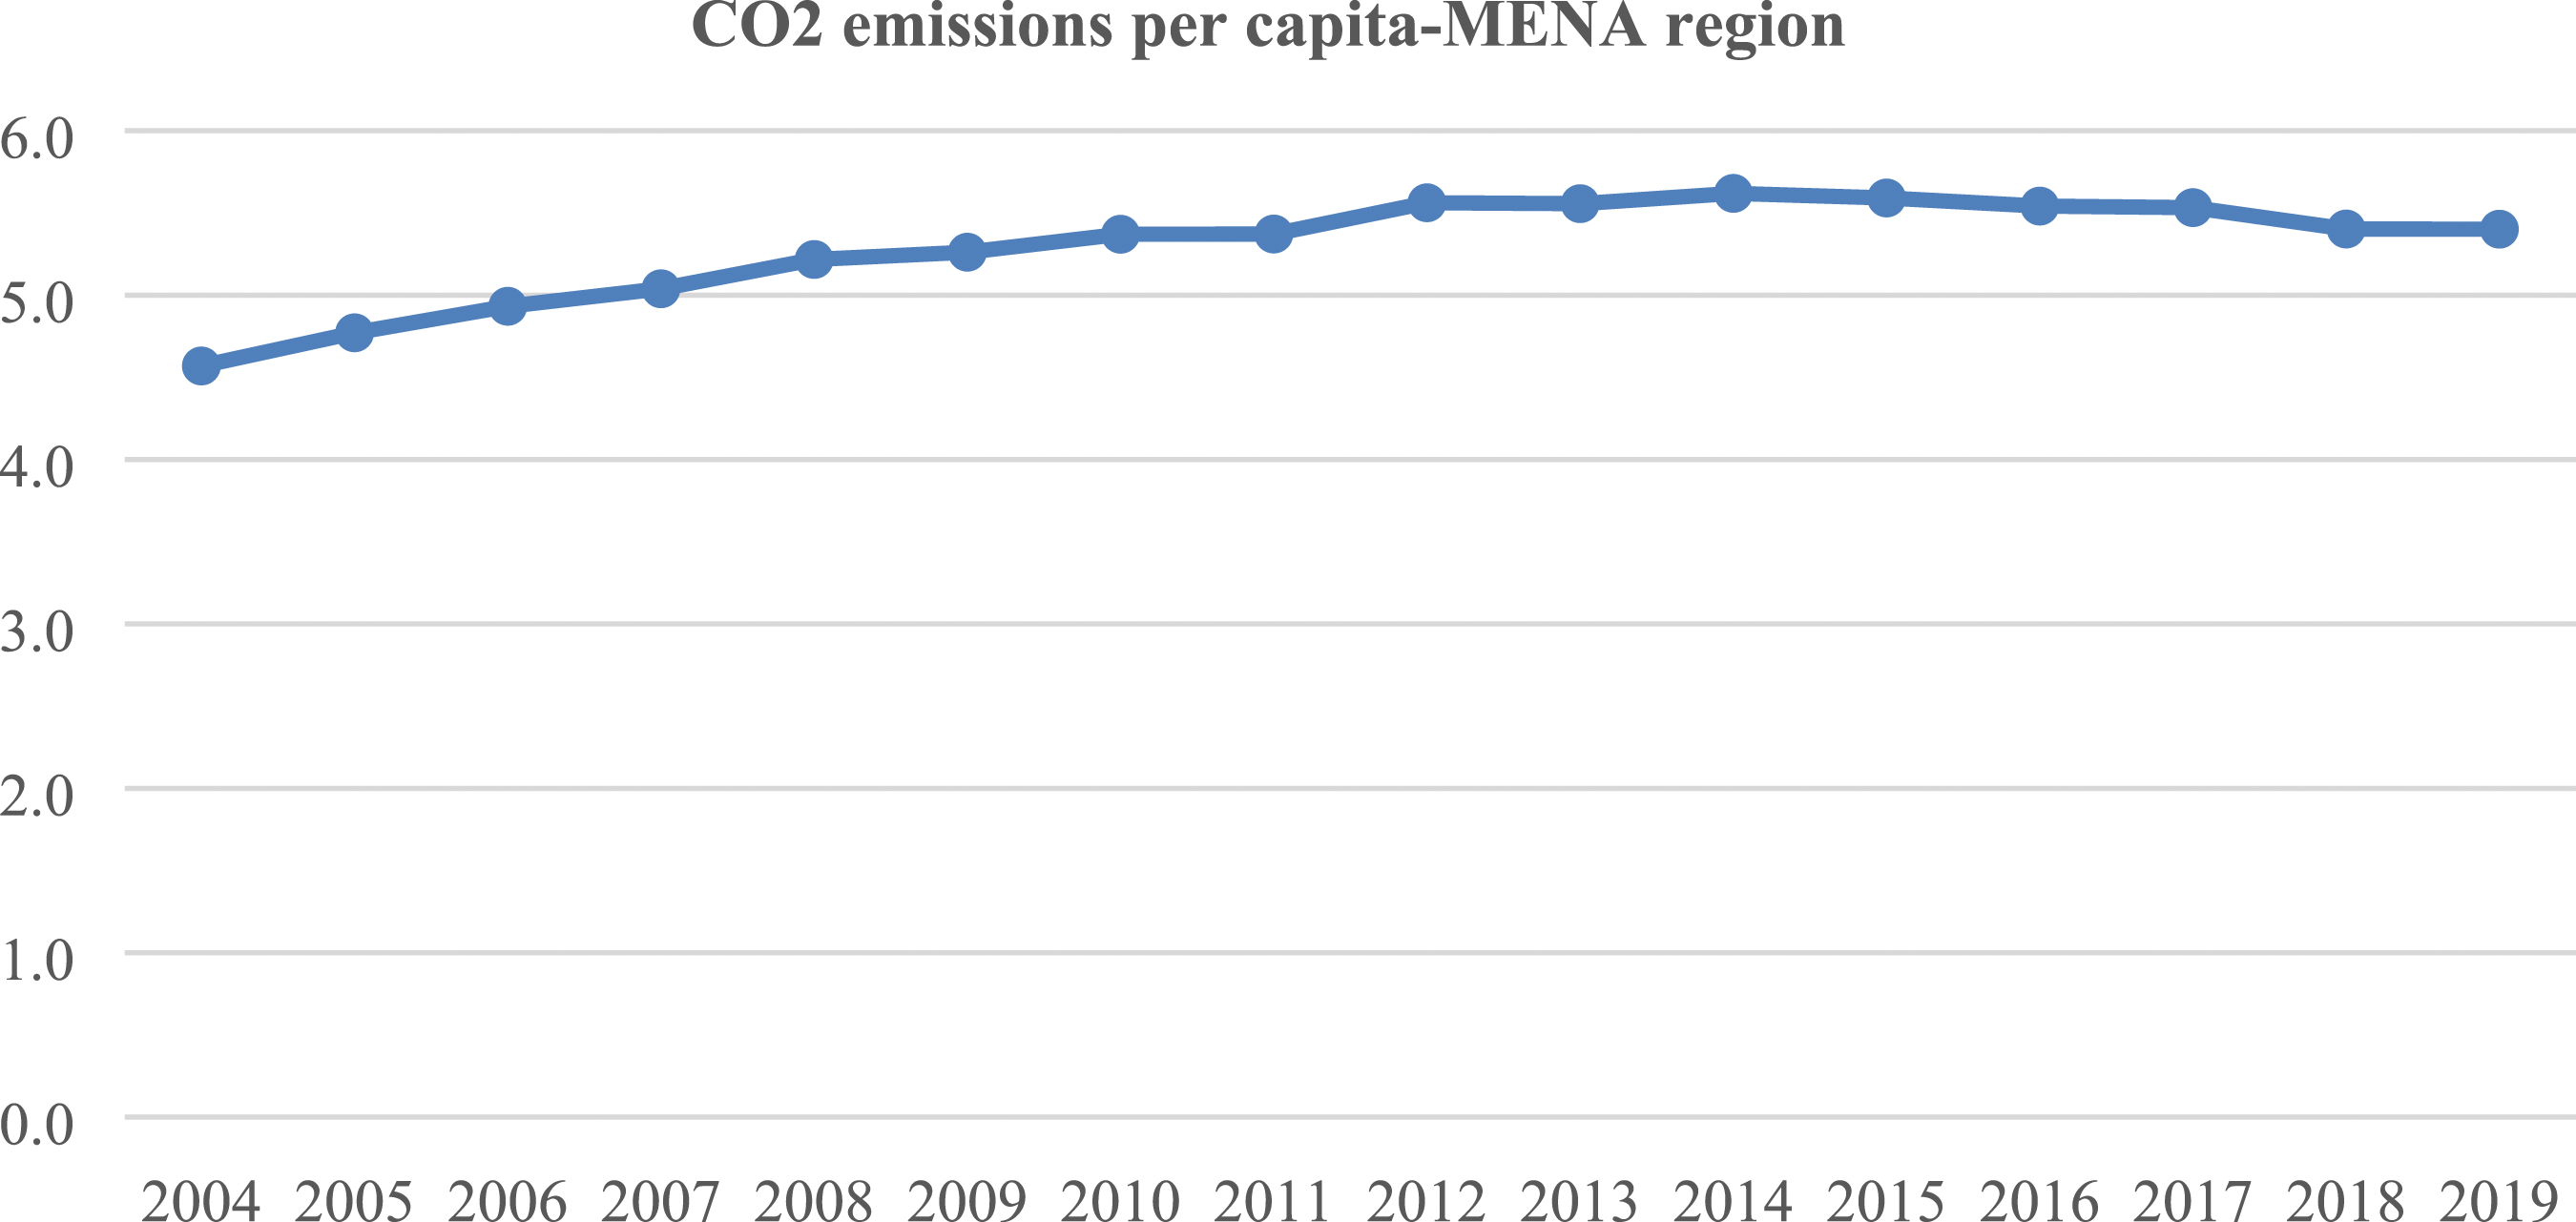
Also, renewable energy production has improved in the MENA region in recent years. According to Belaid et al. (2021), the region’s investment in renewable energy development increased from USD 1.2 billion in 2008 to USD 11 billion in 2016. Jordan, for instance, has approximately 15.7% of installed renewable energy, targeted to increase to 20% by 2025, and a current 6.5% of generated renewable energy. Algeria currently has 10 Megawatts (MW) of wind energy produced, which is expected to increase to 23% of the total energy produced by 2030, and 410 MW of solar energy produced, expected to increase to 62% of the total energy produced by 2030. Renewable energy share in the MENA region is expected to increase to 30% of the total energy produced by 2030. However, MENA is still far behind other parts of the world, which are taking far bigger steps to increase their renewable footprint and phase out the use of fossil fuels (Belaid et al., 2021). Finally, despite various studies examining the link between environmental pollution and renewable energy, it’s rare to find empirical studies examining the influence of financial inclusion in the relationship between renewable energy and CO2 emissions for a panel of MENA countries.
Given the motivation for the study, this paper contributes to the literature in several ways. As far as the authors’ knowledge, this is the first study examining the influence of financial inclusion in the connection between renewable energy and environmental pollution, using a series of econometric techniques such as dynamic ordinary least squares (DOLS), fully modified ordinary least squares (FMOLS), and canonical correlation regression (CCR) techniques, particularly for the MENA region. The empirical findings show that financial inclusion significantly reduces CO2 emissions in the MENA region. The study further concludes that renewable energy contributes significantly to CO2 emission reduction in the region.
Second, the study contributes to the literature by performing a country-specific analysis of the role of financial inclusion in renewable energy-CO2 emissions links. From a policy point of view, the country-specific analysis is warranted because of the variation in financial inclusion, renewable energy, and CO2 emissions among the MENA countries examined. For CO2 emissions alleviation policy design, appropriate policy recommendations could be recommended based on country-specific estimates. The empirical evidence from the country-specific analysis reveals that financial inclusion has a significant negative effect on CO2 emissions for Egypt, Israel, Qatar, and Tunisia, whereas it has a positive effect on CO2 emissions in Algeria, Lebanon, and Saudi Arabia, with no significant effect in Morocco and Turkey. Furthermore, the results show that renewable energy has a significant negative impact on per capita CO2 emissions in Algeria, Lebanon, Tunisia, and Turkey, with no significant impact in Egypt, Israel, Morocco, Qatar, and Saudi Arabia.
The remainder of this paper is structured as follows. Section 2 presents reviews of the existing literature. Section 3 describes the research methodology, data resources, and estimation techniques. Section 4 presents and discusses the main results. Section 5 contains the concluding remarks and policy implications.
Literature Review
Financial Inclusion and CO2 Emissions
This section presents an overview of both theoretical and empirical studies on the link between CO2 emissions and financial inclusion. In theory, there are two main conflicting opinions about the effect of financial inclusion on the environment. The first school of thought contends that financial inclusion could worsen the quality of the environment. Financial inclusion assists economic agents such as households and firms in improving access to financial resources to support their consumption and production activities (Jensen, 1996). For example, financial inclusion could enable households to obtain and consume durable items such as fridges, televisions, and washing machines and enable firms to expand their factories and buy new machinery that consumes a large amount of energy and hence contributing to the rise of CO2 emissions (Le et al., 2020; Zaidi et al., 2021).
Nasir et al. (2019), for example, assess the influence of financial development on environmental degradation utilizing data from 5 ASEAN countries from 1982 to 2014. The empirical findings from different estimation techniques show that financial development contributes to increased environmental degradation. Khan et al. (2019) examine the association between financial development and CO2 emissions by employing seemingly unrelated regression (SUR), three-stage least squares regression, and two-step GMM and two-step system GMM approaches for a sample of 193 countries from 1990 to 2017. The results reveal that financial development decreases CO2 emissions when private credit sector is used as a proxy of financial development, but it decreases CO2 emissions when credit provided by banks is used as a proxy of financial development.
Le et al. (2020) point out that the relationship between financial inclusion and CO2 emissions is positive using a large sample of Asian countries. Fareed et al. (2022) opine that financial inclusion contributes to the increase in CO2 emissions in the Eurozone from 1995 to 2018. Using a panel quantile regression to investigate the relationship between renewable energy consumption, carbon emission, and financial development in a large sample of 192 countries, Khan et al. (2020) indicate that financial development positively influences CO2 emissions while renewable energy negatively affects CO2 emissions. Additionally, Ozturk and Ullah (2022) examine the impact of financial inclusion on CO2 emissions of 42 emerging economies from 2007 to 2019; the empirical results indicate that financial inclusion reduces environmental quality due to the growth of CO2 emissions in these countries. Mehmood (2022), utilizing a cross-sectional autoregressive distributed lag approach (CSARDL), explores the relationship between CO2 emissions and financial inclusion in four South Asian countries from 1990 to 2017. The empirical findings show that financial inclusion increases CO2 emissions. Moreover, Amin et al. (2022) investigated the association between financial inclusion and environmental pollution in South Asia from 1998 to 2019. They reveal that financial inclusion brings about higher CO2 emissions. Singh et al. (2022) indicate that financial inclusion increased CO2 emissions in India from 2008 to 2018. Similarly, Tian and Li (2022) argue that financial inclusion significantly and positively influences CO2 emissions using a sample of G20 economies from 2005 to 2018.
In contrast to the first school of thought, the second school of thought claims that financial inclusion improves the quality of the environment through technological advancements in the energy supply (Tamazian et al., 2009). For instance, using the Bayer–Hanck cointegration test, Umar et al. (2020) investigate the association between financial development and environmental pollution in China. The results reveal that CO2 emissions and financial development are significantly and negatively associated in the long run. Atsu and Adams (2021) investigated the relationship between financial development and CO2 emissions for the BRICS countries (Brazil, Russia, India, China, and South Africa) from 1984 to 2017. Based on cross-sectionally augmented ARDL (CS-ARDL) and Fully Modified Ordinary Least Squares (FMOLS) estimation techniques, the empirical findings indicate that financial development mitigates CO2 emissions. Khan and Ozturk (2021) examine the effects of financial development on CO2 emissions using a sample of 88 countries from 2000 to 2014. Based on five proxies of financial development, the estimated results contend that financial development brings about better environmental quality. Using the augmented mean group (AMG) estimation approach, Usman et al. (2021) contend that financial development helped reduce environmental degradation in 15 emitting countries from 1990 to 2017. Using Pooled Mean Group Autoregressive Distributed Lag (PMG/ARDL) estimator, Baloch et al. (2021) explore the relationship between financial development, economic growth, energy innovation, and environmental pollution for a sample of OECD countries from 1990 to 2017. The results indicate that financial development promotes energy innovation and improves environmental quality.
Overview of Related Literature Published.
Renewable energy and CO2 Emissions
The research on the link between renewable energy and CO2 emissions is key because it helps policymakers gain further insights into attaining Sustainable Development Goals (SDGs). The effect of renewable energy on environmental quality is becoming a fundamental question in the current energy economic literature. Several countries have implemented strategies to boost their renewable energy share in the total energy mix. For example, ASEAN countries have been increasing their renewable energy share by investing in various renewable energy sources such as geothermal, biomass, solar, wind, and hydroelectric (Fahim et al., 2023a). The ASEAN has enacted regulations and incentives to stimulate businesses and individuals to adopt renewable energy in the future (Fahim et al., 2023a). The expansions in renewable energy sources are aimed at hastening the transition towards a low-carbon economy.
The empirical literature on how renewable sources affect CO2 emissions can be divided into three key streams. The first stream states that renewable energy has a mitigation effect on CO2 emissions. Using fully modified ordinary least square (FMOLS) and dynamic ordinary least square (DOLS) models for estimation with annual data from the years 1990 to 2019, Jamil et al. (2022) show that there is a significant and negative connection between renewable energy and CO2 emissions in the context of G-20 countries. Aydoğan and Vardar (2020) assess the impact of renewable energy on CO2 emissions for seven emerging economies, namely, Brazil, China, India, Indonesia, Mexico, Russia, and Turkey over the period 1990–2014 and a negative relationship is found between CO2 emissions and renewable energy consumption. Using data from top ten renewable energy nations, Wang et al. (2021) explore the relationship between renewable energy and CO2 emissions. Long-run estimates indicate that renewable energy consumption leads to lessening CO2 emissions. Employing the dynamic Autoregressive Distributed Lag (ARDL) model to examine the relationship between renewable energy and CO2 emissions from 1980 to 2018, Abbasi et al. (2021) show that renewable energy has a negative and statistically significant impact on CO2 emissions. Using a two-step GMM estimator for top carbon-intense countries over the period 2000–2015, Mirziyoyeva and Salahodjaev (2022) show that renewable energy has a significant negative effect on CO2 emissions. Salahodjaev et al. (2022) investigate the relationship between renewable energy and CO2 emissions in Europe and Central Asia countries over the period 1990–2015; the results indicate that renewable energy has a negative and statistically significant impact on CO2 emissions. For instance, when renewable production increases by 10 percentage points, CO2 per capita emissions are reduced by 4.1%.
The second stream of empirical studies contends that renewable energy worsens CO2 emissions. For instance, Bulut (2017) explores the effect of renewable energy on CO2 emissions in Turkey. The author shows that CO2 emissions and renewable energy are positively associated. In addition, using a panel cointegration analysis of 107 countries from 1990 to 2013, Nguyen and Kakinaka (2019) show that renewable energy consumption is positively and significantly associated with CO2 emissions in low-income countries.
Overview of Related Literature Published.
Literature Gaps
By reviewing the literature related to financial inclusion, energy renewable consumption, and CO2 emissions, although many authors have focused on the impact of financial inclusion on the environment, some academic gaps are still in place. First, while the previous literature investigates the association between finance and environmental pollution in different regions/countries across the globe, very few studies have investigated this association in the MENA region. Second, previous studies have often examined the panel effects of financial inclusion and renewable energy on CO2 emissions. However, the main aim of this study is not only to focus on the relationships between financial inclusion, renewable energy, and CO2 emissions as a panel but also to uncover a country-specific analysis across several countries in the MENA region. This paper fills the gaps and explores the connection between financial inclusion, renewable energy, and environmental pollution across 11 MENA countries.
Model Specification, Data Resources, and Estimation Techniques
Model Specification
The main objective of this study is to investigate the effects of financial inclusion and renewable energy on CO2 emissions. This study uses an empirical model specified in equation (1). This empirical model is consistent with the models employed in the preceding literature (Le et al., 2020; Liu et al., 2022; Shahbaz et al., 2022).
where lnco
2
is the natural logarithm of CO2 emissions per capita; fi denotes the natural logarithm of financial inclusion; lnre is the natural logarithm of renewable energy consumption (% of total final energy consumption); lngdppc stands for the natural logarithm of GDP per capita; lnto is the natural logarithm of trade openness (% of GDP); θ1 is a constant parameter; and
Definitions of Variables, Data Sources, and Statistical Descriptions.
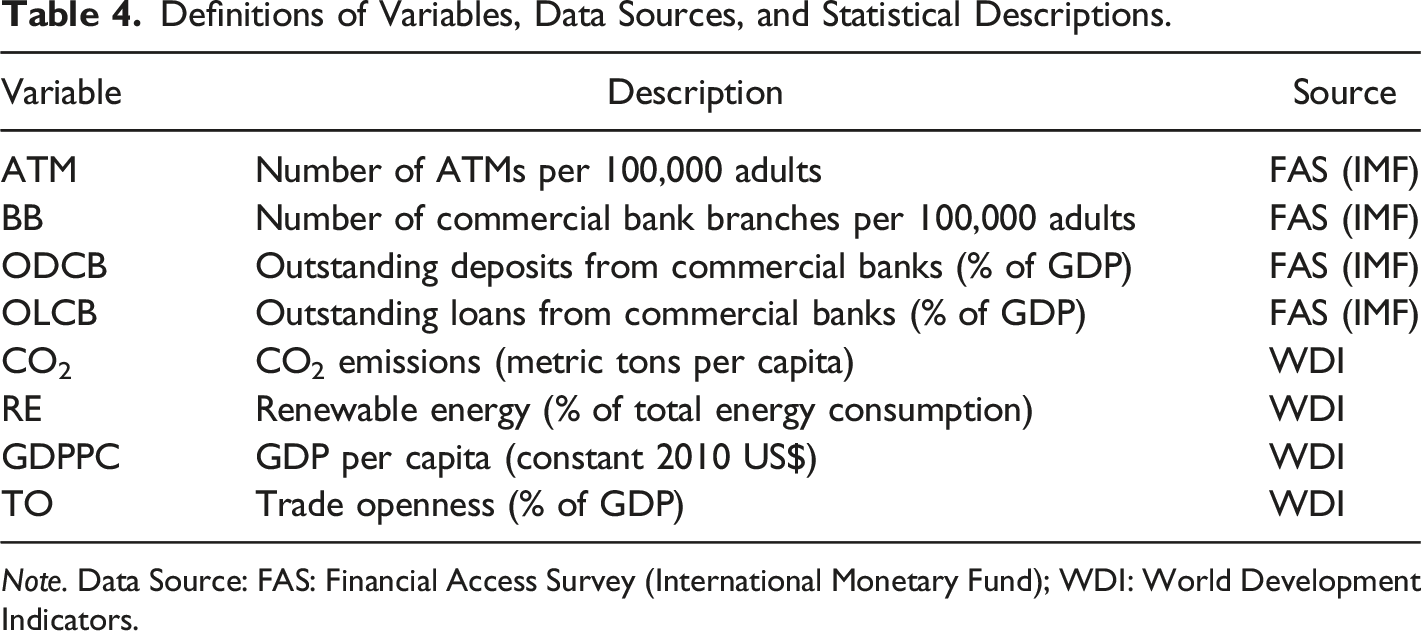
Note. Data Source: FAS: Financial Access Survey (International Monetary Fund); WDI: World Development Indicators.
This study considers the following four aspects in obtaining a composite Financial Inclusion Index (FI): (1) number of ATMs per 10,000 adults, (2) number of commercial bank branches per 10,000 adults, (3) outstanding deposits from commercial banks (% of GDP), and (4) outstanding loans from commercial banks (% of GDP). Since these aspects are measured in different units and scales, they need to be normalized before turning them into the composite index FI (Le et al., 2020). Thus, this study normalizes the variables using a z-score approach as described below.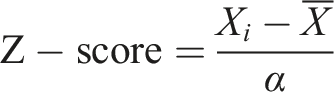
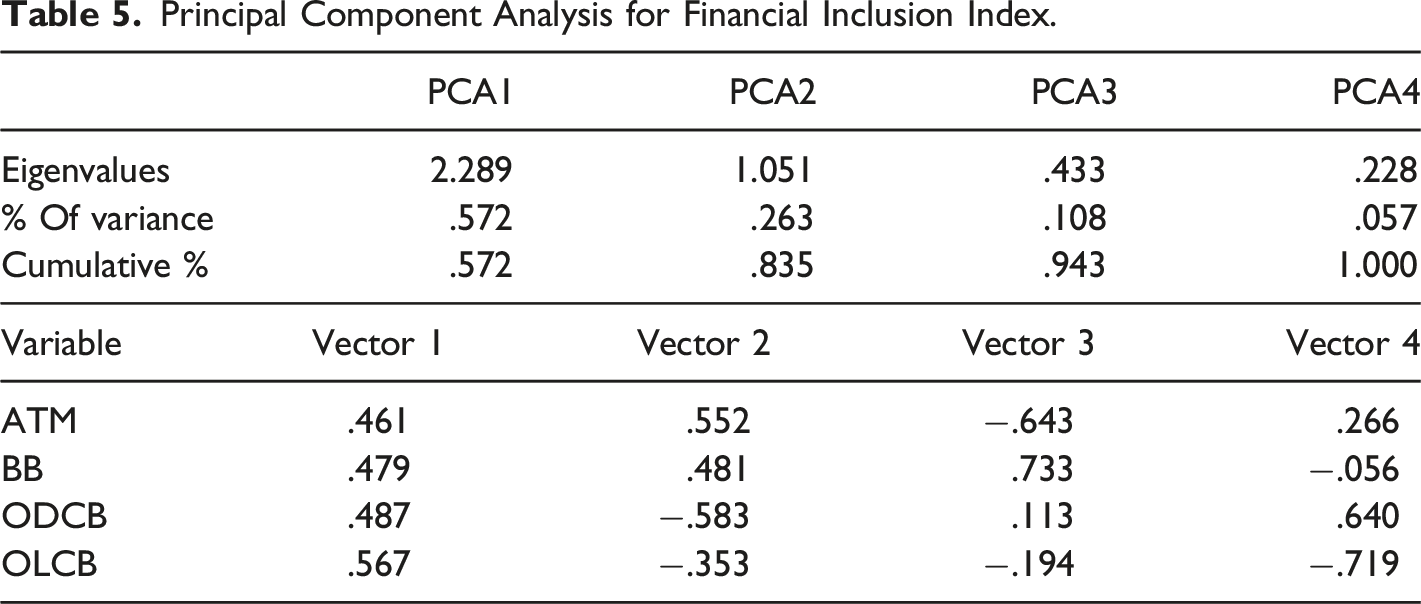
Principal Component Analysis for Financial Inclusion Index.
Estimation Techniques
Cross-Sectional Dependence
Pesaran’s (2004) CD Test for Cross-Section Independence in Macro Panel Data.
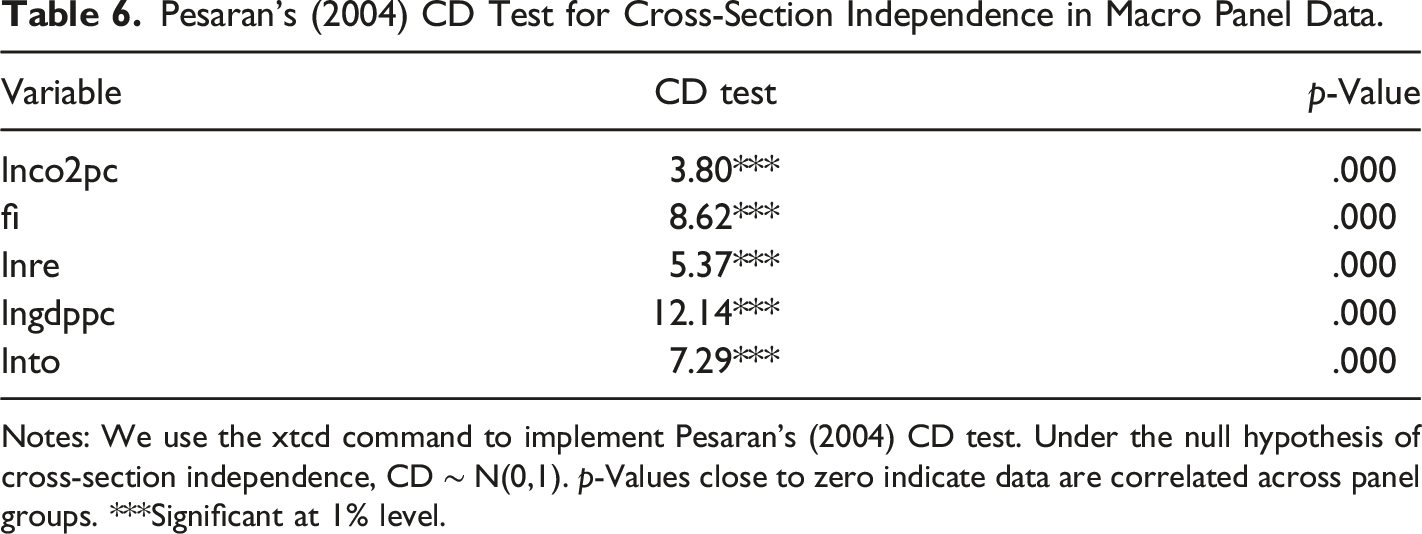
Notes: We use the xtcd command to implement Pesaran’s (2004) CD test. Under the null hypothesis of cross-section independence, CD ∼ N(0,1). p-Values close to zero indicate data are correlated across panel groups. ***Significant at 1% level.
Panel Unit Root Tests
Pesaran’s Simple Panel Unit Root Test in the Presence of Cross-Section Dependence.
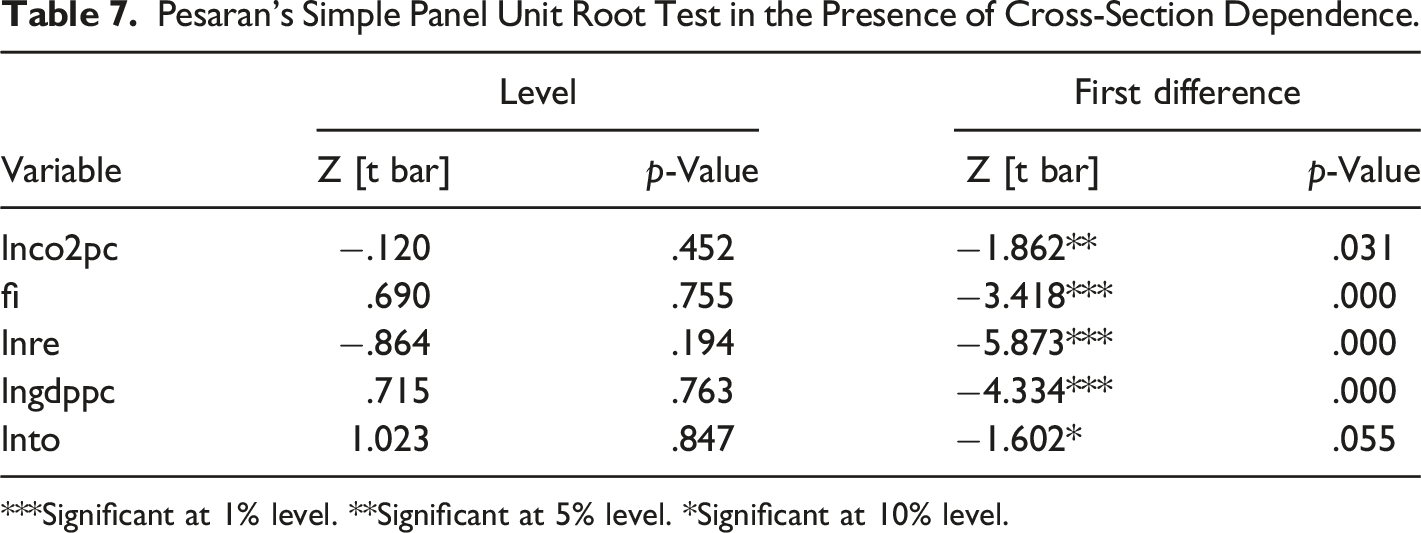
***Significant at 1% level. **Significant at 5% level. *Significant at 10% level.
Panel Cointegration Test
Cointegration Tests.
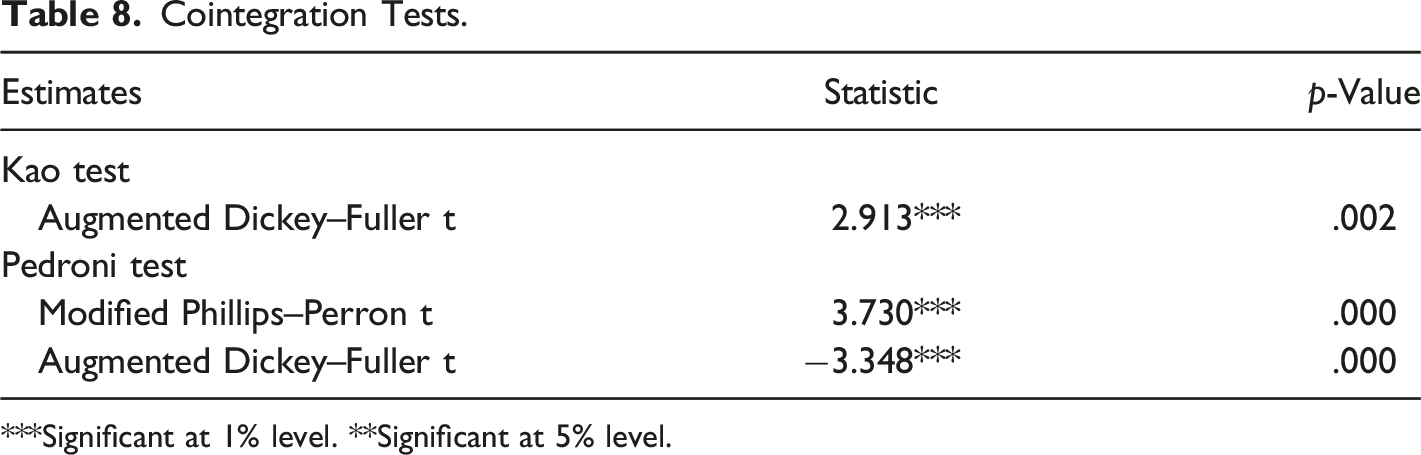
***Significant at 1% level. **Significant at 5% level.
Estimation of Long-Run Coefficients
The long-term estimates confirm the existence of a cointegration relationship between the series. This study employs four different estimators: FE-OLS, D-OLS, FM-OLS, and CCR. We first employ the FE-OLS estimator since our data has evidence of cross-sectional dependence. In the case of cross-sectional dependence, Driscoll and Kraay’s (1998) standard errors are well-calibrated. Moreover, this statistical technique is robust to autocorrelation, heterogeneity, and cross-sectional dependence (see Le et al., 2020). We also use DOLS, a parametric estimator that addresses autocorrelation. Moreover, DOLS is also relevant to a small data series, allows for combining different variables in the analysis, and has several advantages in estimating cointegrated vectors (Liguo et al., 2022). Compared to OLS, the FMOLS estimator computes long-run coefficients by adjusting the conventional OLS. It addresses serial correlation and endogeneity issues generally occurring when utilizing the conventional OLS technique (Jiang et al., 2021; Yawen et al., 2021). Furthermore, FMOLS allows for possible association among error terms, constant terms, and the difference among regressors (Christiansen, 2015). In addition to DOLS and FMOLS, CCR uses a stationary conversion method to overcome a long-run interaction between stochastic regressor errors and the cointegration equation (Christiansen, 2015).
Empirical Results
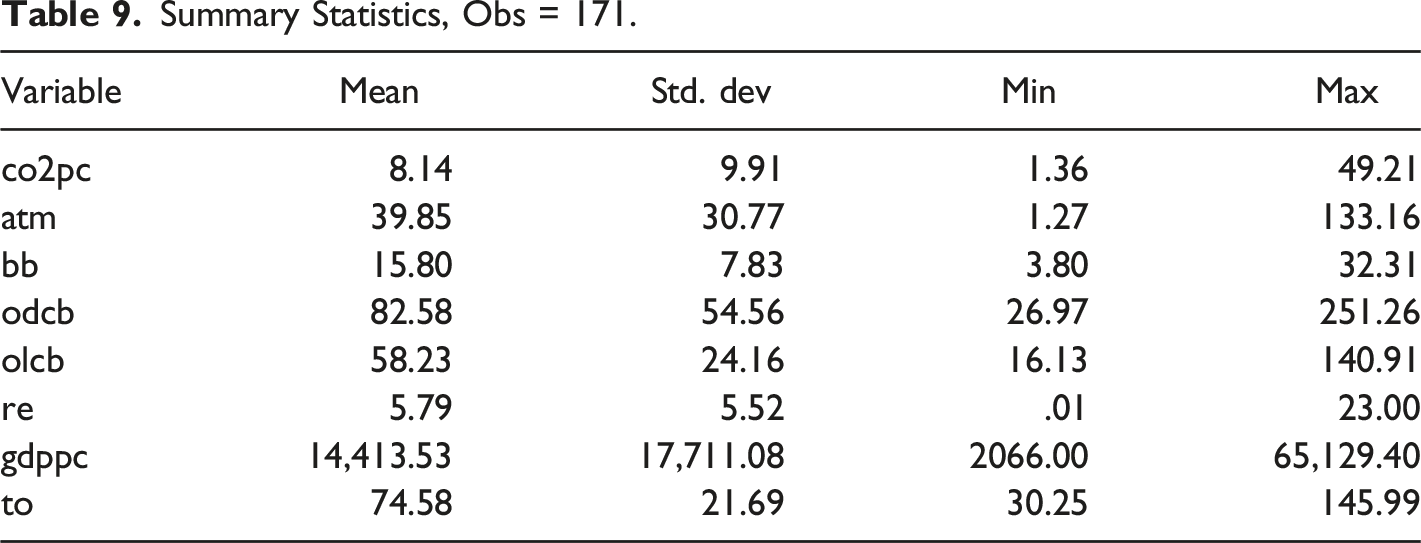
Summary Statistics, Obs = 171.
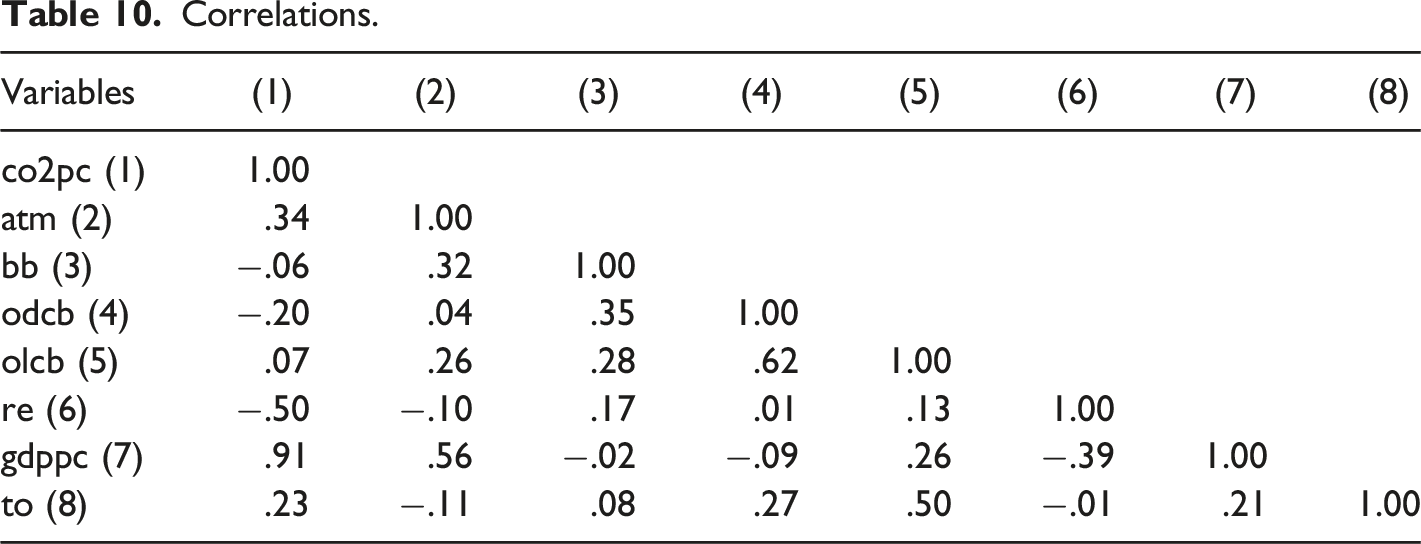
Correlations.
Panel Estimation Results.
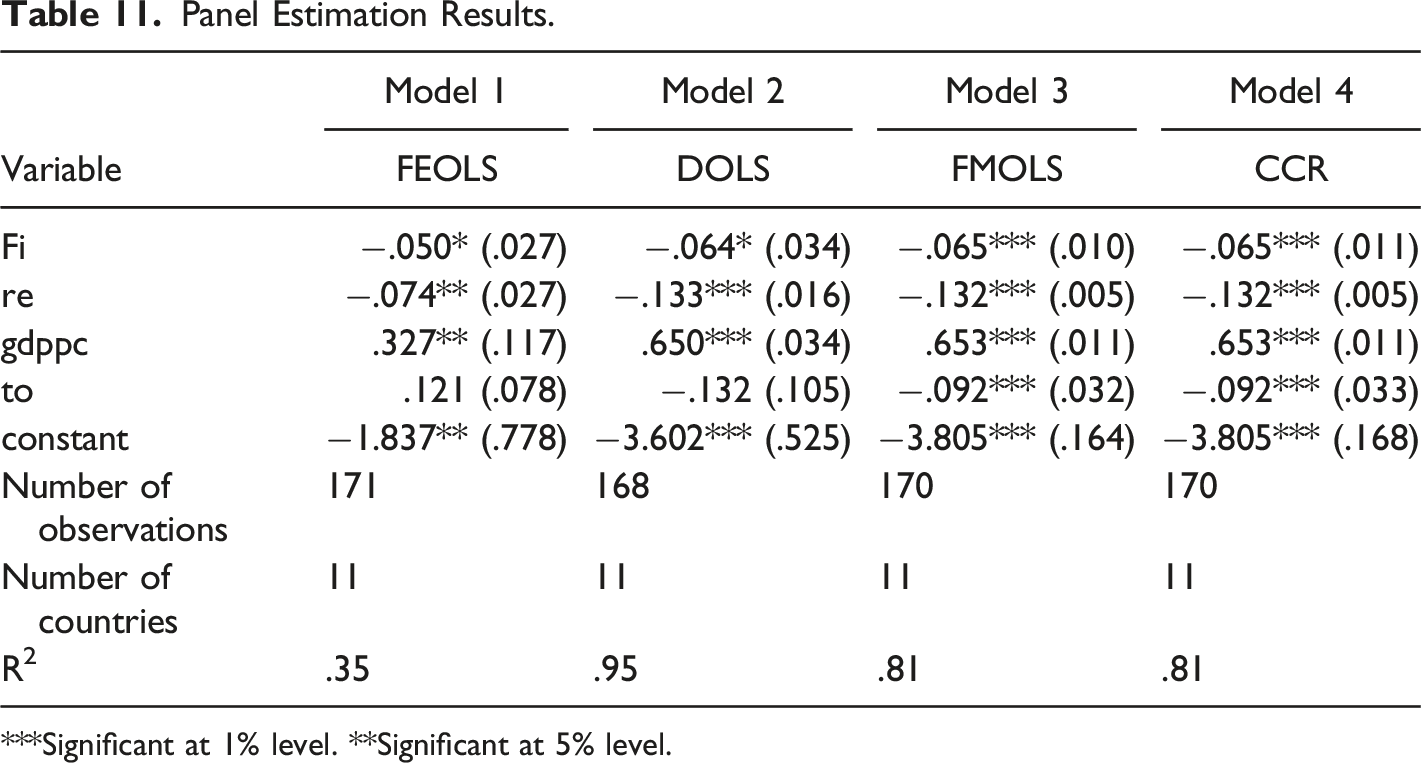
***Significant at 1% level. **Significant at 5% level.
Country-Specific Estimates. 8
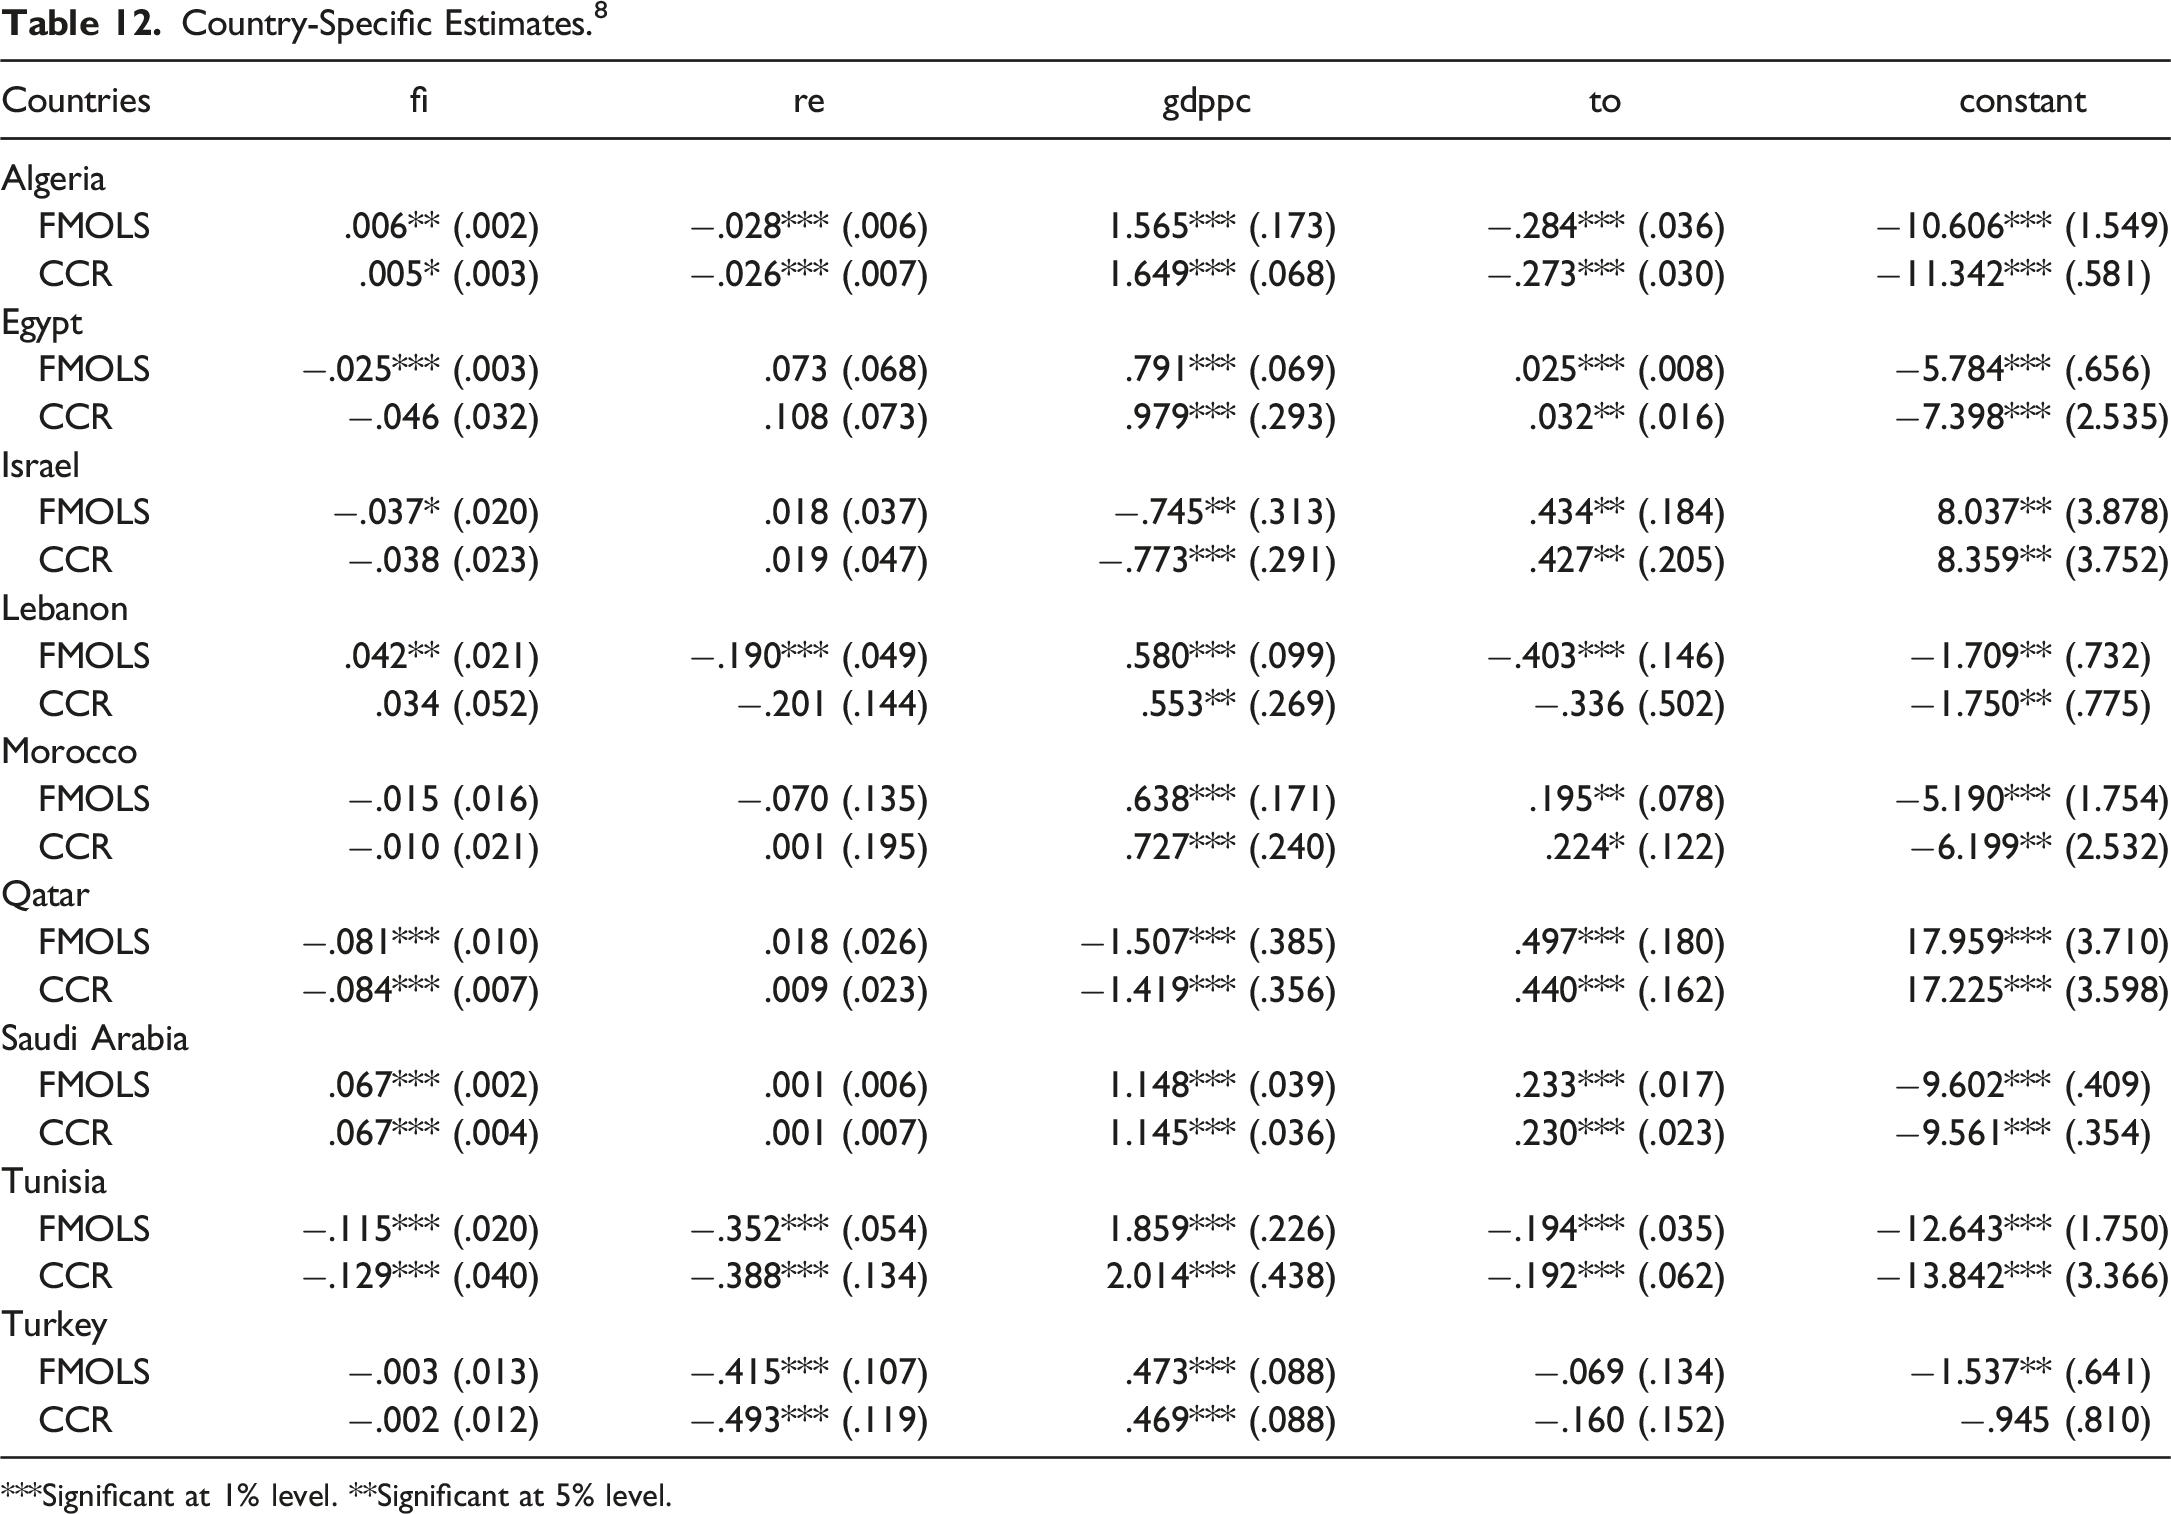
***Significant at 1% level. **Significant at 5% level.
The correlations between the study variables of interest, namely, financial inclusion (ATM, BB, ODCB, and OLCB), renewable energy, economic growth, and trade openness, are reported in Table 10. The first observation is that there is a positive correlation between CO2 emissions and the different variables (ATM, GDPPC, and TO). There is also a negative correlation between CO2 emissions and renewable energy (−.50). Finally, a negative connection between GDPPC and renewable energy of −.39 has been shown.
It is interesting to mention that the results are quite robust under different specifications. Table 11 displays the panel estimations’ results, including those of the FE-OLS, D-OLS, FM-OLS, and CCR. The results indicate that financial inclusion is negatively and significantly associated with CO2 emissions in all specifications. Specifically, a 1% increase in financial inclusion decreases CO2 emissions per capita within a range of .05%–.065%. These results are in line with the findings of Du et al. (2022); Liu et al. (2022); and Shahbaz et al. (2022), which indicate a significant negative relationship between financial inclusion and CO2 emissions. However, our results do not agree with the findings of Amin et al. (2022); Dong et al. (2022); and Fareed et al. (2022), which argue that financial inclusion and CO2 emissions are positively and significantly related. The results further indicate that renewable energy is negative and significant at a 1% significance level in all specifications. A 1% increase in renewable energy reduces CO2 emissions per capita within a range of .074%–.133%. This finding aligns with previous literature, which indicates that renewable energy decreases CO2 emissions (Abbasi et al., 2021; Jamil et al., 2022). As shown in all Models of Table 10, the coefficients of GDP per capita have significant positive effects on CO2 emissions.
Table 12 6 exhibits the empirical results across countries using FM-OLS and CCR estimators. 7 As shown in Table 12, the relationship between financial inclusion, renewable energy, and CO2 emissions differs across countries. The results show that the relationship between financial inclusion and CO2 emissions is negative and significant for Egypt, Israel, Qatar, and Tunisia. This implies that a 1% increase in financial inclusion reduces CO2 emissions within a range of .025% (Egypt), .037% (Israel), .081%–.084% (Qatar), and .115%–.129% (Tunisia). However, the results show that this relationship is positive and significant for Algeria, Lebanon, and Saudi Arabia. A 1% increase in financial inclusion increases CO2 emissions within a range of .005%–.006% (Algeria), .042% (Lebanon), and .067% (Saudi Arabia). For the remaining countries, no significant link is found. In addition, renewable energy negatively impacts per capita CO2 emissions for four (4) countries out of nine. Only for Algeria, Lebanon, Tunisia, and Turkey, renewable energy negatively affects CO2 emissions. A 1% increase in renewable energy consumption leads to a decrease in CO2 emissions within a range of .026%–.028% (Algeria), .190% (Lebanon), .352%–.388% (Tunisia), and .415%–.493% (Turkey). For the remaining countries, no significant relationship is found. In addition, the results indicate that GDP per capita has a significant positive effect on CO2 emissions in all countries except for Israel and Qatar, which shows that the relationship between income and CO2 emissions is negatively and significantly related. Lastly, the coefficient of trade openness is positive and significant in five countries out of nine. A 1% increase in trade openness increases CO2 emissions within a range of .025%–.032% (Egypt), .427%–.434% (Israel), .195%–.244% (Morocco), .440%–.497% (Qatar), and .230%–.233% (Saudi Arabia). However, the results show that the relationship is negative and significant in three countries out of nine. A 1% increase in trade openness decreases CO2 emissions within a range of .273%–.284% (Algeria), .403% (Lebanon), and .192%–.194% (Tunisia).
Conclusion and Policy Implications
This study is probably the first to empirically explore the association between financial inclusion, renewable energy, and CO2 emissions for a panel dataset of 11 MENA countries from 2004 to 2019. It specifically answers the following questions: (1) How does financial inclusion affect the environment in the MENA region? (2) Does the effect of financial inclusion on the environment vary across MENA countries? (3) Does renewable energy negatively impact the environment in the MENA region as a panel? (4) Does the relationship between renewable energy and CO 2 emissions vary across MENA countries?
The empirical findings from the different estimation techniques, such as FEOLS, DOLS, FMOLS, and CCR, documented that financial inclusion is negatively and significantly associated with CO2 emissions, implying that boosting financial inclusion supports environmental sustainability. More specifically, a 1% increase in financial inclusion can reduce CO2 emissions within a range of .05%–.065%. However, the relationship between financial inclusion and CO2 emissions differs across countries in the MENA region. This study finds that the relationship is negative and significant for Egypt, Israel, Qatar, and Tunisia; positive and significant for Algeria, Lebanon, and Saudi Arabia; and insignificant for Morocco and Turkey. Obtaining the unfavorable environmental impact of financial inclusion for some MENA countries such as Algeria, Lebanon, and Saudi Arabia certainly does not suggest reducing financial inclusion. Instead, it is in the interest of MENA countries to strengthen their financial inclusivity to accomplish improved environmental quality. In this regard, policymakers should design appropriate financially inclusive policies for economic and environmental welfare. Incentives should be offered to businesses and entrepreneurs for participating in green financial practices and products that may help develop cleaner energy technologies.
Furthermore, the results indicate that renewable energy has a significant negative impact on CO2 emissions. Specifically, a 1% increase in renewable energy can reduce CO2 emissions within a range of .074%–.133%. However, the relationship between CO2 emissions and renewable energy varies across countries in the region. For instance, this study indicates that renewable energy has a significant negative effect in Algeria, Lebanon, Tunisia, and Turkey, while it has an insignificant effect for the remaining countries. Policymakers should use various incentives to promote the growth of the renewable energy sector, such as low-interest loans, grants, subsidies, and tax deductions for renewable energy investments to increase renewable energy penetration. Furthermore, enhancing energy efficiency through infrastructure investments in the energy sector by substituting obsolete technologies and facilities will diminish demand for fossil fuels (Akalin et al., 2021), reducing CO2 emissions. Also, in line with Fahim et al.’s (2023b) recommendations, policymakers should integrate more renewables into economic load dispatch.
This research could be extended in several ways. First, prospective studies could explore the relationship between financial inclusion, renewable energy, and CO2 emissions by focusing on individual countries in other regions. This would allow policymakers to consider each country’s characteristics in the design of country-specific policy actions. Second, the broad definition of financial inclusion allows for measurement approaches beyond the proxy used in this study. Finally, future research could also explore whether financial inclusion indirectly affects CO2 emissions via economic growth or whether an increase in economic growth accelerates the use of financial inclusion by population and companies.
Footnotes
Acknowledgments
The authors sincerely thank the Editor-in-Chief and the Associate Editors for their support. We are also grateful to the two anonymous reviewers for their valuable comments that helped improve this paper’s quality. Nevertheless, the authors are responsible for all remaining errors.
Declaration of Conflicting Interests
The author(s) declared no potential conflicts of interest with respect to the research, authorship, and/or publication of this article.
Funding
The author(s) received no financial support for the research, authorship, and/or publication of this article.
Notes
Appendix
Sample Composition.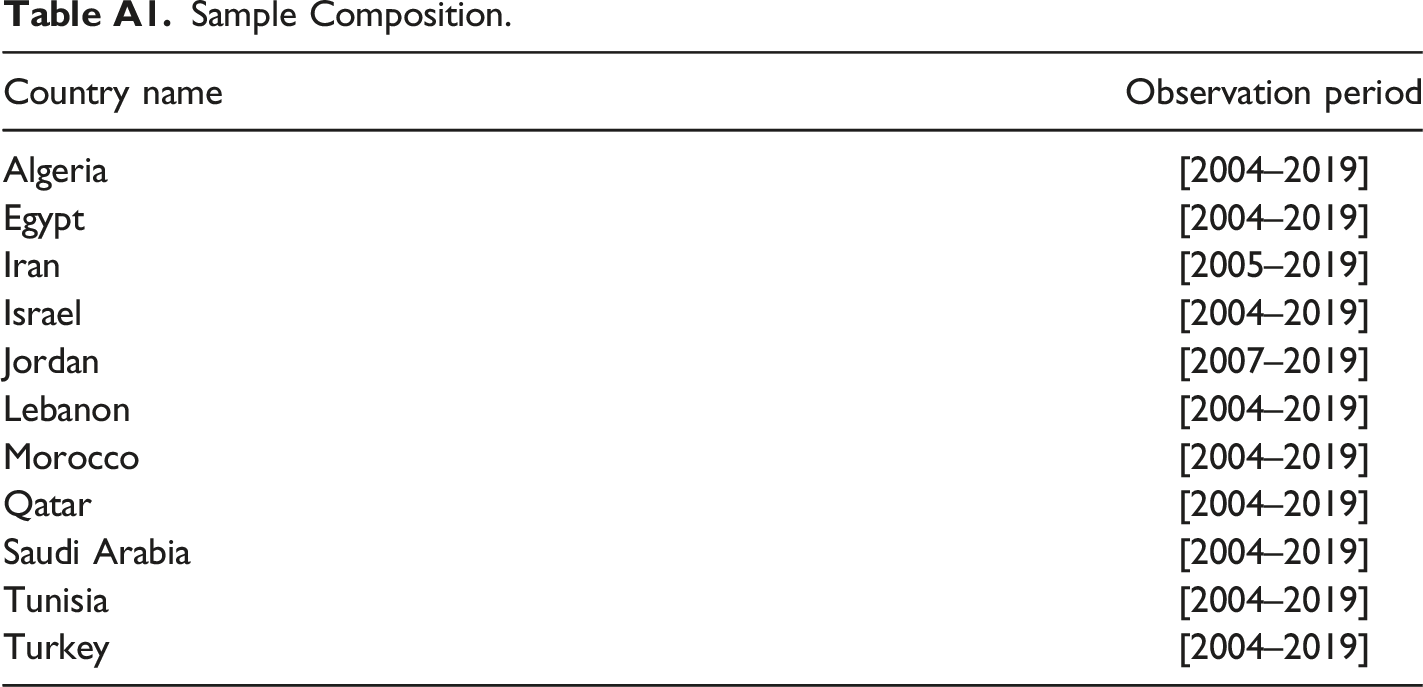
Country name
Observation period
Algeria
[2004–2019]
Egypt
[2004–2019]
Iran
[2005–2019]
Israel
[2004–2019]
Jordan
[2007–2019]
Lebanon
[2004–2019]
Morocco
[2004–2019]
Qatar
[2004–2019]
Saudi Arabia
[2004–2019]
Tunisia
[2004–2019]
Turkey
[2004–2019]