
Abstract
We compare efficiency-enhancing cooperation and its underlying motives in Iceland and the US. The two countries are distinct along all measures of national culture known to us. They are however both developed democracies with similar GDP/capita (PPP adjusted). These similarities make it possible to hold constant aspects of culture related to wealth and institutions. In an experimental Voluntary Contribution Mechanism (VCM), we prime the participants with different social foci, emphasizing either their directly cooperating team or their wider social unit. With a team focus, cooperation levels do not differ between the two cultures, but this superficial similarity masks deep-seated differences: When the focus is on the wider social unit cooperation increases in Iceland and declines in the US. Both when the contribution levels are the same and when they differ, members of the two cultures differ in their motives to cooperate: Icelanders tend to cooperate unconditionally, and US subjects conditionally with a strong emphasis on reciprocity. Our findings indicate that different cultures can achieve similar economic and societal performance through different cultural norms and suggest that cooperation should be encouraged through culturally tailored persuasion tactics.
Keywords
Introduction
Cultural Economics
Standard neoclassical economics has not addressed the impact of culture on economic performance. In recent years however, awareness of cultural differences that give rise to diverse values and preferences has made inroads into economics and has enriched the accounts of the differences in economic performance observed around the globe. In this paper, we experimentally compare, across two distinct cultures, cooperation levels and their underlying motives. We select two established Western democracies with developed market economies, the US and Iceland, whose per capita GDP (PPP adjusted) is very close (OECD, 2020; World Bank, 2019). Their superficial commonalities remove confounds associated with the economic and political environment such as familiarity with a market economy or wealth, which have been tied to aspects of culture such as reciprocity or self-expression (Henrich & Ensminger, 2014; Inglehart & Welzel, 2005). Similarities in their institutions and welfare levels notwithstanding, the two countries differ significantly along all established survey-based measures of national culture. A comparison between these two countries allows factoring out the more fluid market-and welfare-related aspects of culture and identify slow-moving aspects of culture driven by history, demographics, and possibly, geography. 1 The cooperation levels and efficiency achieved by subjects in both countries are superficially similar but digging deeper we find differences in the motives to cooperate, and consequently, in the response to social primes. Our results show that different cultural mindsets can underlie similar levels of economic and societal performance and point to the importance of culturally tailored messages to encourage cooperation.
We define culture in a manner that emphasizes its persistent aspects, as “a set of customary beliefs and values that ethnic, religious, and social groups transmit fairly unchanged from generation to generation” (Guiso et al., 2006, p. 23). Constrained by the human genetic makeup and cultural group selection, it gives rise to diversity in values and behavior across geography and history (Cronk, 1999; Soltis et al., 1995). Passed on within the family or community, it shapes a specific set of internalized norms and preferences, lenses through which the world is interpreted, and thoughts and feelings about what one experiences or observes (Cavalli-Sforza & Feldman, 1981; Cronk, 1999; Fernández, 2008; Henrich & Ensminger, 2014; Storr & John, 2019; Tabellini, 2010).
Since culture influences how individuals process interpersonal exchange it impacts social capital (Coleman, 1988; Fukuyama, 2001; Guiso et al., 2004) and is an indirect determinant of economic performance at the macro level (Gershman, 2017). 2 For example, norms of generalized trust and trustworthiness reduce transaction costs (Coleman), and many transactions are outright impossible without broad norms of honesty and reciprocity (Banfield, 1958; Putnam et al., 1993; Tabellini, 2010). Similarly, strong norms of voluntary cooperation make a social unit cohesive and competitive (Ostrom, 1990; Torgler, 2004).
Measuring Culture with Surveys and Experiments
National culture is often assessed via international surveys of values and norms such as the World Values Survey (WVS) or the European Values Survey (EVS). Readers are probably familiar with survey-based quantifications of culture such as Inglehart’s cultural map (Inglehart & Baker, 2000) or Hofstede’s (2001) cultural dimensions. Economists often know Knack and Keefer’s (1997) index of national civic attitude. Other established scales include GLOBE (House et al., 2004), Schwartz Values (Schwartz, 1992), and Group-Grid Cultural Theory (Douglas & Wildavsky, 1983). Recently, simple, widely used experimental economics paradigms have been proposed as complements or even alternatives to these survey-based measures, especially for the comparison of narrowly delineated aspects of culture such as levels of trust, reciprocity, perceptions of fairness, and willingness to cooperate voluntarily around the provision of public goods and team goods (Chai et al., 2009; Gershman, 2017; Guiso et al., 2006; Henrich & Ensminger, 2014; Thöni, 2019).
In economics experiments, all participants anonymously play the same, easy to grasp, context-free game, and have cross-culturally comparable monetary incentives. 3 This way, the experimental environment is stripped of the reputational pressures that often constrain behavior and constrain it differently across different cultures. Cross-cultural experiments thus greatly reduce social desirability effects and reveal culture-specific internalized norms.
Since culture is a mindset, cultural differences translate into behavioral differences only indirectly (Cronk, 1999, p. XI). If members of different cultures behave similarly it can be because they view a specific aspect of the world in the same way, or because they behave seemingly the same but are driven by culturally different motives. This might undermine the role of cross-cultural experiments which, after all, compare observed behavior. Experimental cross-cultural comparison is however not limited to behavioral comparison. It is possible to dig deeper and econometrically analyze decision factors, motives, and values deeply or even unconsciously held that underlie the observed choices. An econometric comparison of decision processes across cultures is to the best of our knowledge a new approach. 4 We use it here to compare the motives for voluntary cooperation around the provision of public goods. We next discuss the role of such voluntary cooperation for a social unit’s success. This is followed by a description of how experiments help assess the willingness to cooperate voluntarily.
Voluntary Public Goods Provision, Cooperation, and Welfare
Public goods produced through voluntary cooperation are widespread, important, and diverse. 5 They include for example the quality of the environment and other shared resources (Hardin, 1968), tax revenue (Camerer, 2003, p. 46), public safety and order, or defense. A rationally self-interested actor does not voluntarily contribute to a public good but “snatches a selfish benefit” (Samuelson, 1954, p. 389) from others’ contributions. A culture’s ability to instill norms that curb such selfishness is a significant determinant of its effectiveness, the welfare of its members, and even its long-term survival (Ahn & Ostrom, 2008; Boyd & Richerson, 1985, 2002; Knack & Keefer, 1997, pp. 27–29; Soltis et al., 1995). A large body of field observations (e.g., Ostrom, 1990) has generated a rich set of hypotheses about which aspects of culture help or hinder voluntary cooperation. Laboratory experiments with the Voluntary Contribution Mechanism (VCM) allow testing these hypotheses under controlled conditions.
The Voluntary Contribution Mechanism
The VCM’s (Isaac et al., 1985) simplicity and versatility have made it the work horse to examine voluntary cooperation experimentally. 6 We describe the most common version of the game, used in this paper.
There are
If
A Typical VCM Experiment
Groups of size
Stylized VCM Results from Western University Students
The overwhelming majority of VCM experiments has been conducted with university students in Western industrialized countries. These studies have produced three robust results (Davis & Holt, 1993; Ledyard, 1995; Zelmer, 2003). 1. Cooperation levels exceed the dominant strategy equilibrium of non-contribution by all. In the first round, the mean contribution is about 2. Over repeated rounds, mean contributions gradually approach the equilibrium. The decay is mainly because those who initially contributed get discouraged by free riders in their midst (Gunnthorsdottir et al., 2007; Page et al., 2005). 3. There is substantial variability in the contributions, especially in the early rounds (Gunnthorsdottir et al., 2007; Isaac et al., 1984; Kurzban & Houser, 2005).
Cross-Cultural VCM Experiments
Recently, experiments with participants from outside the common subject pools have indicated that the seemingly robust findings from VCM experiments reflect not human universals but rather, a unique culture: Across history and geography, Western university students are outliers in lifestyle and values. In an extensive discussion, Henrich et al. (2010) label these subjects as WEIRD (Western, Educated, Industrialized, Rich, Democratic). Outside Western universities and even between WEIRD subject pools, substantial cultural differences have since been discovered for example in the perception of what is fair, willingness to punish transgressors, and in the levels of voluntary cooperation (Henrich et al., 2001, 2005; Herrmann et al., 2008).
Cross-cultural economics experiments have often been exploratory, with the choice of subjects determined by researchers’ access to them. They often simply aimed to check whether cultural differences existed, without prior directional hypotheses. There are exceptions, mostly for the Ultimatum Game,
10
and to a lesser extent also for the VCM. The most prominent deductive approach to cultural differences in experimental games is arguably the Market Integration Hypothesis which suggests that a society’s economic practices shape its values and norms (see In Ensminger & Henrich, 2014, for an overview; see also Chen & Tang, 2009; Gurven, 2004; Henrich et al., 2005, p. 811). We next provide a brief overview of cross-cultural VCM studies whose results can be summarized as follows: 1. Cross-cultural variation in contributions is substantial. 2. Two of the robust findings from VCM experiments with WEIRD subjects generalize: There are large individual differences in contributions especially in the early rounds, and contributions decline over repeated rounds.
International Comparisons
A pioneering examination of cultural diversity in VCM contributions is Henrich et al.’s (2001, 2005) study of six geographically diverse small-scale societies with traditional economies, from self-sufficient agriculturists to hunter-gatherers with a high level of cooperation. In their one-round experiments the mean contributions range from 22% among self-sufficient family farmers to 65% in close-knit tribal societies with a tradition of voluntary cooperation such as pooling food. Among Blackwell and McKee’s (2010) student subjects Russians contribute the most followed by Kazakhs, with the US a distant last. Gächter and Herrmann (2009) report nation-level effects in the VCM contributions of Swiss and Russian university students: Contributions did not differ between each country’s universities, but Russian students cooperated less than Swiss students. Gächter et al. (2010) compare the cooperation rates of 1120 university students from 16 countries including some that are not democratic or are developing. Their study demonstrates the impact of culture on cooperation rates: Contributions are similar between related cultures but differ between locations that are culturally distinct. (The Cultural World Map describes their study in more detail.) Ehmke et al. (2010) compare university students in France, two US states, China and Niger. Contribution patterns in the two US locations and in China are near identical, and French contributions are somewhat similar to them. Oddly, Nigerien cooperation levels start below those of the other countries but do not decline over rounds.
Comparisons Between “WEIRD” Regions
Our study falls into this category. Both Iceland and the US are established democracies. Their per capita GDP (PPP adjusted) has long been close (OECD, 2020; World Bank, 2019). Yet, as our study will also show, noteworthy cultural differences can exist between WEIRD cultures. Ockenfels and Weimann’s (1999) report that East German students contribute much less than West German students, presumably because their post-WWII ideological and economic divergence impacted civic attitudes, a process that is often slow to reverse (Alesina & Fuchs-Schündeln, 2007; Gershman, 2017). The East German mean first round contribution (roughly 22%) is about as low as the contribution by self-sufficient Amazonian farmers reported by Henrich et al. (2005). In Bigoni et al.’s (2016) experiments, Southern Italians cooperate less than Northern Italians; this is not surprising since the two regions have long differed historically, economically, and culturally (see e.g., Putnam et al., 1993). Castro (2008) finds that British students contribute more than Italian students. Weimann (1994) reports lower cooperation among US students than German students in a “partners” VCM. In a study that is not cross-cultural but whose econometric approach inspires the current study, Ashley et al. (2010) conducted an econometric analysis of the structure of contribution decisions in two classic VCM experiments with US students in two different states. 11 The coefficients of the variables subjects consider in their contribution decision are similar in both locations. However, Eckel et al. (2015) do find a state-based difference among US subjects: within the state of Texas students contribute similarly and more than their peers in other states.
VCM Experiments Where No Cultural Differences were Found
Ehmke et al.’s (2010) cross-cultural study mentioned in International Comparisons contains an interesting null result: US contribution levels do not differ from China’s even though there is no doubt that these cultures are quite different. In a meta-analysis of VCM experiments conducted in East Asia and the US, Pang and Bowles (2006) similarly report no significant differences. Brandts et al. (2004) find no statistically significant country effects between the contributions of Spanish, Dutch, Japanese and US students. Henrich et al. (2010) suggest that such behavioral parallels might be due to university students increasingly sharing a global culture. An alternative explanation is that since culture is a shared world view that impacts behavior but does not equal behavior (Cronk, 1999) culturally different thought processes can result in either different behavior or in superficially similar behavior. Recall for example that the cooperation rates Henrich et al. (2001, 2005) found among self-sufficient tribal South American farmers resemble those of Ockenfels and Weimann’s (1999) East German students.
In the next section, we develop hypotheses about cultural differences between Iceland and the US regarding observed cooperation levels as well as the underlying cognitions. In Results we return to the question of whether different cultures can attain similar levels of efficiency through different culturally driven mental processes.
Hypotheses Based on Survey Measures of National Culture
Cross-cultural economic experiments are quite new. We therefore base our hypotheses on two established survey measures often known to economists: the world map of cultures (introduced by Inglehart, 1997), and Knack and Keefer’s (1997) index of civic attitudes. The two scales lead us to hypothesize that VCM contribution levels and the underlying motivational processes differ between the US and Iceland (Inglehart & Baker), and that in Iceland, a focus on the wider social unit increases cooperation more than in the US (Knack & Keefer). 12
The Cultural World Map
In the cultural world map (Figure 1) introduced by Inglehart and Baker (2000), two orthogonal axes are constructed from responses to the WVS.
13
The vertical axis captures the tension between “traditional” and secular-rational values. A “traditional” culture favors nationalism, religion, and authority, while a secular-rational culture favors agnosticism and science. The horizontal axis captures the tension between survival and self-expression: Security-focused survival values prioritize safety and predictability while post-materialistic emancipative self-expression values favor individualistic unfolding (Inglehart & Welzel, 2005; Welzel, 2013). Most importantly for us here, Figure 1 shows that national cultures form clusters of related cultures based on a factor analysis of survey responses. The clusters illustrate culture’s persistence over time: Religious commonalities and historic links shape present-day cultural similarity. Inglehart and collaborators have extensively written about change in certain values as economies develop. Especially, with increasing wealth cultures tend to move from the traditional, security focused lower left corner of the map toward the secular-rational, individualist upper right corner of the map (Inglehart, 1997; Inglehart & Baker, 2000; Inglehart & Welzel, 2005; Welzel, 2013). Such movement notwithstanding, the clusters have remained consistent.
14
Figure 1 depicts the 2014 version of the map since our data were collected in late 2014 and in early 2015. The figure shows that the US belong to the English-speaking cluster while the Nordic countries including Iceland belong to the Protestant cluster. The 2010–2014 Inglehart-Welzel world map of cultural values (World Values Association, 2020b).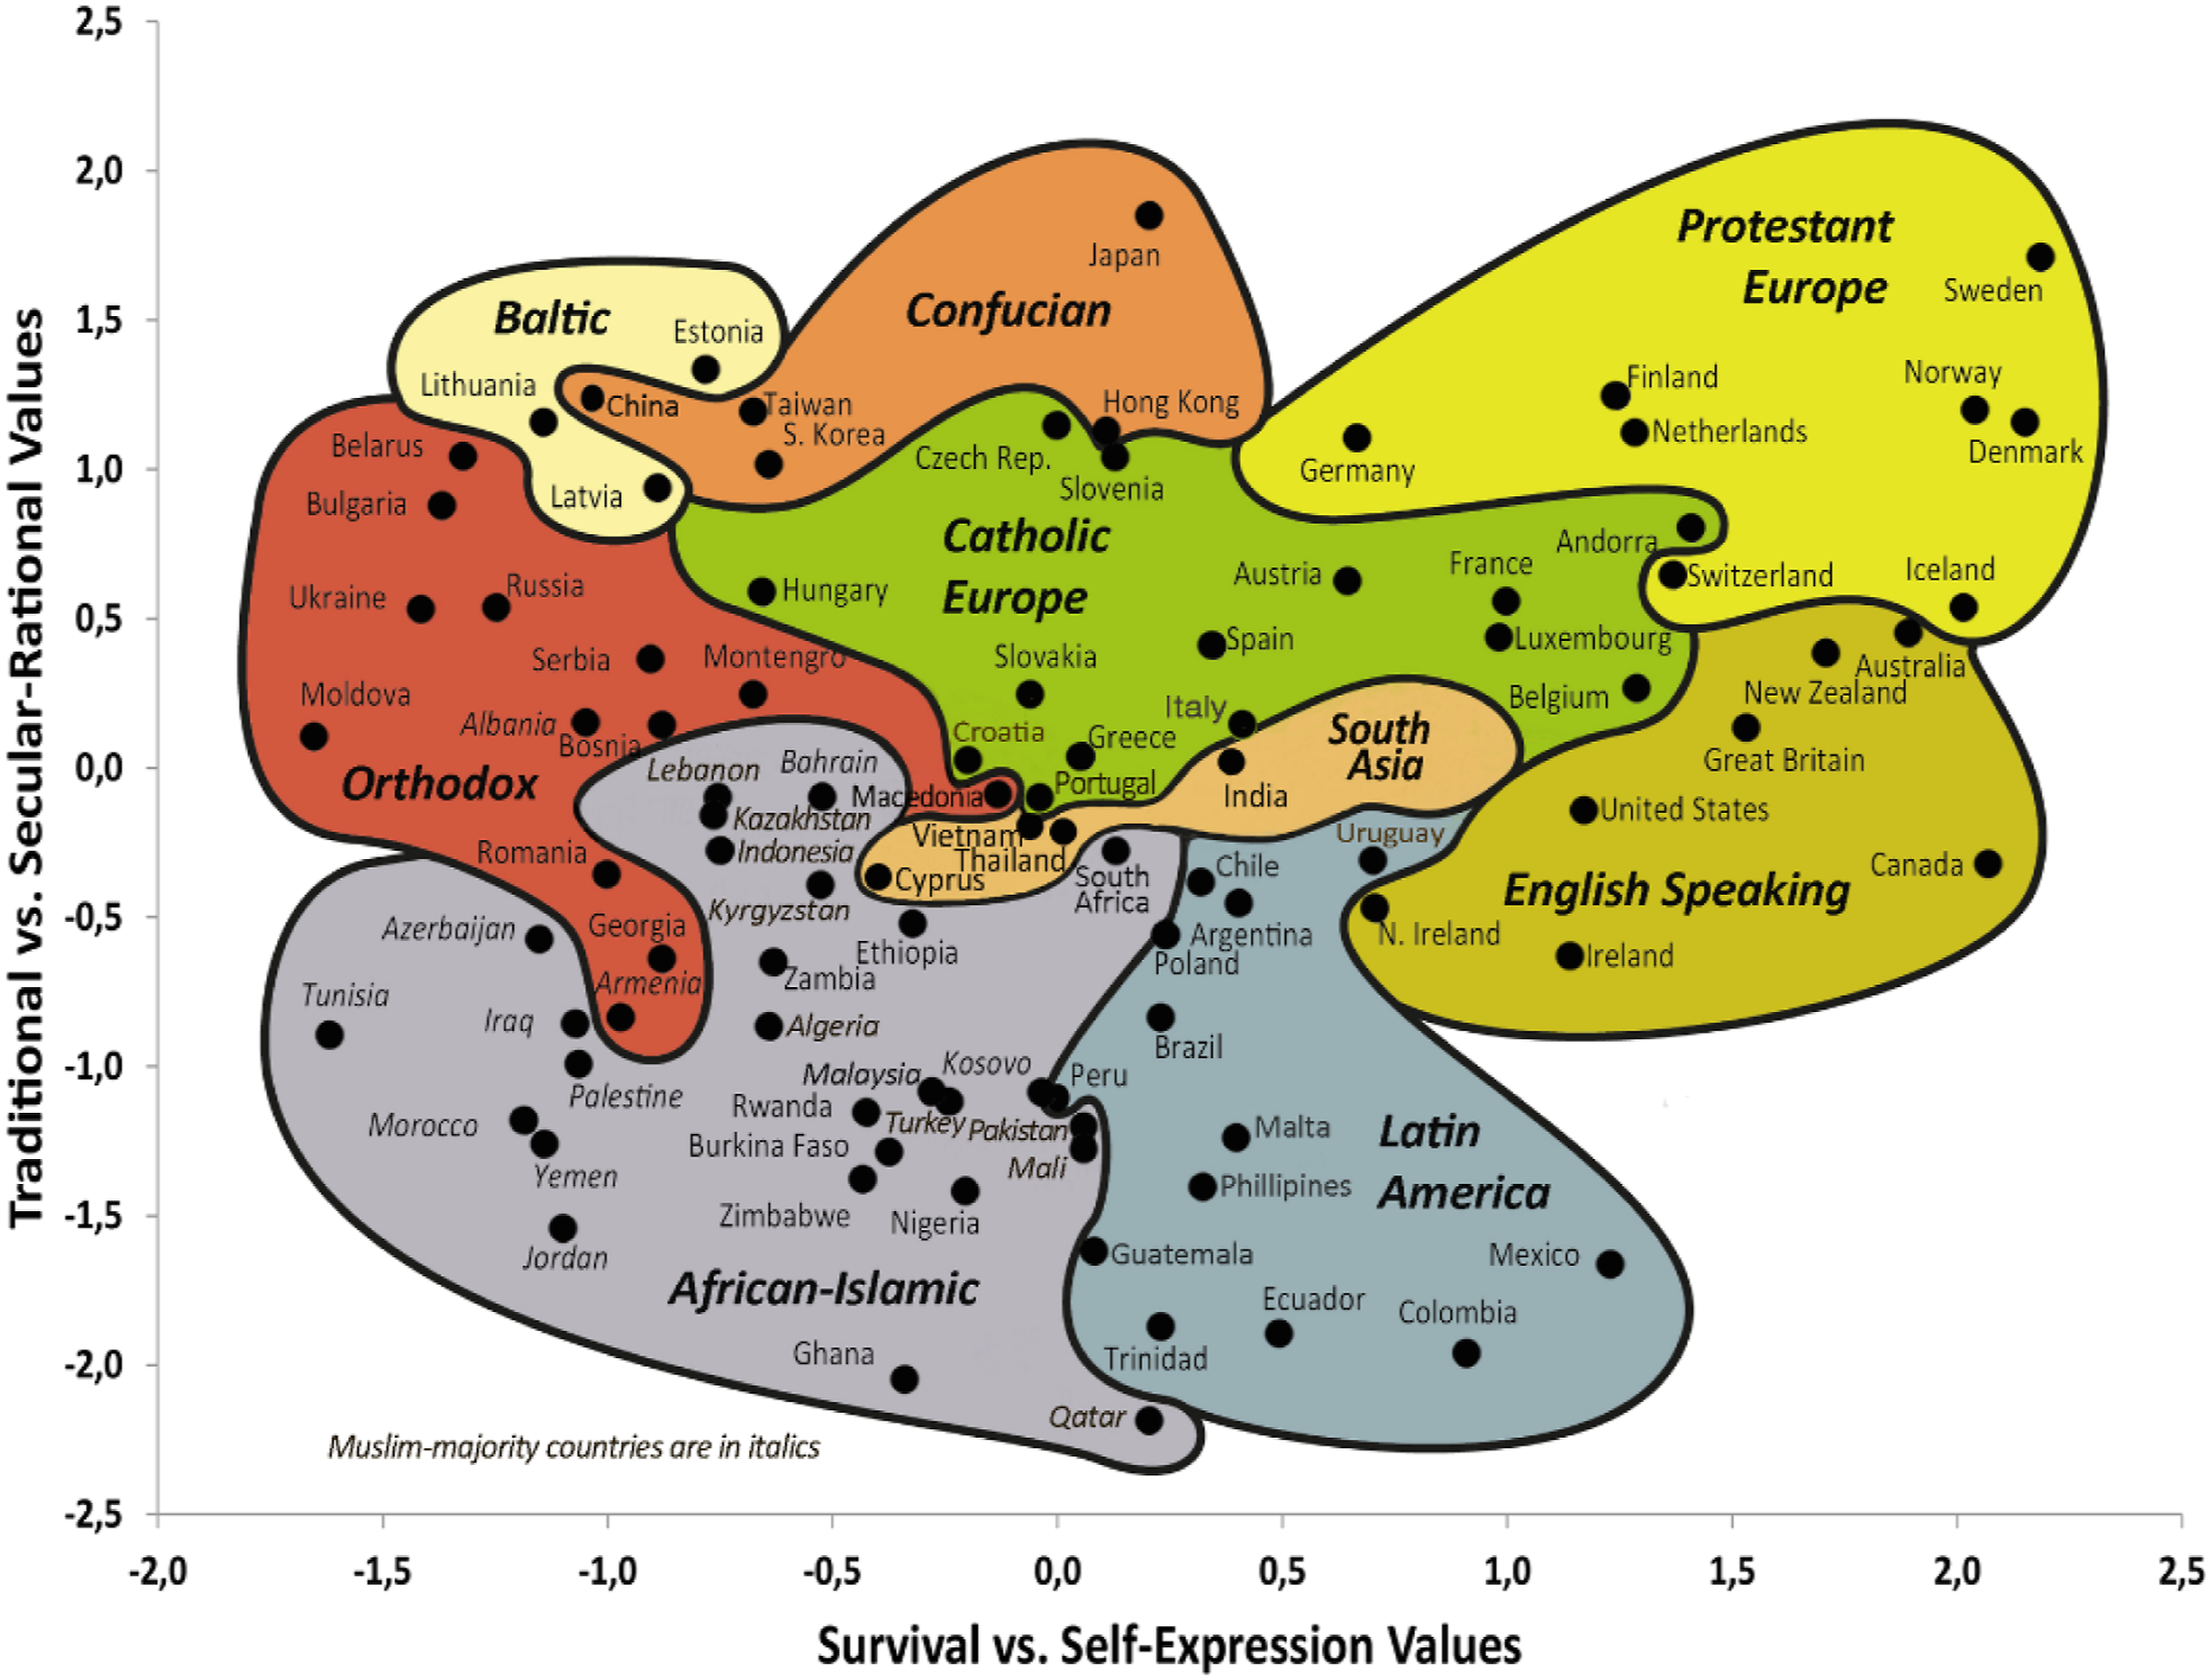
Findings from VCM Experiments
In a large international VCM study in 16 locations spanning six of Inglehart’s culture clusters Gächter et al. (2010) report that the clusters account substantially for the observed variation in contributions while contributions are remarkably similar within clusters. Their analysis is general and focused on overall sources of variability between and within clusters, not on bilateral differences between clusters. We hypothesize, somewhat tentatively:
While culture impacts behavior it does so via values and perceptions (Cronk, 1999). Consider for example the striking classic experiment by Morris et al. (1995) on how differently Far Eastern and Western cultures interpret even simple visual stimuli. Theirs and similar 16 studies underscore how different cultures focus on different aspects of a situation and interpret it differently. Also consider the homogeneity in the interpretation of stimuli within cultures (Morris et al.). Regarding situations that call for cooperation, in their econometric decomposition of factors that subjects consider when deciding on their VCM contribution, Ashley et al. (2010) report coefficients that are surprisingly similar for US students in two different states. Kocher et al. (2008) compare, cross-culturally, the drivers of contribution decisions. 17 They report that in the US conditional cooperator types are more common than in Austria or Japan, suggesting that different cultures view the decision to cooperate differently. 18
Norms of Civic Cooperation
Mean Responses to Single Statements that Make Up the CIVIC Score, and CIVIC Scores per Country. 19
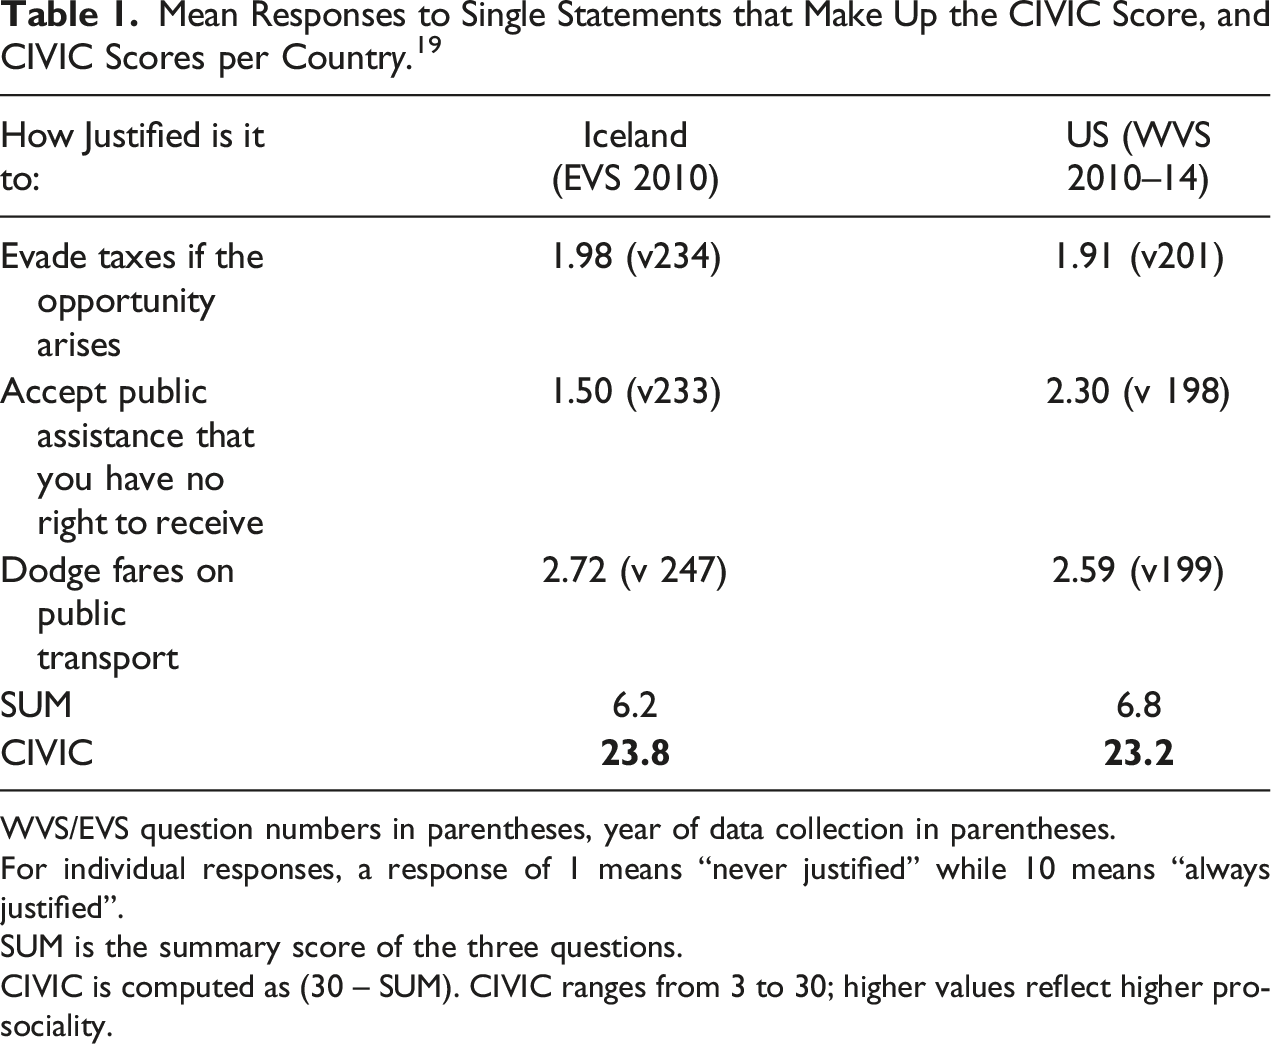
WVS/EVS question numbers in parentheses, year of data collection in parentheses.
For individual responses, a response of 1 means “never justified” while 10 means “always justified”.
SUM is the summary score of the three questions.
CIVIC is computed as (30 – SUM). CIVIC ranges from 3 to 30; higher values reflect higher pro-sociality.
Findings from VCM Experiments
Herrmann et al. (2008) conducted VCM experiments with an added punishment option where each participant could reduce the earnings of any other group member at a cost to self. They report that CIVIC is associated with a willingness to punish free riders. It seems plausible that a culture where free riders get punished by their peers, values cooperation and pro-sociality. Punishment might be an attempt to strategically force free riders to cooperate, but it might also be due to a simple moral aversion to behavior that is considered anti-social.
A closer look at CIVIC reveals that, while it captures attitudes toward cooperation, the questions are not about a directly cooperating team such as in a VCM, but rather, about pro-social behavior toward broad public goods where cooperation is not directly reciprocated but is based on a perceived obligation to behave in a pro-social manner. We therefore put forward the following hypothesis:
Method
Participants
The US participants were recruited from the student population at the University of Arizona. They were invited for a two-hour experiment with a US$ 5 payment for showing up on time, and further earnings contingent upon the decisions by themselves and others during the experiment. Students who had previously participated in a VCM experiment were excluded. The Icelandic subject pool was the students at the University of Iceland. Their show-up fee was ISK 1000 (about US$7.50). 20 No students were excluded from the invitation since no VCM experiments had been conducted there.
Locations, Facilities, and Software
The US experiments were run in a decision laboratory with networked computers separated by permanent blinders. The Icelandic experiments took place in a multi-purpose computer lab with temporary cubicles installed for the experiment. The software, in Visual Basic, is available from the authors upon request.
Experimental Parameters
For reasons of comparability, we opted for parameters frequently used in VCM experiments (see Zelmer, 2003, for common VCM parameters). The return from the private account was 1. The sum of investments in the group account was multiplied by
Design
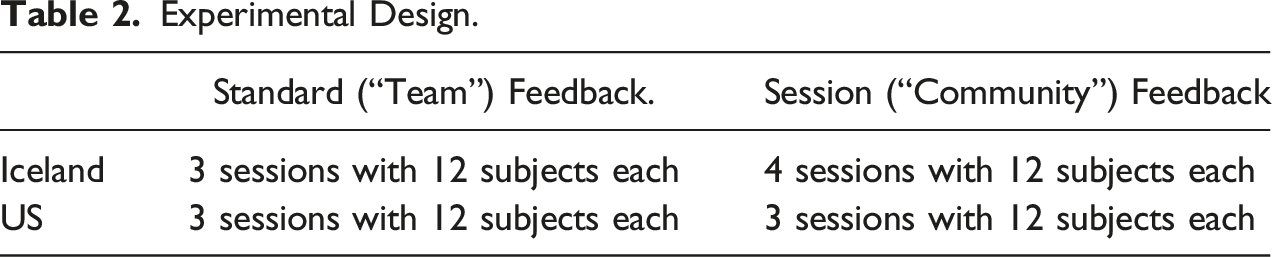
The design (Table 2) is a fully crossed 2 x 2. The experiments were run in two high-income established democracies that differ culturally. This allows us to keep socio-economic development constant (Inglehart & Welzel, 2005; Welzel, 2013) while observing the impact of long-standing cultural values. In both locations there were two treatments that differ in the end-of round information a subject received: • The group-level(“team”) feedback treatment has standard VCM end-of-round information: After each round, a subject was reminded of his own contribution to the individual and group account in that round, the sum of what the other three group members together had contributed, his total earnings in that round, and those earnings broken down according to their source (individual account/group account). Additionally, each participant saw boxes with the group contributions of all • Session-level (“community”) feedback is designed to assess the effect of focusing subjects not only on their directly cooperating team but also on a wider social unit (Hypothesis 3). In addition to what subjects saw during team feedback, at the end of each round each subject was shown boxes with the contributions not only within her team but by all session participants. The boxes were grouped into three clusters corresponding to the grouping in that round. A subject’s own contribution was again highlighted so that her team, and her own contribution, were clearly recognizable. This treatment models a community comprised of organizations with mobile membership, where community members are aware of each other’s actions even though they are not necessarily directly impacted by them. Experimental Design.
The instructions (Supplemental Material), in English in both locations, were identical across feedback treatments except for the second-to-last paragraph where the treatment-dependent end-of-round feedback is explained.
Procedure
Since lectures and textbooks at [a large Icelandic university] are often in English the experiments were conducted in English in both locations, according to the same written protocol, by the same experimenters not previously known to the participants. At the start subjects got paid their show-up fee and were assigned to cubicles at random. Next, an experimenter announced that the experiment had started and that no communication, verbal or otherwise, was permitted. Subjects were instructed to place their bags under their seats, shut off their phones, read and sign the consent forms, 21 and to raise their hand if they had questions which an experimenter would address individually and privately.
Thereafter, the participants read the printed instructions placed in each cubicle. To provide assurance that all players were symmetrical the experimenters pointed out that the instructions were also projected onto a wall visible to all. The experiment started after all participants had signaled that they understood the instructions and were ready.
At each of the 80 rounds, each player was randomly assigned to a group of
At the end of the session participants returned their written instructions to an experimenter, were asked to not share details of the experiment, and were privately paid their cash earnings.
Payments and Earnings
The show-up fees and earnings were identical across countries in terms of opportunity cost, by approximating the minimum wage at each location. The experiments were run in late 2014 and early 2015 when the [state] minimum wage was US$ 8.05/hour. Iceland does not have a minimum hourly wage, but at that time the guaranteed lowest monthly income (“Lágmarkstekjutrygging”) was ISK 245,000.00 (Confederation of Icelandic Enterprise, 2014). With a standard 172 monthly work hours this amounts to 1424 ISK per hour.
The US show-up fee was $5, or 0.62 minimum wage hours. The Icelandic show-up fee was ISK 1,000, or 0.7 minimally remunerated hours. In equilibrium where everybody keeps all their tokens in the private account each subject earns 100 tokens per round, 8000 tokens over 80 rounds. The equilibrium earnings over 80 rounds correspond to 1.8 minimum wage hours in both locations. 22
Results
We divide our analysis into 12 short results starting with the contribution levels. We conclude with differences and commonalities in the underlying thought processes.
Result 1:
Under group (“team”) feedback, mean contributions over rounds do not differ between the US and Iceland.
Figure 2 depicts the mean contributions per round, country, and treatment. Under group-level feedback (the standard feedback in VCM experiments) there is no overall country difference in the contribution levels,
23
and Hypothesis 1 is not supported. The mean contribution over all 80 rounds is 34 out of 100 tokens both in Iceland and in the US. The mean first round contribution is 47 tokens in Iceland and 43 tokens in the US, both in the range typically reported from Western students (Davis & Holt, 1993; Ledyard, 1995; Zelmer, 2003), and this difference is also not significant.
24
: By round 80 mean contributions have declined to 25 tokens in Iceland and 26 tokens in the US. As mentioned in VCM Experiments Where No Cultural Differences Were Found, even different cultural lenses might lead to similar cooperation levels. In Results 5, 11, and 12 we show that different cultural lenses underlie these superficially similar contribution patterns. Mean contribution per round, country, and treatment.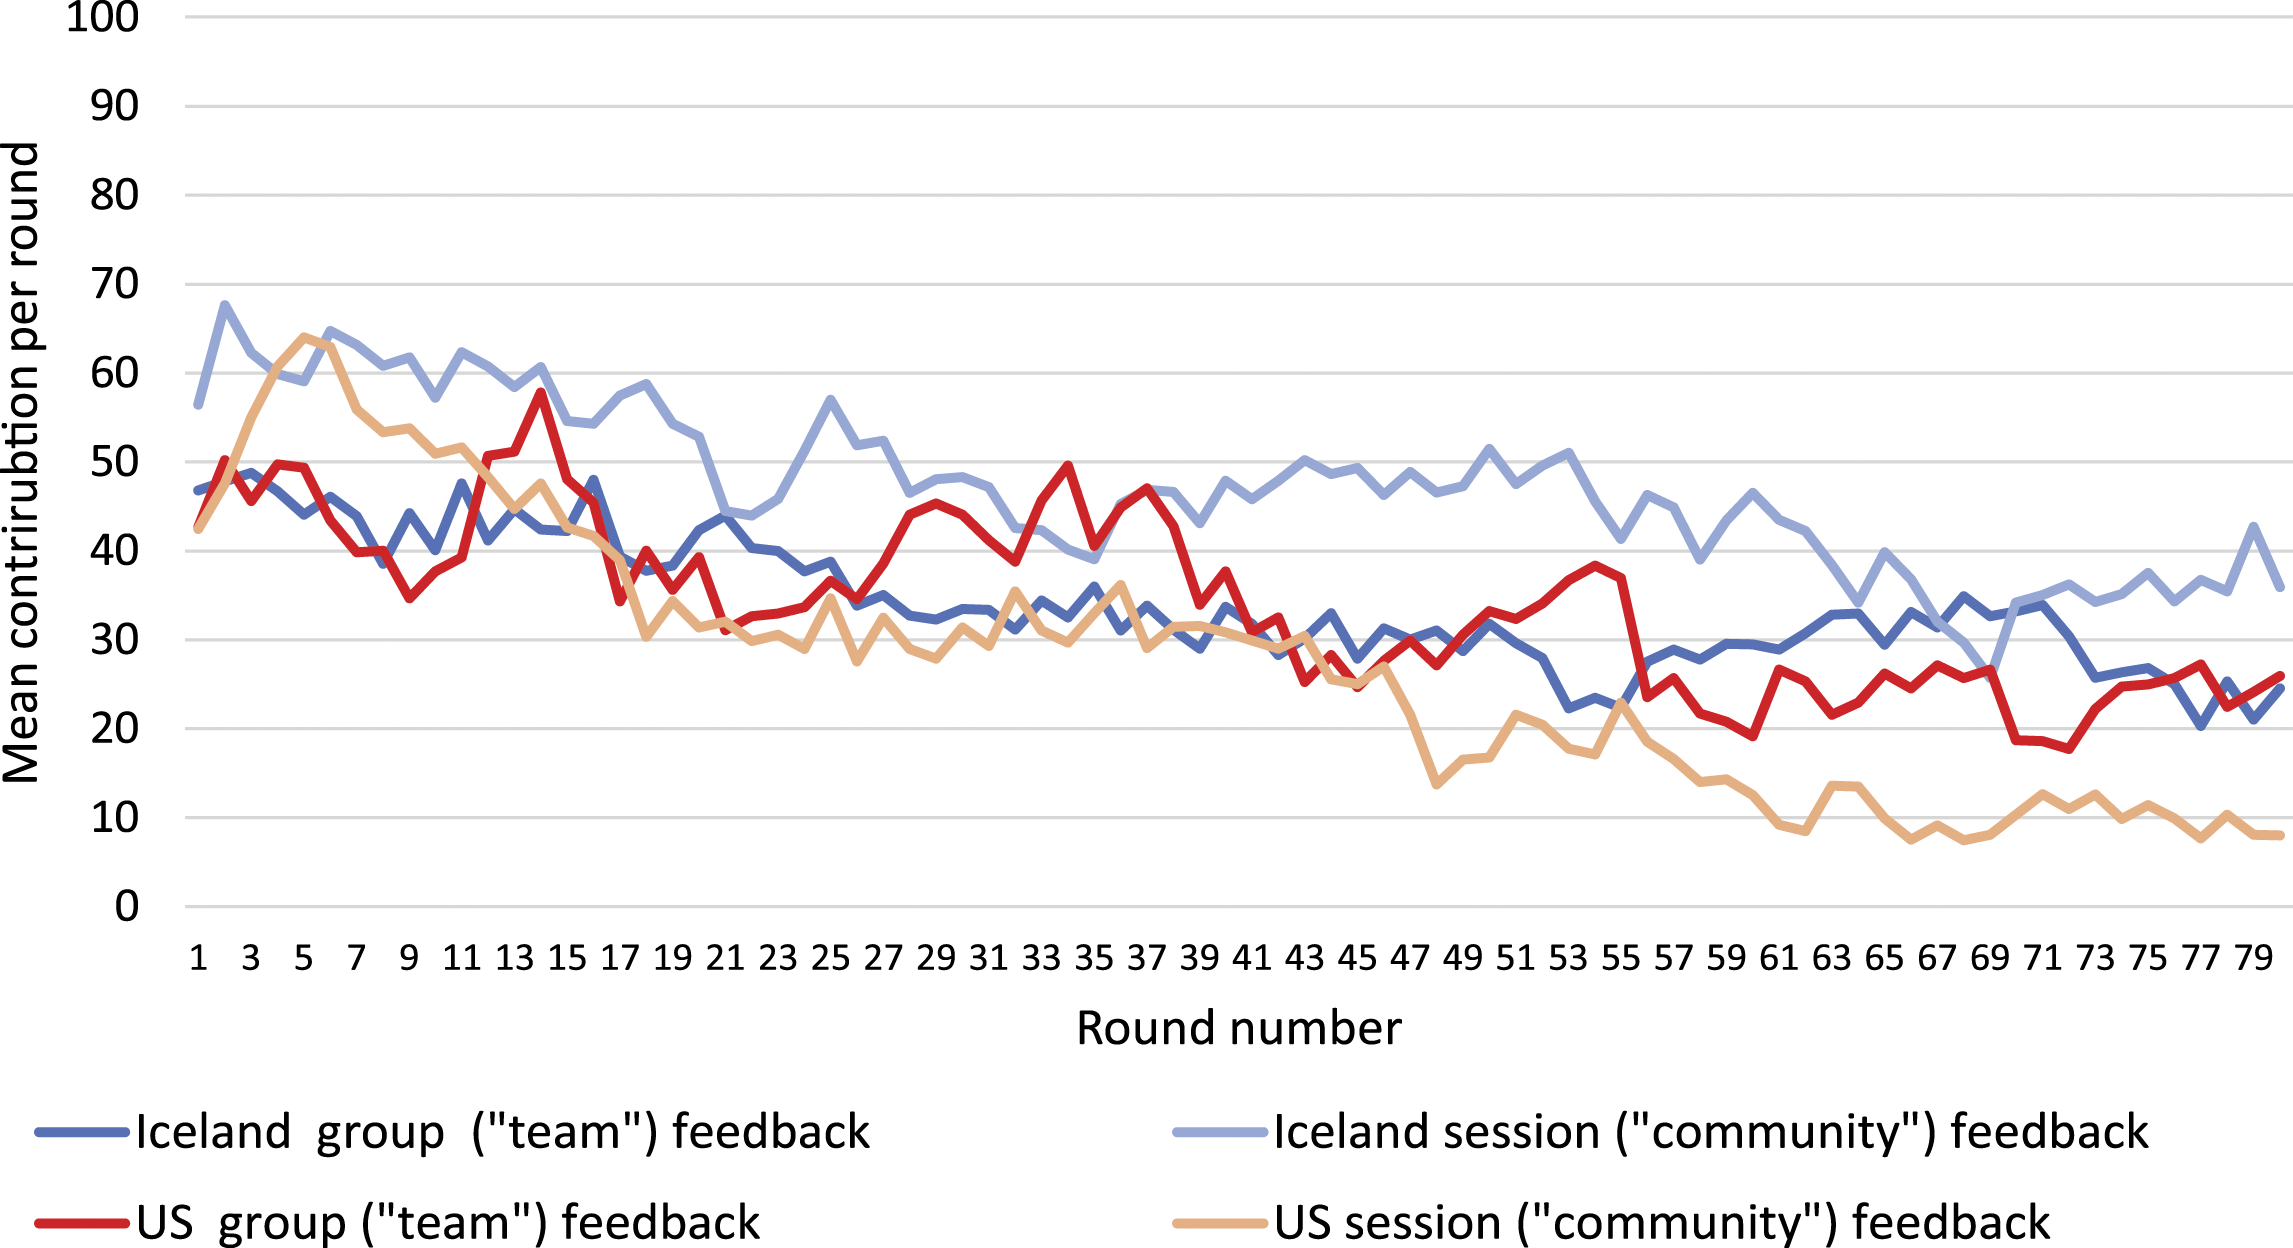
Result 2:
Under session (“community”) feedback contributions are higher in Iceland than in the US.
Informing participants of the contribution of everyone in the session and thus focusing them on a wider community (all session participants), results in a clear country difference (Figure 2). This supports Hypotheses 1 and 3. It is also suggestive of Hypothesis 2 since we observe culturally different responses to what is effectively a priming message about membership in a wider social unit. Recall that the participants know from the instructions, and thus at the very start of Round 1 before they have seen the first post-round feedback, that everybody’s contribution will be viewed by all others in the session, albeit anonymously. Already in Round 1, the Icelandic mean contribution of 56 tokens significantly exceeds the US mean of just 42 tokens.
25
Over all 80 rounds, the mean contribution is 56 tokens in Iceland but only 27 tokens in the US. In Round 80, Icelanders still contribute 36 tokens on average while the corresponding US value is only 8 tokens. With the individual subject as he unit of analysis the overall difference between contributions in Iceland and the US is highly significant: Mann-Whitney U (henceforth,
Result 3:
In Iceland, session (“community”) feedback raises contributions compared to group (“team”) feedback. This effect is present in the earliest rounds and is stable over rounds.
Further in accordance with Hypothesis 3, Figure 2 shows that the Icelandic mean contribution per round under community feedback exceeds the Icelandic team feedback mean in nearly every 28 round. Over all rounds, the mean contribution is 56 tokens under community feedback and 47 tokens under group feedback. MWU tests with the subject as the unit of analysis reject the null hypothesis that the contribution levels are the same in the two feedback conditions. 29 With session means as the unit of analysis this result holds. 30 Already in the first round there is a significant difference in contributions. 31 The fact that the difference in cooperativeness between feedback treatments emerges in the very first round rather than gradually suggests that not just the session-wide post-round feedback but already the treatment-specific instructions focus Icelandic subjects on their wider social unit, and that this primes some sort of a schema, possibly a morally driven community focus.
Result 4:
There are indications that for US subjects, session-level feedback lowers contributions in the later rounds of the experiment.
For US subjects, the effect of community feedback trends opposite of what is observed in Iceland. The mean contribution over sessions and rounds is lower under community feedback (27 tokens) than under group feedback (34 tokens). Over all 80 rounds this difference is not statistically significant. 32 However, a closer look at Figure 2 reveals a change over time: The contribution levels of group and community feedback are similar until Round 21, and even intersect: In Rounds 3 – 11, 17, and 21 the mean under community feedback exceeds the corresponding group feedback mean. Thereafter, group feedback means reliably exceed community feedback means, with the sole exception of round 43. If only Rounds 41 to 80 are considered 33 the difference in contribution levels between feedback treatments is statistically significant with the subject as the unit of analysis 34 but not with session means as the unit of analysis. 35
Result 5:
US subjects’ link their contributions more strongly to those of others than Icelanders do. This linkage is in turn is associated with lower cooperation rates. The linkage is most pronounced under community feedback.
In the remainder of this section, we explore reasons for the differences in observed behavior shown in Figure 2, and possible cultural differences in the underlying motives to cooperate. We start with examining simple correlations that show how strongly individuals’ contributions are linked to those of others. In Results 6–12 we compare effect sizes and delve deeper into cultural differences and similarities in the motives to cooperate.
Reciprocators are players who tend to match the contributions of others in their group (e.g., Croson, 2007; Keser & Van Winden, 2000; Page et al., 2005). 36 If a sufficient proportion of players match the amounts that other group members contribute it can slow the robustly observed decay in contributions over rounds. Reciprocity does not fully halt the decay because of variability both in the contributions a player observes, and in the degree to which players match others’ contributions, if at all. With sufficiently many free riders present reciprocity can even accelerate the decline in cooperation (Gunnthorsdottir et al., 2007; Page et al., 2005). The decline also accelerates if own contributions are somehow systematically associated with those of others, without matching the amounts that others contributed. For example, Sugden (1984) presents a model of systematic “minimum matching” where players match the minimum contribution in their group. The linkage described by Sugden is systematic but cannot sustain cooperation over repeated rounds. In other words, to slow the decline in cooperation over rounds it is not only necessary that players link their contributions to others. Players must also match the actual amounts of the contributions by others.
Correlations Between Own Contribution xit and Observed Behavior by Others in the Preceding Round.
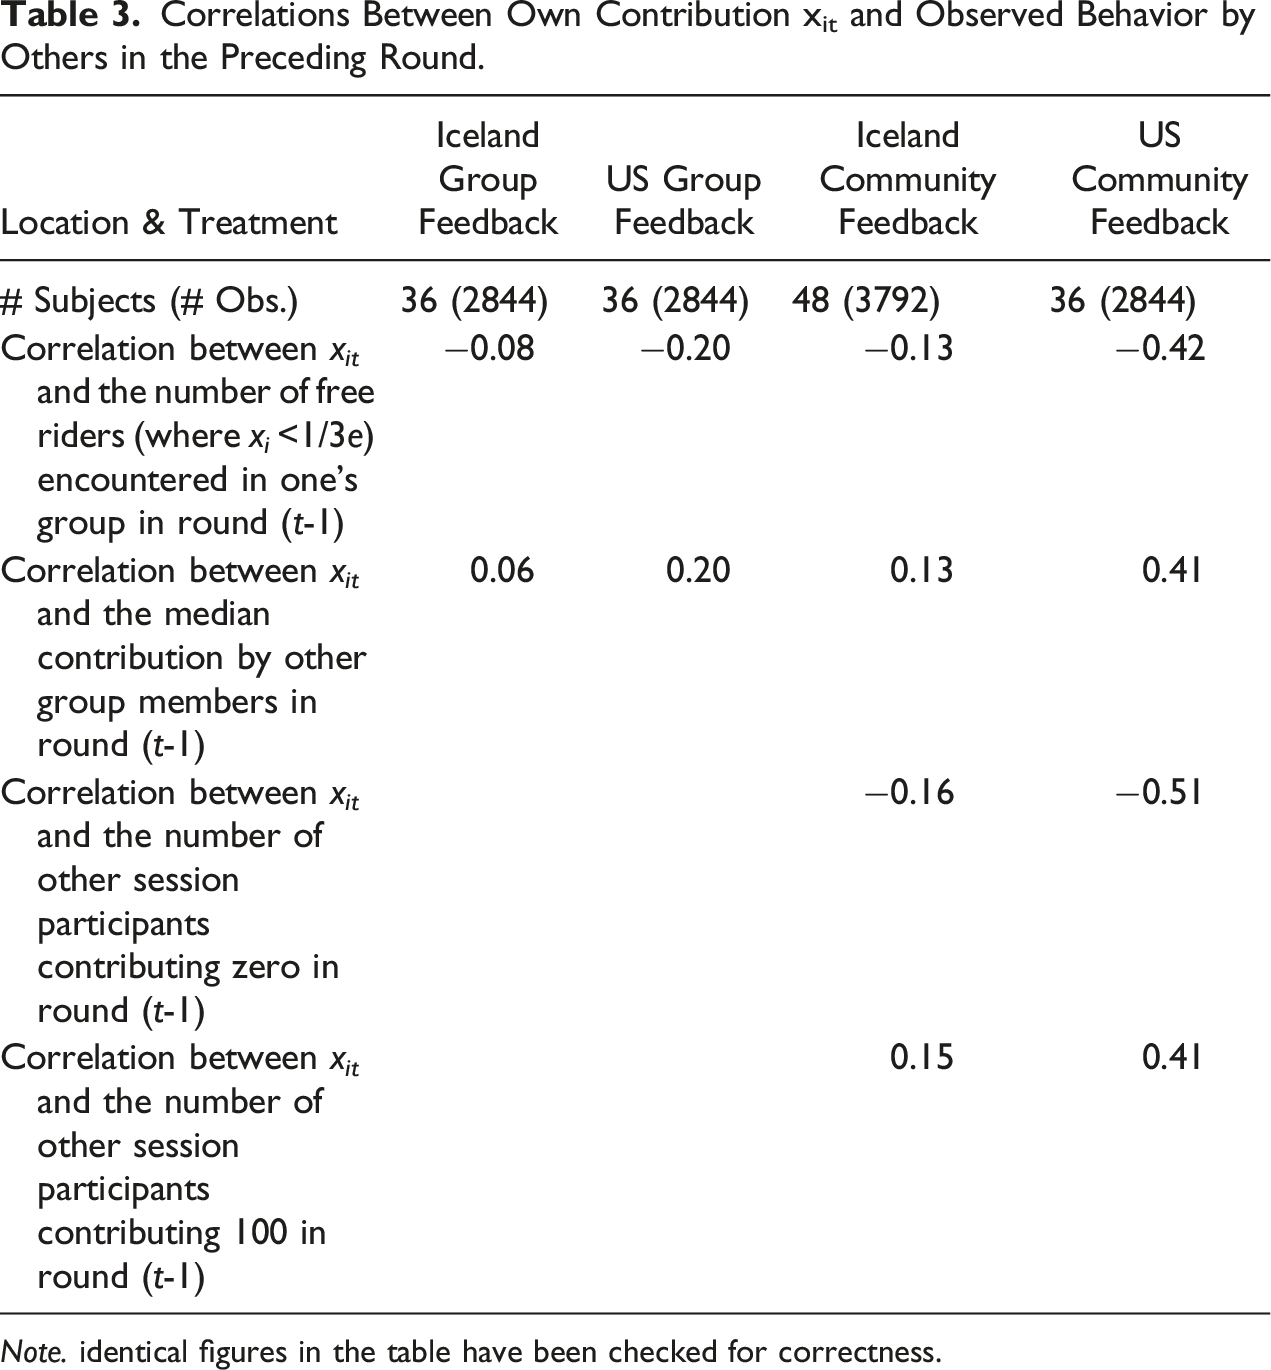
Note. identical figures in the table have been checked for correctness.
Result 6:
In both treatments, the structure of the contribution decisions differs between the two cultures.
Result 5 provides initial support for Hypothesis 2, that the two cultures somehow think differently about cooperation. However, what motivates Icelandic subjects to cooperate at an equal or even higher level than US subjects even though their contributions are less associated with those of others? Could there be different cultural lenses, equally effective, that drive cooperation? To address this, we conduct a detailed analysis of the factors that influence contribution decisions in the two cultures.
Double Censored Tobit Regression of Group Contributions in Round t on Decision Factors. (Standard Errors Clustered by Individual, Standard Errors in Parentheses).
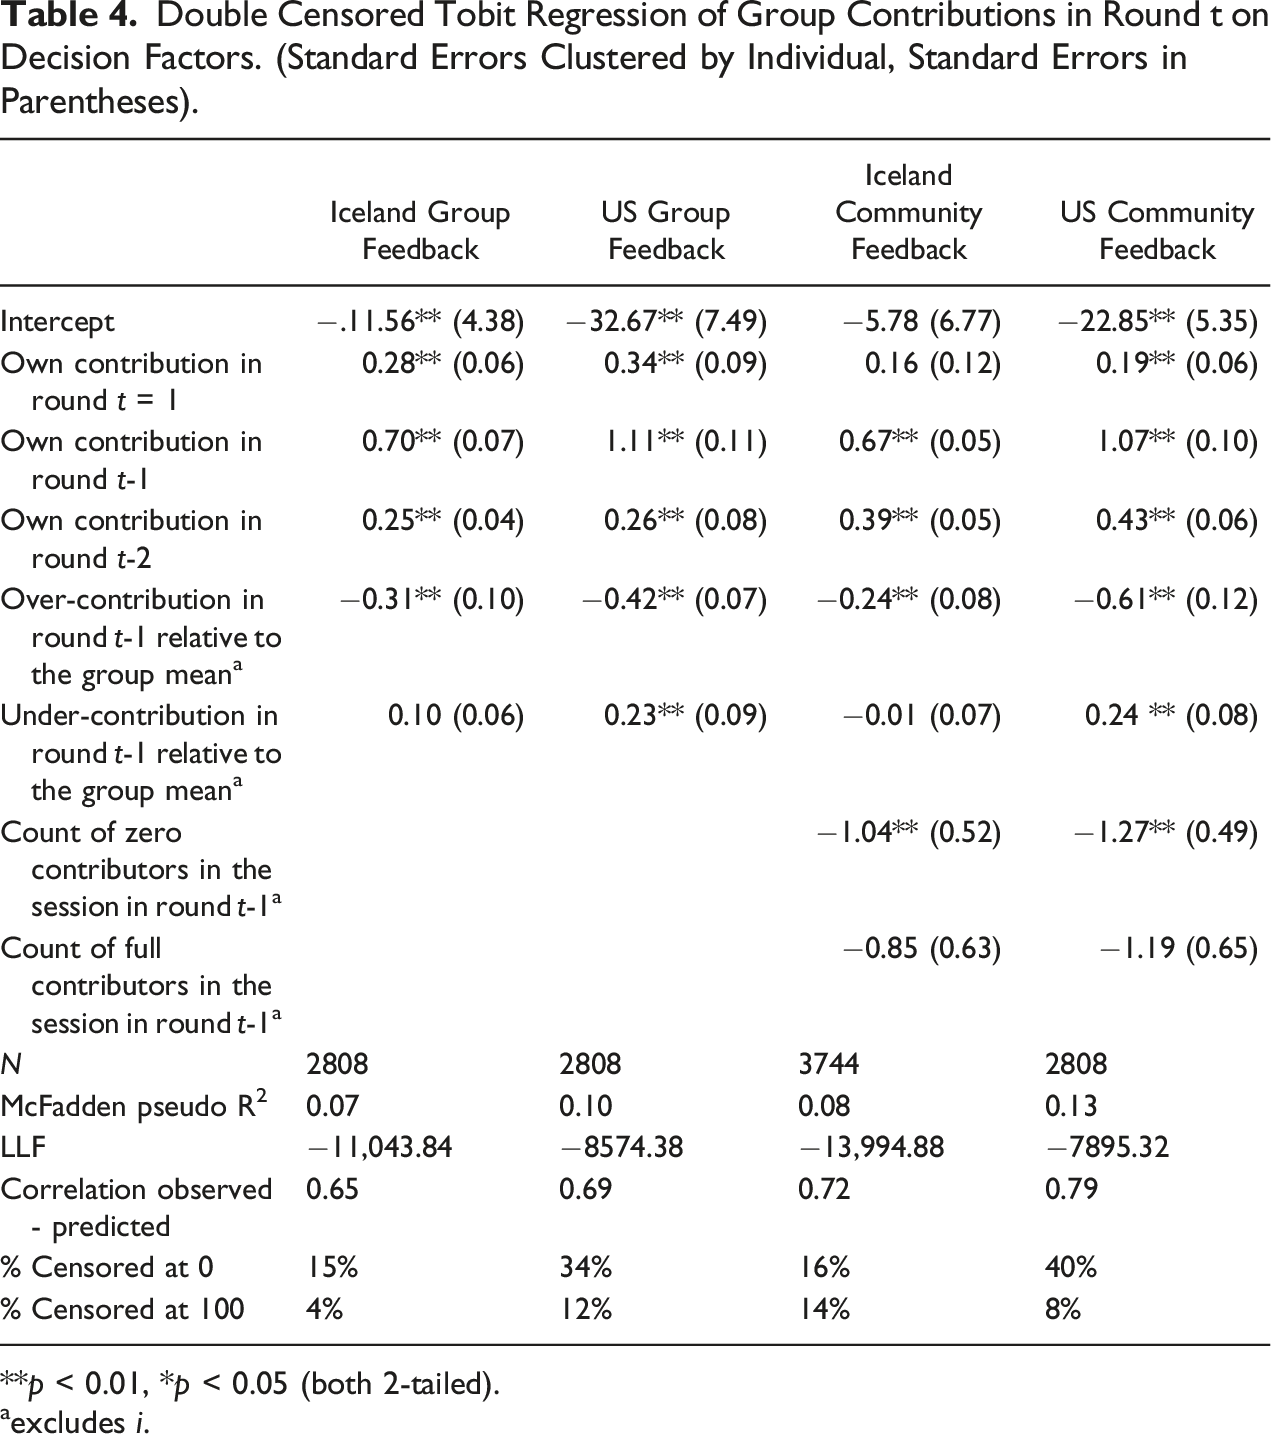
**p < 0.01, *p < 0.05 (both 2-tailed).
aexcludes i.
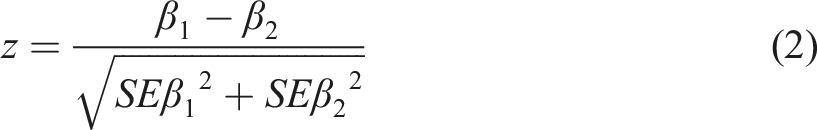
Coefficient Differences Between the Two Cultures and Their Statistical Significance Computed According to Equation (2). The US Coefficients are Subtracted from the Coefficients for Iceland. Cells with Significant Differences (
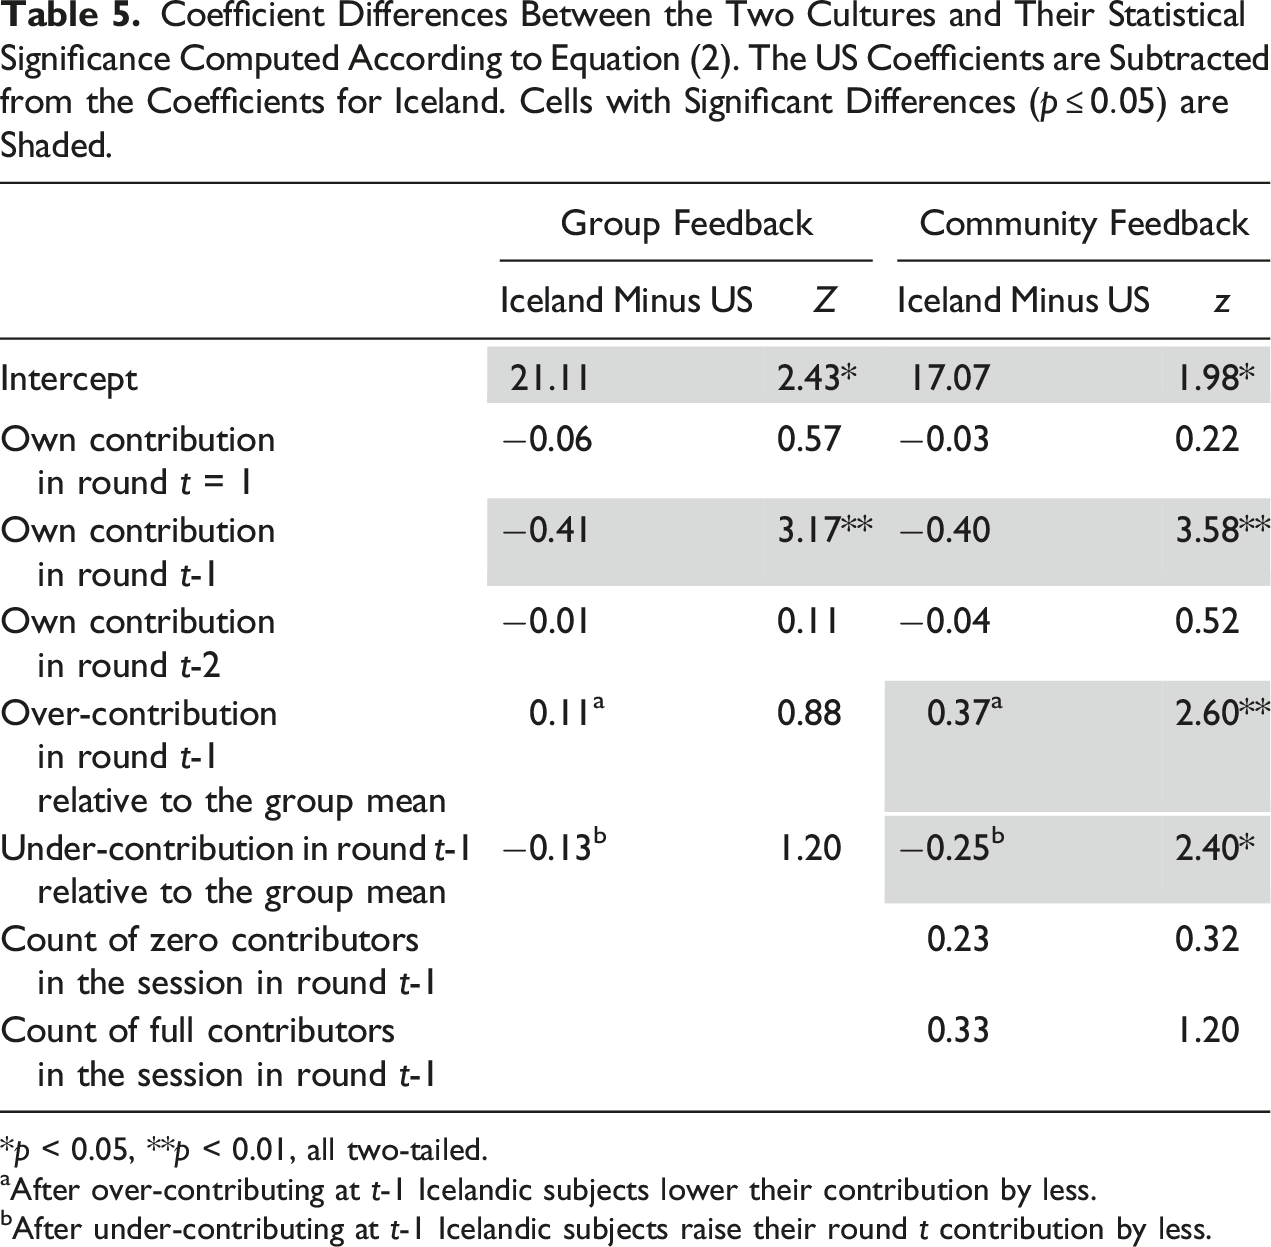
*p < 0.05, **p < 0.01, all two-tailed.
aAfter over-contributing at t-1 Icelandic subjects lower their contribution by less.
bAfter under-contributing at t-1 Icelandic subjects raise their round t contribution by less.
Result 7:
In both countries and in both treatments, subjects are in part guided by a stable personal heuristic.
Subjects bring to the laboratory their habitual behaviors and frames (Henrich et al., 2004, p. 46; Hoffman et al., 1998). In a VCM, this includes their cooperative style. The latter is known to be heterogeneous even within a culture, and includes unconditional cooperation, conditional cooperation, free-riding, or hybrid strategies (Croson, 2007; Isaac & Walker, 1988; Kocher et al., 2008; Kurzban & Houser, 2005). We capture players’ cooperative style by their contribution in Round (t = 1) and their behavioral stability over rounds by their contributions in Rounds (t-1) and (t-2).
Table 4 shows that the first round (t = 1) contribution is an indicator of one’s contribution level throughout the experiment, in both cultures and both treatments. Similar results have been reported elsewhere (Gunnthorsdottir et al., 2007; Ones & Putterman, 2007). There is no country difference in how the (t = 1) contribution predicts subsequent behavior (Table 5). Furthermore, the coefficients of contributions in Rounds (t-1) and (t-2) are significant in all four columns of Table 4. Table 5 shows that the coefficients of (t-1) contributions are lower in Iceland than in the US in both treatments, but there is no country difference in the impact of (t-2) contributions. The finding that US subjects’ (t-1) contributions have a higher impact on their subsequent decision in Round t might reflect individual stability and independence from the group. It could be linked to the fact that the US have the most individualist culture in the world (Hofstede et al., 2010, p. 97). 39
Result 8:
In both locations and in both treatments, subjects consider the mean of other group members’ contributions in the preceding round.
Each 80-round experiment lasted just under 90 minutes, about a minute per round. Without formal time constraints subjects in both countries settled on this relatively fast pace. In addition to their individual type-based heuristics (Result 7) subjects must rely on information that they can process in such limited time. Recall that under group feedback only the individual contributions within one’s group were displayed. Under community feedback where all session participants’ contributions were displayed, one’s own group visually stood out from among the other groups. In both feedback treatments, subjects could thus quickly process the minimum, maximum and possibly, median contribution in their own group of four. In addition to the display of individual contributions, in both treatments the sum of the contributions by the other three group members was shown in a separate message box, so that it was possible to get a sense of their mean. There was also a reminder of one’s own contribution, allowing a comparison.
Following Ashley et al.’s (2010) econometric analysis of the cooperative motives of US students, we separate individual deviations from the mean contribution by the other three group members at Round (t-1) into two independent variables (Table 4): “Over-contribution in Round (t-1) relative to the group mean” is the amount by which an individual’s contribution exceeded the mean of the other three group members, zero otherwise. “Under-contribution in Round (t-1) relative to the group mean” similarly captures under-contribution. Table 4 shows that participants in both countries and in both treatments are guided by the mean of other group members’ contributions in the preceding round. The coefficients for over-contribution and under-contribution in Round (t-1) are highly significant. The sole exception is under-contribution relative to others in the Icelandic community feedback treatment. 40
Result 9:
In both cultures, players whose contribution in Round (t-1) had been below the mean of what the other group members had contributed made a smaller reciprocal adjustment than players whose contribution had been above the mean. This is consistent with Inequity Aversion.
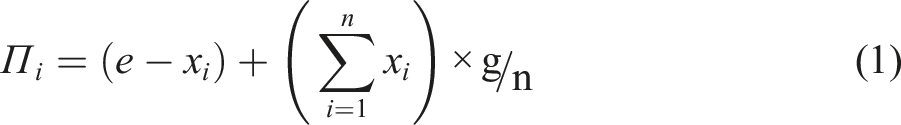
Inequity Aversion (Ashley et al., 2010; Fehr & Schmidt, 1999) appears cross-cultural in our data. Table 4 shows that consistent with Fehr & Schmidt and many other studies since, players in both countries reciprocate asymmetrically: Comparing the coefficients for “Over-contribution” and “Under-contribution”, the downward adjustment after over-contributing at Round (t-1) relative to the other group members is two to three times as large as the upward adjustment after under-contributing. In Iceland under community feedback there is no upward adjustment at all. This difference in the size of upward and downward adjustments can be accounted for by the alignment, or lack thereof, between two motives: Under-contribution is congruent with self-interest but runs counter to reciprocity/fairness; over-contribution runs counter to both motives (see equation (1)). It will be interesting to eventually see whether Inequity Aversion is a human universal.
Result 10:
In both locations, subjects consider the frequency of zero contributors in the session if this information available.
Under community feedback, subjects in neither country considered the central tendency of everybody’s contribution in the preceding round. They instead relied on a simpler metric, the count of zero contributors in Round (t-1). The associated coefficients (Table 4) are highly significant in both cultures, and not culturally different (Table 5). The more zero contributors a subject observed the more she reduced her contribution in the round that followed. Subjects might have gone with an absolute count rather than the value of the minima or maxima because their variability was low, 41 so that their value would have provided little reason to adjust one’s contribution in the round that followed.
Result 11:
Under community feedback, US subjects make stronger reciprocal adjustments than Icelanders do.
Table 5 shows that if informed of the actions of everybody in the session, US subjects make stronger adjustments following their under-contribution or over-contribution in the preceding round than Icelanders do. The coefficient difference is not significant under group feedback but is significant under community feedback. The coefficient difference is further support for Hypothesis 2 that Americans think differently about cooperation than Icelanders do.
Result 12:
Icelandic subjects have a stronger disposition to contribute unconditionally.
The intercepts capture cooperative tendencies absent of experience, individual cooperative style (captured by contribution in Round t-1), or knowledge of others’ actions. The country difference between the intercepts is statistically significant and substantial in both treatments (Tables 4 and 5). Pairwise comparisons of the intercepts between feedback treatments but within cultures reveal no significant within-culture differences (
Discussion
Results Summary
Cross-Cultural Similarities
We had not hypothesized about cross-cultural similarities but found some, including behavioral consistency over rounds (Result 7), being guided by other group members’ contributions (Result 8) as well as the count of non-contributors in the wider social unit (Result 10), and maybe most interestingly, Inequity Aversion (Result 9). It remains to be seen whether these commonalities are ultimately culture-specific and shared between the US and Iceland, or whether they are human universals.
Our Findings and Alternative Scales of National Culture
Group-Grid Cultural Theory
As stated earlier, the US and Iceland differ strongly on all measures of national culture known to us. This includes Grid/Group (GG) cultural theory (Douglas & Wildavsky, 1983). A high Group score reflects a higher value placed on the interest of the collective than the individual; A low Group score indicates an individually competitive culture. In a study of European nations Grendstad (1999) finds that all Nordic countries score high on Group with Iceland the highest. The US are not part of his study. In a critique of various and diverse GG operationalizations, Maleki and Hendriks (2015) point out their diversity and lack of consistency, and that Group is operationalized either as collectivism/groupishness, or as broader collaborativeness, with Grendstad’s operationalization probably the latter: Grendstad’s Group score is based on two WVS items, about voluntary membership in organizations, and volunteering.
Chai et al. (2009) 44 as well as Chai (undated WP) 45 operationalize GG based on an entirely different and broader (22 total) set of WVS items where Group captures interpersonal trust, the value placed on relationships, and distributive political attitudes. They report a low Group score for the US and again, high Group scores for Nordic countries including Iceland. In experiments, Chai et al. (2011) find that among their subjects, higher individual Group scores are associated with higher contributions in a standard VCM with group-level feedback.
Since Group is operationalized in different ways and preferring to err on the side of caution, we did not base any hypotheses on GG. Ex-post our results, both the culturally different responses to the community priming and the differences in the weight of unconditional cooperation, suggests an association between Grendstad’s (1999) group measure on the one hand, and unconditional cooperation and sensitivity so the “society frame” on the other hand. Based on Chai et al.’s prior experimental findings one would predict that Icelanders collaborate more than US subjects in the standard group-feedback VCM, and this was not replicated. There are many open questions here that are beyond the scope of a single paper.
Hofstede’s Dimensions
Hofstede’s (2001) dimensions of national culture also suggest behavioral differences between the two cultures, but again in a complex way that requires a separate study: Icelandic culture is much lower than the US’ both on Masculinity and Individualism (see https://www.hofstede-insights.com/country-comparison/). Both dimensions have been linked to VCM contributions by Blackwell and McKee (2010). As Blackwell & McKee’s data, our data also do not allow to isolate the separate impact of these dimensions. All one can say is that based on these prior findings, Icelandic subjects are expected to cooperate more than US subjects.
Conclusion
Our findings contain broad suggestions for practice: Appeals for efficiency-enhancing cooperative behavior should be culturally tailored. In the case of the two cultures studied here, Icelanders probably respond best to moral suasion aimed at a sense of community and social obligation while Americans should be more responsive to appeals to reciprocity and fairness. This is indicated by differences we uncovered in the underlying motives for cooperation, as well as by the finding that a wider community focus (effectively, a distraction from the directly cooperating group) increases cooperation in Iceland but decreases it in the US.
While to the best of our knowledge the finding about cultural differences in thought processes is new it is not unexpected: Culture reflects a society’s history and is often persistent (e.g., Putterman & Weil, 2010; see Gershman, 2017, for an overview). The differences in motives to cooperate that we found appear to fit with the two nations’ longstanding demographic, social and geographic conditions: In a large, heterogeneous, and highly mobile population such as the US, unconditional cooperators benefit less from being known as such. It would make them vulnerable to rational free riders who are unconcerned about the long-term reputational impact of their selfish acts because they can easily move away. In a large mobile society keeping a close eye on others’ cooperative input and directly reciprocating others’ action is both individually and collectively functional. Iceland’s small homogenous population has historically been stationary on an island. Even people who do not personally know each other often at least know about each other. Reputation or “image scoring” (Nowak & Sigmund, 1998; Wedekind & Milinski, 2000) matters for success in a small, relatively isolated society. A heuristic to cooperate unconditionally is functional there, both for the individual and the collective.
Further Research
The Performance of Western Versus East Asian Cultures
The West and East Asia are culturally even more different than Iceland and the US. Their different cognitive and perceptual habits are well demonstrated (see Nisbett & Masuda, 2003, for an overview). One region is highly individualist the other collectivist (Hofstede et al., 2010). However, multiple experimental studies (VCM Experiments Where No Cultural Differences were Found) report similar cooperation levels in these two cultural areas. It would therefore be interesting to compare which factors impact VCM contributions in the West and East Asia. Since many VCM experiments have been run with reciprocity focused US subjects it remains to be seen whether reciprocity is as common as hitherto assumed or whether there exist other equally effective cultural norms that encourage voluntary cooperation.
Culture Versus Human Universals
Finally, since we also find cross-cultural commonalities in how cooperation decisions are processed across the two cultures (Inequity Aversion, personal consistency) it would be worthwhile to explore whether and to which extent these patterns are human universals or ultimately a feature of culture.
Supplemental Material
Supplemental Material - Reciprocity or Community? Different Cultural Pathways to Cooperation and Welfare
Supplemental Material for Reciprocity or Community? Different Cultural Pathways to Cooperation and Welfare by Anna Gunnthorsdottir, Palmar Thorsteinsson, and Sigurdur P. Olafsson in Cross-Cultural Research
Footnotes
Acknowledgments
The authors thank Lee Cronk, Saura Masconale, Mary Rigdon, David Schmidtz, Tiemen Woutersen, Skip Faith, and Gylfi Zoega for helpful comments.
Author Note
An earlier version was presented in the Center for the Philosophy of Freedom seminar series at the University of Arizona on April 15, 2021.
Declaration of Conflicting Interests
The author(s) declared no potential conflicts of interest with respect to the research, authorship, and/or publication of this article.
Funding
Supplemental Material
Supplemental material for this article is available online.
Notes
Author Biographies
References
Supplementary Material
Please find the following supplemental material available below.
For Open Access articles published under a Creative Commons License, all supplemental material carries the same license as the article it is associated with.
For non-Open Access articles published, all supplemental material carries a non-exclusive license, and permission requests for re-use of supplemental material or any part of supplemental material shall be sent directly to the copyright owner as specified in the copyright notice associated with the article.