
Abstract
Online grocery in China is on the rise. With large differences in brands’ abilities to secure a portion of China’s online pie, a key question is what drives these differences. The authors derive how a brand’s total sales change as the online grocery share goes up, and they show that it depends on two indices: (1) the brand’s online index (brand’s online category share relative to its offline category share) and (2) the category’s online index (category’s grocery share online relative to its grocery share offline). The authors then identify brand and category factors that drive these indices. They estimate their model on 448 brands in 60 product categories in China using 2011–2015 data. Their analyses show that the brand online index mainly increases with higher levels of online availability, lower online-to-offline price ratios, and for “trusted,” less “fun” brands. As for the category online index, expensive, less frequently bought categories benefit from the shift toward the online channel, whereas the opposite holds for perishable and heavy categories.
Digital disruption is changing the way brands are sold to consumers (Gielens and Steenkamp 2019). One development that offers both great potential as well as poses significant challenges to brands is the rise of the digital (“online”) sales channel (Steenkamp 2020). In many industries ranging from books and apparel to electronics and music, online sales account for a large portion of total brand revenues (Web Retailer 2019). One industry in which online sales are lagging is grocery (foods, beverages, personal care, household care, and pet care). In 2018, online grocery sales accounted for 5.0% of total grocery sales in Germany, 7.2% in the U.K., 6.5% in France, and 4.9% in the United States. In China, the situation is very different—in 2018, online grocery accounted for 32.5% of all grocery expenditures, up from 1.4% in 2010. 1 Although in many marketing domains China is an economic follower (Kumar and Steenkamp 2013), when it comes to online grocery, China is leading the way.
Studying the Chinese online versus offline grocery scene is interesting for at least three reasons. First, what are the key factors driving online brand success in this sophisticated grocery market? What can marketing academics and practitioners learn from China? Second, China is similar to other emerging markets in that its offline (brick and mortar) retail infrastructure is relatively underdeveloped. Between 2014 and 2018, online grocery revenues increased on average by 35.1% per year in China, whereas the annual growth rate of offline grocery formats varied between −5.7% and 3.7% 2 (Bain & Company and Kantar Worldpanel 2019). The success of the online channel suggests that China is leapfrogging over the Western brick-and-mortar infrastructure of sophisticated supermarkets and hypermarkets such as Kroger, Tesco, Carrefour, and Walmart. China has moved directly from an unsophisticated distribution infrastructure to ecommerce, providing a distribution model that other emerging markets whose offline infrastructures are even less developed (Steenkamp 2017) can follow. Third, insights into brand success in the online world in China are important in their own right. After all, China has emerged as the second largest economy in the world (The World Bank 2019), and many Western grocery companies, from Coca-Cola, Procter & Gamble, and Colgate-Palmolive to Nestlé and Unilever, heavily depend on China for revenue.
For grocery brands, it is unclear how this increase in online grocery share in China will affect revenue. Industry analysts point to growth opportunities (“Online shoppers spend more”; Kantar Worldpanel 2015, p. 11) and contend that for grocery brands to keep thriving in China, they should grow with the winning (online) channel (Bain & Company and Kantar Worldpanel 2019). However, which brands will benefit—or suffer—from the rise of online grocery, and why, is not clear. Stark differences exist in online versus offline performance between brands. Whereas some brands appear to hold similar market shares online and offline, others enjoy a dominant position in their category in the offline channel but do not seem able to capture a large portion of category sales in the online channel, or vice versa (Kantar Worldpanel 2015). Moreover, offline versus online category sales themselves appear to evolve differently as online increases in popularity (Bain & Company and Kantar Worldpanel 2019). What drives these differences? How can brand managers increase the chances of being on the winning end?
The factors that will influence brands’ online relative to offline sales performance are not immediately clear. Academic studies to date have investigated grocery brand success in both channels but have focused on nonmonetary metrics like loyalty (Danaher, Wilson, and Davis 2003) or have considered online and offline choice shares for only a small set of categories and brands (Chu, Chintagunta, and Cebollada 2008; Degeratu, Rangaswamy, and Wu 2000). Moreover, most of these studies have only focused on a small set of drivers such as price (Chu, Chintagunta, and Cebollada 2008) or package size (Chu, Arce-Urriza, Cebollada-Calvo, and Chintagunta 2010). Although Campo and Breugelmans (2015) looked at a large set of marketing mix instruments and intrinsic market characteristics, they focused on the online versus offline performance of categories, not brands. In addition, these studies have almost exclusively focused on Western markets. So, ironically, they missed out on testing ideas in the lead market.
The current study aims to fill this gap by answering two research questions. First, how do a brand’s sales in China change as the share of grocery sold online goes up? How can brand managers assess whether they are doing well or are lagging? We show that brand success in the combined online/offline world critically depends on two indices; namely, the brand online index (BOI), which is the brand’s online category share relative to its offline category share, and the category online index (COI), which is the category’s grocery share online relative to its grocery share offline. BOI and COI can be used by managers as metrics of their “value at risk” in a world where the online channel is becoming more important. Second, what are the drivers of BOI and COI? We consider a comprehensive set of brand and category characteristics organized around the 4 Ps. We seek to determine which factors matter most and how brand managers can use these insights to their advantage.
We derive BOI and COI and empirically test the impact of various drivers on these metrics using a unique dataset that tracks the purchases of 40,000 urban Chinese panelists for over 440 grocery brands in 60 categories. We combine scanner data covering five years (2011–2015) with consumer survey data for a subset of brands, expert surveys, and brand advertising expenditures.
The remainder of this article is structured as follows. First, we formally derive the link between brands’ sales change as the overall share of grocery sold online goes up and their BOI and COI metrics. We then conceptualize what brand and category factors influence these metrics, highlighting the unique character of the Chinese grocery market, by including variables such as foreign brand ownership and local cultural embeddedness. These factors are important for increasing understanding of the Chinese grocery market but are not generally regarded as key factors in Western grocery markets. Then, we discuss the methodology to estimate these effects, followed by a description of our empirical setting and data. Having presented the estimation results, we discuss implications and directions for future research.
Research Framework
The focus of this study is twofold. First, we derive the condition under which total brand sales go up (or down) with the rise of the total share of grocery sold online. We decompose this condition into its underlying components and show that it critically depends on the product of two metrics: BOI and COI. Next, we quantify the impact of brand factors on BOI and of category factors on COI. Figure 1 provides the research framework that guided our study. It specifies overall brand performance as a function of BOI and COI. Furthermore, it identifies brand and category factors that are categorized along the 4 Ps, where we split the P of product between brand and other product factors and provide their expected effects on BOI or COI.
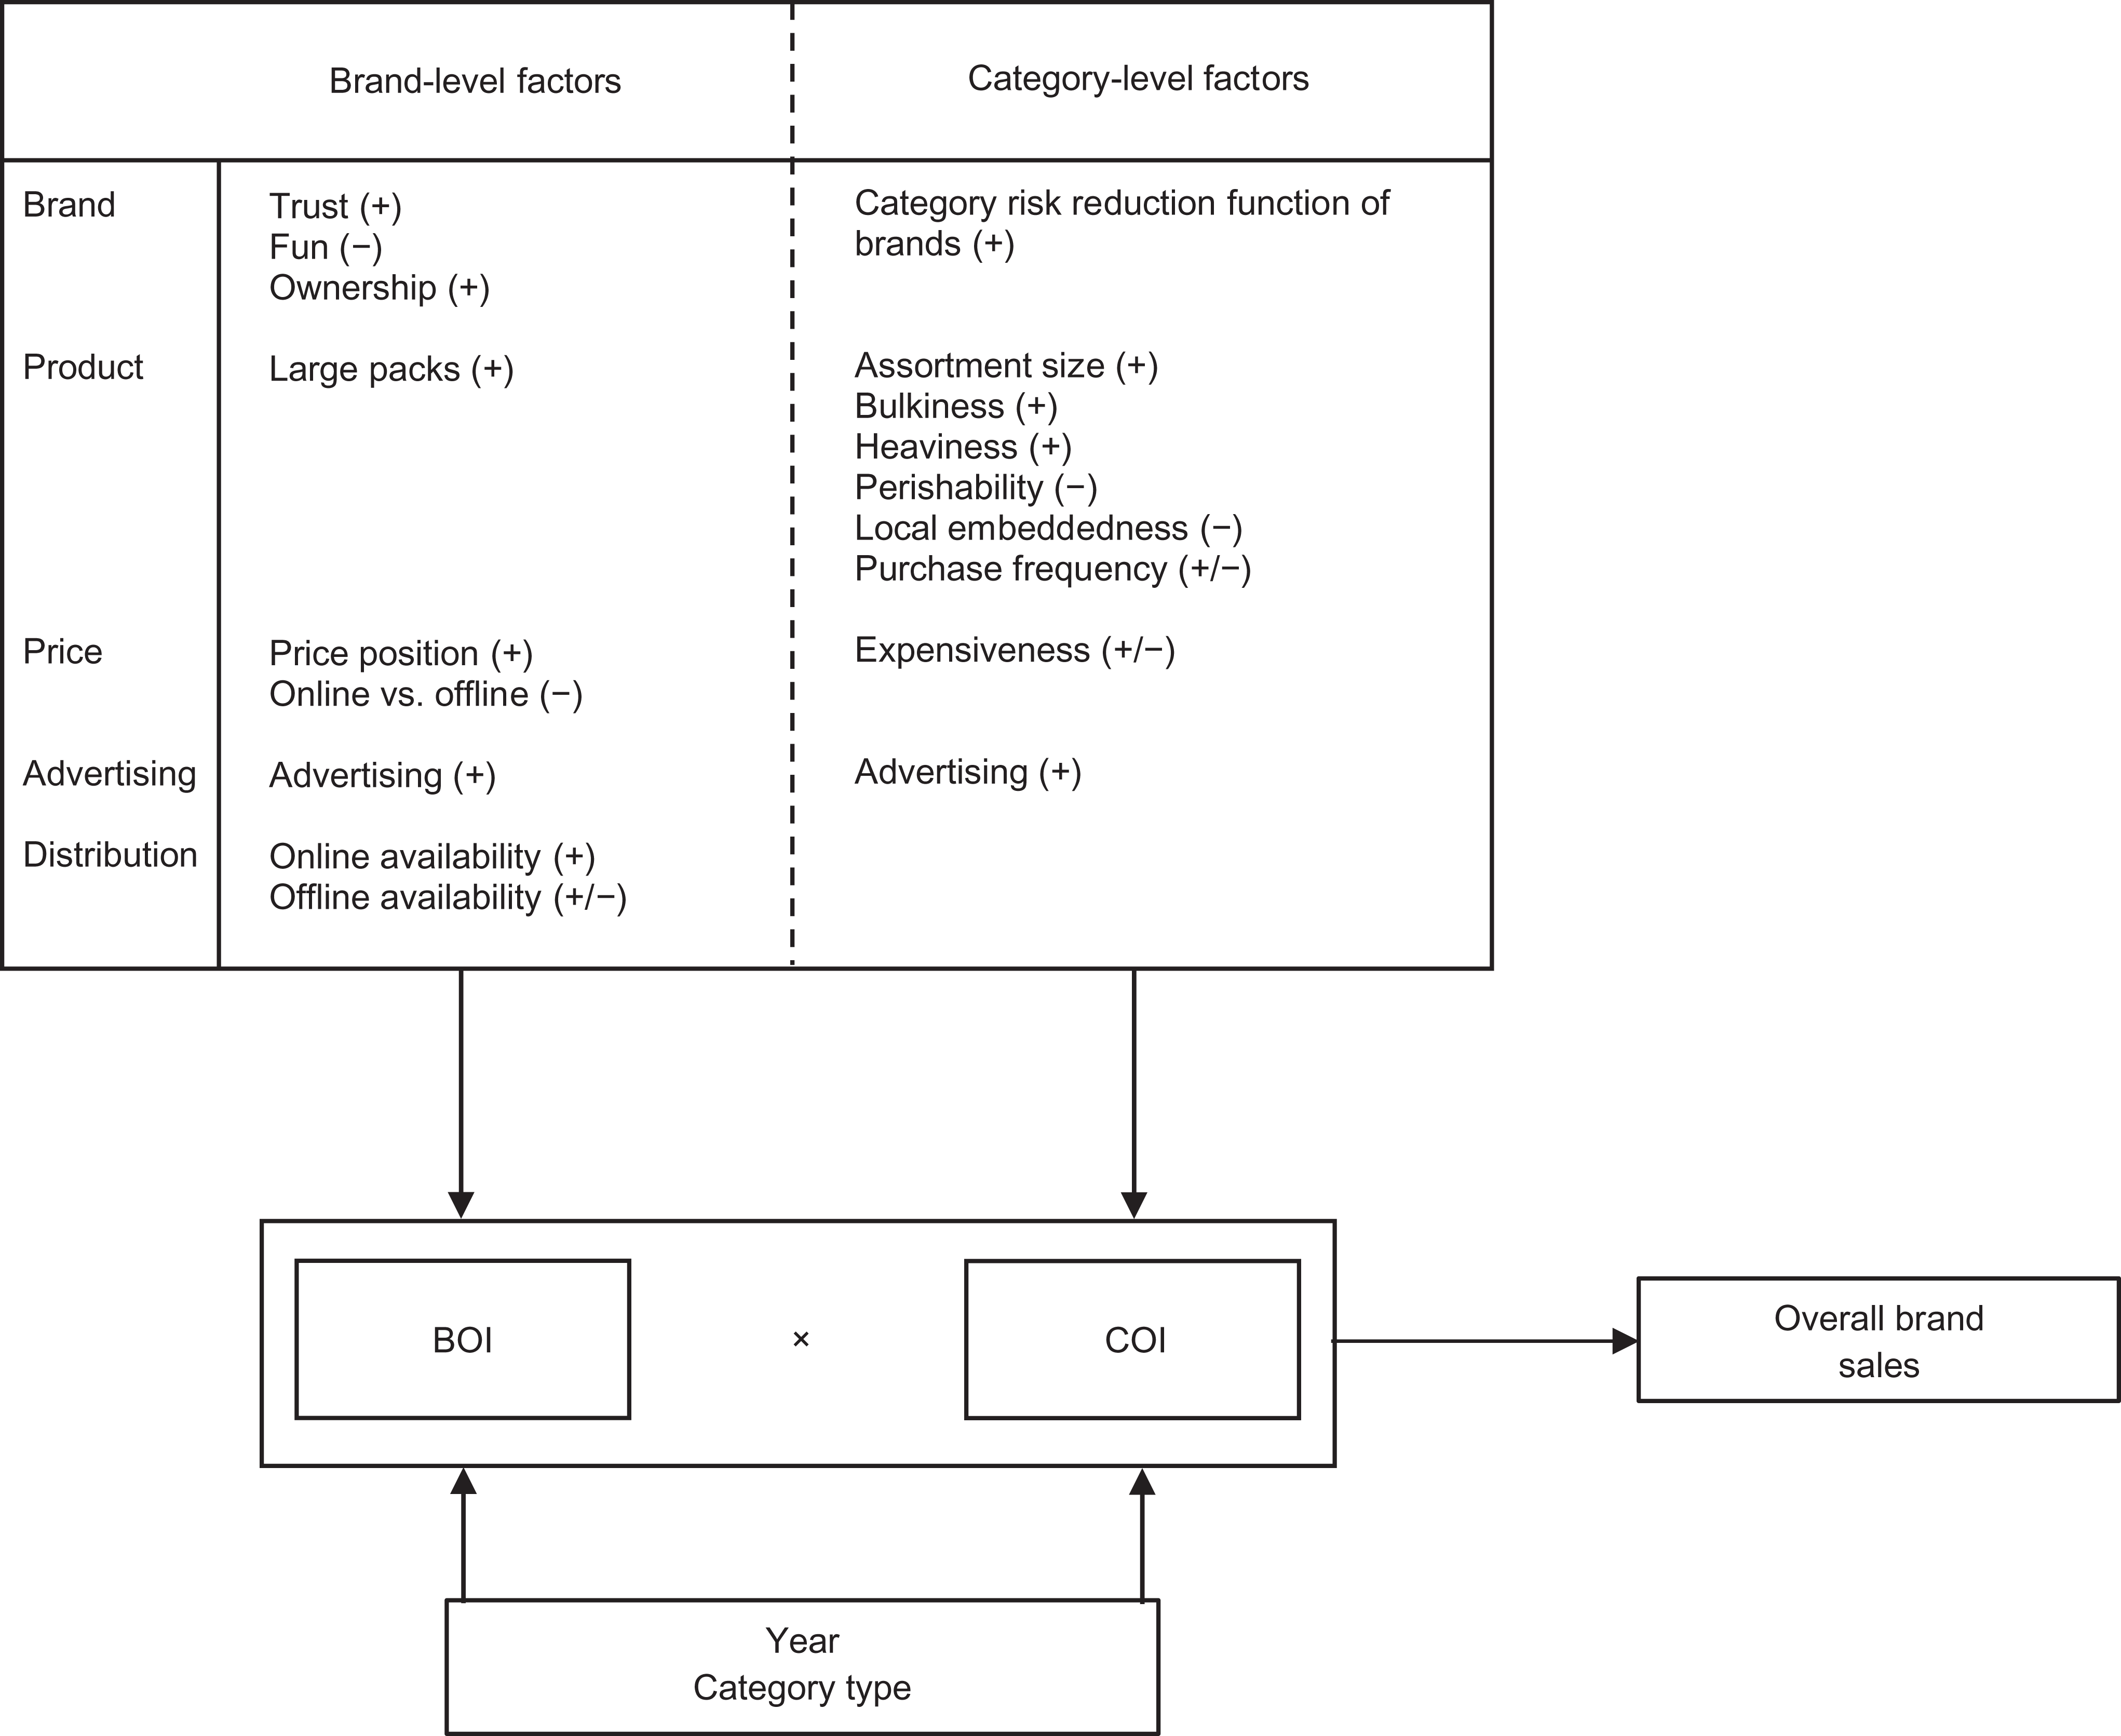
Research framework.
The Role of BOI and COI
We are interested in how total brand sales evolve with the advent of the online channel. This will depend on the brand itself and on the category it operates in. Moreover, when quantifying the effect of the growth in online grocery on total brand sales, it is important to consider that the trend toward the online channel might lead to a change in the overall grocery business. That is, the online channel could have an effect on total grocery sales: Because of the new channel, people may buy more (expansion), or buy less (contraction). Expansion could occur for example because people have better or easier access to (more) products via the online channel, whereas contraction could occur for example because, with regular home deliveries, time-constrained people can manage their inventories better, leading to less waste. In Western countries, either expansion or contraction might occur. However, in China and other emerging markets where the offline retail infrastructure fails to adequately reach many consumers, expansion is far more likely. Our analysis accommodates both possibilities.
Our key question is: How does a change in the share of total groceries sold online influence brand sales? To address this question, we express the total sales (online plus offline) of a brand in a given category as a function of the total online channel share. We then obtain the derivative (i.e., the marginal change in total brand sales following a marginal increase in online grocery share) and identify under what conditions it will be positive. In Appendix A, we prove that total sales of a brand will increase with the rise of the online channel if:

where b is the brand indicator, c is the category indicator, t is the period indicator (e.g., year), and
Equation 1 indicates that an increase in the online grocery share will affect total brand sales through (the product of) two key metrics: BOI and COI. BOI higher (lower) than 1 indicates that the brand’s relative position vis-à-vis competing brands in the category will improve (deteriorate) with the rise of the online channel, and COI higher (lower) than 1 indicates that the category will achieve a larger (smaller) portion of consumers’ grocery wallet as the online channel grows. As Equation 1 shows, the critical value for
Apart from the mathematical logic, looking at BOI and COI also makes intuitive sense when one is interested in how a brand’s overall performance will improve in a world where the online channel is growing. That is, selling through a channel that is growing is important when a brand’s aim is to (at least) maintain sales. First, a brand that operates in a category that sells relatively more through the offline than the online channel (i.e., COI is smaller than 1, for example because people perceive a lack of control when buying the category online) may be at risk because the total pie shrinks. For example, instead of buying fresh milk, consumers shopping online may choose long-life milk because they believe it is the safer option when buying milk through the online channel, reducing the potential for fresh milk brands. Second, for brands that sell relatively more through the offline than the online channel (i.e., BOI is smaller than 1, for example because the brand offers only a few stockkeeping units [SKUs] online), growth of the online channel represents a threat (e.g., because consumers buy a product of a competitor within the category that offers many more SKUs online). In both cases, brands lose sales to competitors as consumers gravitate to the online channel—unless these brands take appropriate action.
In addition to keeping track of the product of BOI and COI, it intuitively makes sense to monitor these indices separately as well. A low BOI will not lead a manager to believe that the rise of the online channel is necessarily a problem if the category’s COI is high. After all, a high COI may compensate the low BOI such that the brand may still benefit from the online trend. By contrast, a large BOI will also not lead a manager to draw the shortsighted conclusion that the online channel automatically brings prosperity, as a low COI may actually result in the brand losing sales as online grows.
Drivers of BOI
Brand characteristics
Holbrook and Hirschman (1982) already distinguished between the cognitive and the experiential aspects of brands and brand consumption. We tap into the cognitive aspect of brands using brand trust (Chaudhuri and Holbrook 2001; Rajavi, Kushwaha, and Steenkamp 2019), and we capture the experiential aspect with the construct of brand fun (Holbrook and Hirschman 1982). Hernandez (2002) argues that brand trust plays a particularly important role in the decision process of online consumers. We expect more trusted brands to have higher BOIs. Furthermore, the more fun a brand is perceived to be, the more (fewer) emotional (functional) benefits a brand has to offer (Steenkamp 2014). As the more “functional” shopping environment will make people buy less on impulse online (Campo and Breugelmans 2015), we expect fun brands to have a disadvantage online compared to offline. Therefore, we postulate that brands perceived as being more “fun” will have lower BOIs.
Foreign-owned brands are brands owned by a manufacturer that originates from outside China, whereas locally owned brands are owned by a Chinese manufacturer. E-commerce retailers such as JD.com and Alibaba let brands pay for prominence, using banners to assure consumers of the brand’s authenticity (Kantar Worldpanel 2015). Because overseas manufacturers like P&G, Unilever, Nestlé, Kellogg, and others have typically deeper pockets than local players, they are able to secure better online presentation and support than local players (cf. Gielens and Steenkamp 2019). Thus, we expect that brands owned by a foreign company will perform relatively better online than brands owned by a local player.
Product
Brands that offer larger package sizes than usually sold in the category are expected to have an advantage in the online channel (and a higher BOI). Ordering online (and having the products delivered at home) avoids the physical burden of handling large package sizes. Therefore, we expect large packages to be relatively more appealing in an online setting (Campo and Breugelmans 2015; Chu, Chintagunta, and Cebollada 2008). Moreover, people may find it hard to estimate the real size of a package from a screen, which, according to Burke et al. (1992), results in customers purchasing larger sizes more frequently online.
Price
The online channel facilitates price search, potentially stimulating consumers to engage in price comparisons and get better deals (Chu et al. 2010; Lynch and Ariely 2000). Also, consumers may be less inclined to pay a high price (and run a financial risk) online because it is harder to gauge the quality of items from a distance. At the same time, empirical evidence suggests that consumers actually tend to be less price sensitive online than offline (e.g., Chu, Chintagunta, and Cebollada 2008; Degeratu, Rangaswamy, and Wu 2000; Lynch and Ariely 2000). This may be because they are more convenience-oriented than price-oriented, or because they use price as a quality signal to make up for not being able to physically inspect the product. Moreover, premium-priced brands may better cater to the needs of online shoppers in China, who are characterized as aspirational, higher-income shoppers (EMR 2019; IGD 2017). Considering this evidence, we anticipate that more expensive brands will have higher BOIs.
Common knowledge dictates that for a given brand, charging higher prices online than offline is expected to result in lower performance online relative to offline. Even if price sensitivity is lower in an online than in an offline setting (Chu, Chintagunta, and Cebollada 2008; Degeratu, Rangaswamy, and Wu 2000; Lynch and Ariely 2000), this does not mean that online shoppers do not pay attention to price at all. Given that the online channel facilitates price search (Häubl and Trifts 2000), consumers may notice online versus offline price differences for a given brand and act upon them. Industry reports highlight that, indeed, finding lower prices online than in store is one of the motivations for Chinese consumers to shop online (China Internet Watch 2015; Kantar Worldpanel 2015). Thus, we expect the online-to-offline price ratio of a brand to have a negative effect on BOI.
Advertising
Though the online environment generally provides consumers with easily accessible information (Shankar, Smith, and Rangaswamy 2003), information on sensory attributes (like freshness) or more abstract attributes (like quality) may be less available, which may increase perceived risk (Danaher, Wilson, and Davis 2003; Degeratu, Rangaswamy, and Wu 2000). One way to reduce this kind of risk is to signal quality through advertising (Erdem, Keane, and Sun 2008). We therefore expect brands that are supported by heavy advertising to be more successful online.
Distribution
We distinguish between availability in the online and offline channels. For most grocery brands, being available in a large number of online stores or marketplaces will, most likely, strongly drive online sales but not enhance offline performance. Thus, increasing online availability will be an important driver of BOI. The effect of offline availability on BOI is less clear upfront. On the one hand, being highly visible in offline stores might aid performance in the online channel (the so-called billboard effect, Avery et al. 2012). Indeed, research has shown that brands with a strong offline presence do better in the online environment (Danaher, Wilson, and Davis 2003). This may hold especially in the Chinese market, where the lack of market efficiency and prevalence of counterfeiting makes consumers more risk-averse (Kantar Millward Brown 2010) and brand familiarity may dampen the risk of purchasing online. On the other hand, substitution effects may occur in that widespread offline availability might reduce the consumer’s propensity to buy the brand through the online channel. Which of these forces prevails is not clear up front, so we leave the impact of offline availability on BOI as an empirical question.
Drivers of COI
Brand characteristics
When buying from a category, consumers may choose well-known, trusted brands to reduce the risk of making the wrong purchase. The category risk reduction function of brands measures the extent to which a category’s brands reduce the consumer’s (perceived) risk of making a purchase mistake (Fischer, Völckner, and Sattler 2010). Categories that score highly on this construct (i.e., in which brands strongly act as “risk-reducers”) should benefit in the digital channel because many consumers shop online to find high-quality, branded products (Bain & Company and Kantar Worldpanel 2015), and with less available information about other attributes (Degeratu, Rangaswamy, and Wu 2000), consumers rely more heavily on brand names. Thus, we expect these categories to have a higher COI.
Product
We expect categories with large assortments to do especially well in the online channel. Kantar Worldpanel (2015) reported a “wider range” as one of the most important motivations for Chinese shoppers to make online purchases. Consumers can enjoy the benefit of product variety in the online channel while being less likely to experience choice overload than in the offline channel. Search costs for products and product-related information are much lower online (Lynch and Ariely 2000), and consumers have several tools at their disposal (e.g., search bars, filters) to reduce their consideration set and identify the product that best satisfies their needs with relatively small effort (Häubl and Trifts 2000). Therefore, we expect that the larger a category’s assortment size, the higher its COI.
Categories that consist of bulky products (e.g., paper towels) or heavy items (e.g., cooking oil) are generally found to have an advantage in the online channel (Chu, Chintagunta, and Cebollada 2008). Customers are more likely to purchase these categories online for convenience reasons, as consumers can, for a large part, outsource the handling and transportation of the products from the store to their homes (Campo and Breugelmans 2015). As a result, we expect bulky and heavy categories to have larger COIs.
Frequency of product purchase may have a dual impact on COI. On the one hand, grocery websites often create custom-made shopping lists for consumers on the basis of previously bought items. According to Kantar Worldpanel (2015), these online shopping lists are quite popular: more than half of online shoppers use them. On the one hand, frequently bought items may be more likely to show up on users’ online shopping lists, therefore making it more likely for users to purchase such items online. On the other hand, to avoid delivery fees, consumers may predominantly shop online for large-basket, stock-up trips, including a larger proportion of less frequently needed products. Moreover, online shopping may reduce the purchase of unplanned items (Babin and Darden 1995), which typically belong to categories with low interpurchase times (Inman, Winer, and Ferraro 2009). Because of these countervailing forces, we have no a priori expectation regarding the effect of purchase frequency on COI.
Consumers might feel a stronger need to physically inspect products from perishable rather than nonperishable categories prior to purchase. For example, shoppers may want to choose cheese that looks “fresh” or buy milk with an expiration date that is still remote. Because the online setting offers no opportunity for physical inspection, consumers are more likely to buy perishable products offline (Chu, Chintagunta, and Cebollada 2008). As a result, we expect perishable categories to have lower COIs.
A final product factor we consider is local embeddedness, which reflects the extent to which consumers perceive the product as typical for, or originating from, China. Examples include tea and baijiu (a distilled alcoholic beverage, Moutai being the most famous brand). These categories have been around for centuries and are more deeply embedded in Chinese society than, for instance, coffee or wine. We expect less locally embedded categories to better fit with the online channel than more locally embedded categories. The online channel is still relatively new. People that score highly on innovativeness are more likely to both adopt new channels (Arts, Frambach, and Bijmolt 2011) and be more open to trying products from categories that are less ingrained in their culture. In addition, Chinese people use the online channel to explore and discover new products (BCG 2017; IGD 2017), which is something less locally-embedded categories may benefit from. In summary, we expect categories with high local embeddedness to have a lower COI.
Price
The average amount paid on a typical category purchase (Lourenço, Gijsbrechts, and Paap 2015) can have a dual effect on online relative to offline performance. On the one hand, buying expensive categories online (where the possibilities for physical inspection are limited) may be riskier. On the other hand, expensive categories may more easily justify the payment of a fee associated with online ordering and home delivery. Moreover, online shoppers in China tend to be more aspirational and well-off (EMR 2019; IGD 2017). As such, they may be more inclined and able to afford expensive categories than offline shoppers.
Advertising
Heavily advertised categories are expected to do relatively better online. Advertising messages may reduce perceived category risk and make consumers rely more strongly on the brand cues available in an online setting. So, we expect higher COI for categories with high advertising spending.
Data
We obtained our data through Kantar Worldpanel, Kantar Media, and GfK. The purchase data come from a Chinese urban household panel (n = 40,000) that tracked the panelists’ purchases made through the online and offline channel in 62 grocery categories between 2011 and 2015 (all categories were sold online during these years). For every category, we select brands that belong to the top 10 in at least one of the five years, dropping 13 brands with “holes” in their time series (e.g., for which we observe sales in 2011–2012 and 2014–2015 but not in 2013). This leaves us with 617 brands in 62 categories. Across the years, 32 brands in our set entered their category and 13 left. We use the first year of a brand’s data as an initialization period, and the remaining years belong to the estimation sample. For each brand and category, we obtained monthly advertising spending data at the brand level as well as the total category level.
To estimate our BOI and COI models, we retain brands that meet two criteria. First, to avoid problems due to data sparseness, we select brands with an overall (i.e., offline and online combined) volume share within the category of at least 1% in the estimation sample. Second, the brand needs to have both offline and online presence in the estimation sample. We retain brands sold through both channels for at least two consecutive years. 3 This leaves us with 448 brands in 60 categories. The majority of brands are present for all four years of the estimation sample (for only 35 brands, we have less than four years of data) 4 .
Next to the purchase and marketing mix data, 45 categories and 154 brands in 43 categories were part of a consumer survey administered by GfK in 2014 to 2,764 urban Chinese consumers. Four risk reduction items, as well as the trust and fun constructs, were part of the survey (and are available for those brands and categories only). On average, 92 respondents rated each category and brand. For an overview of the (survey) categories and number of selected (survey) brands per category, see Web Appendix A. Finally, we surveyed experts about characteristics of all 62 categories, namely local embeddedness and perishability. We use these consumer and expert survey measures, averaged across respondents, to quantify the corresponding drivers of COI and BOI.
Measurement
Table 1 provides details on the operationalization of the variables. To calculate BOI, we use online and offline market share based on volume sales (e.g., milliliters, grams). Because some brands have zero online sales in some years (and thus a BOI equal to zero), we add the value 1 and multiply with 100 before log-transforming. To calculate COI, online and offline market share are based on volume sales expressed in “equivalent monetary value” (cfr. Ma et al. 2011) to ensure comparability across categories. Specifically, we multiply the volume sales (e.g., milliliters for shampoo, grams for potato chips) with the average price per volume unit in the category across 2011–2015.
Description of Variables Used in the Main Study.

a A “typical” package in the category means the total volume (e.g., milliliters) bought divided by total units bought in the category during a shopping trip, averaged across all observed shopping trips.
b In total, Kantar Worldpanel distinguishes eight regions in China.
c Because sales are expressed per volume unit and volume units differ across categories (e.g., milliliters for shampoo, grams for potato chips), we express category volume sales in monetary values to ensure comparability across different categories (see also Ma et al. 2011). To obtain volume sales in monetary value, we multiply the volume sales with the average price per volume of category c across 2011–2015 (note that for brands, we do not express volume sales in equivalent monetary values, as it would not change our BOI measure).
d A “typical” quantity in the category means the total volume (e.g., milliliters) bought in the category during a shopping trip, averaged across all observed shopping trips.
e Because category rotation and manufacturer power have skewed distributions, we use a log transform.
We provide data descriptives in Table 2. Web Appendix B provides correlations among the drivers. There is relatively little overlap among the (brand and category) drivers, making them suitable for our model estimation.
Data Descriptives.

a For the brand–year (category–year) combinations, the number of observations equal to 1,746 (240) represent all 448 brands (60 categories) used in our main analyses. The number of observations equal to 611 (180) represent the 154 (45) survey brands (categories).
b Adstock in ¥100,000 s.
c In 100 s.
Methodology
Model Setup
To test our hypotheses, we run regressions with the logarithm of BOI and COI as the dependent variables and the brand and category drivers from Figure 1 as explanatory variables. 5 For BOI, we estimate the following model:

where
trb = trust brand b;
fub = fun brand b;
fbb = ownership brand b (equal to 1 if foreign and to −1 when domestic);
labt = brand b’s % large packages in year t;
ppbt = price position brand b in year t;
rpbt = ratio of online to offline price of brand b in year t;
adbt = adstock brand b in year t;
avon bt = online availability of brand b in year t;
avoff bt = offline availability of brand b in year t;
copulakt = gaussian copula for driver k in year t;
yeart = year dummy (equal to 1 for year t, and −1 otherwise);
cattypecb = category type dummy (equal to 1 if brand b’s category c is in category type p, and −1 otherwise); and
εbt = normally distributed error term for brand b in year t.
For COI, we estimate the following equation:

where
rrc = risk reduction function of brands in category c;
asct = category c’s assortment size in year t;
buc = bulkiness category c;
hec = heaviness category c;
pec = perishability category c (equal to 1 if perishable, and to −1 when nonperishable);
lec = local embeddedness category c;
frc = average yearly purchase frequency category c;
cxbt = expensiveness category c in year t;
adct = adstock category c in year t;
copulakt = gaussian copula for driver k in year t;
yeart = year dummy (equal to 1 for year t, and −1 otherwise);
cattypec = category type dummy (equal to 1 if category c is in category type p, and −1 otherwise); and
μct = normally distributed error term for category c in year t.
Selection Model
Our BOI and COI models are estimated on brands that are already present online. However, this is not a random sample, as brands that already expect to do well digitally are especially likely to enter the online channel. Although the focus of this article is not on why certain brands are online and others are not (yet), failure to control for this can result in biased parameter estimates in our focal models. We resolve this through the control function approach (Dubin and McFadden 1984). In a first step, we estimate a binary logistic selection model that explains whether and when brands are offered online using observations on all brands available in the data set. The probability that brand b in category c is or goes online in year t is given by:
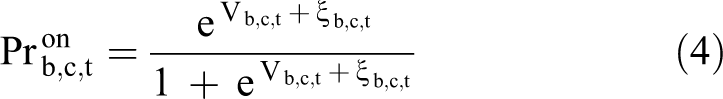
where
Equation 4 shows that we include variables used in the main models (lagged one period and excluding the survey constructs that are available for only a subset of brands and categories) and three variables that serve as exclusion restrictions. As exclusion restrictions, we use variables related to the costs/difficulties of (offline and online) presence; namely, category rotation (roct − 1), whether the brand is sold nationally in China or only regionally (rbb), and manufacturer power (pob). Category rotation reflects the costs/difficulties of getting the products on the physical store shelves. For regional brands, the impact could go both ways: although home delivery may be more costly than it would be for national brands because of more regionally concentrated warehouses, the online channel may—in the end—provide a unique opportunity to expand their distribution at relatively low cost. As for manufacturer power, manufacturers that are present in multiple categories may have easier access to the retailers’ physical stores (and therefore may have to rely less on the online channel, a negative impact), but they may also be able to get better deals with the large online retailers or benefit from economies of scope when it comes to home delivery (making them more likely to go online). Though these factors are likely to drive managers’ decisions to enter the online channel, they are not likely to shape consumers’ propensity to buy the brand given availability. 6 Table 1, Panel C, explains the operationalization of these variables.
Drawing on the estimates of this model, we calculate correction factors, which then enter the main model to control for unobservables associated with both BOI (or COI) and online presence. If brand b in category c is available online in year t, the correction factor is given by

If brand b in category c is not available online in year t, the correction factor is

Endogeneity Concerns
The marketing drivers of COI and BOI may be endogenous. This may be due to reversed causality within brands and categories over time (e.g., brands might set their marketing mix instruments depending on how well they performed online versus offline in the same period), or to unobserved brand or category characteristics driving both their marketing mix and BOI/COI. Moreover, unobserved temporal factors may influence both the marketing mix drivers and online versus offline outcome metrics. When unaccounted for, these phenomena may bias the estimates in our BOI and COI models. For lack of good instruments, 7 we accommodate this potential endogeneity by using time fixed effects and adding Gaussian copula-based control variables for the marketing mix drivers in Equations 2 and 3 (see, e.g., Datta, Ailawadi, and Van Heerde 2017). 8
Results
Selection Equation
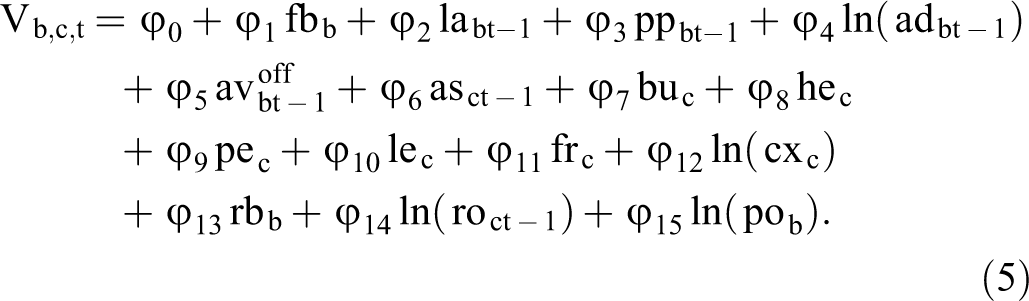
Before discussing findings for BOI and COI, we briefly discuss the estimates of our selection model, which are interesting in their own right because they shed light on factors that determine whether or not a grocery brand is present online during our data period. Table 3 shows the parameter estimates for the selection equation. The grocery brands that are more likely to be or to go online in a given year are ones that (1) already have wide offline availability (φ5 = 4.02, p < .0001), (2) occupy a premium price position (φ3 = .62, p < .001), (3) advertise regularly (φ4 = .02, p < .01) and are foreign (φ1 = .33, p < .01) or regional brands (φ13 = .48, p < .001), and (4) are owned by a powerful manufacturer (φ15 = .35, p < .05). Brands are also more likely to be or to go online in (1) expensive categories (φ12 = 1.00, p < .0001), (2) categories with large assortments (φ6 = .0002, p < .05), (3) frequently purchased categories (φ11 = .40, p < .001), (4) categories that are relatively new to China (i.e., when local embeddedness is low; φ10 = −.42, p < .0001), and (5) perishable categories (φ9 = .22, p < .05). The latter finding is somewhat surprising, and we speculate that this is due to the radically different role brands play in perishables offline versus online. In the offline channel, brands in perishable categories are less strong than in nonperishable categories (Steenkamp 1987, 1989) because perishables have many search attributes (Nelson 1970, 1974). Online, there is no opportunity to inspect products before purchase, which, in the case of perishables, favors brands that are used as quality signals in this context (Steenkamp 1989). Thus, online, branded perishables have a competitive edge over their nonbranded rivals.
Drivers of a Brand Being or Going Online.
Distribution of BOI and COI
Figure 2, Panel A, displays the histogram of the brands’ BOI, calculated across years. 9 As Figure 2 shows, the BOI distribution is highly skewed, with a mean equal to 1.30 and a median of .65. At the same time, the figure shows large variation in BOI across brands, as is also reflected in the standard deviation (SD: 2.13). The histogram of the categories’ COI (calculated across years) 10 is shown in Figure 2, Panel B. Again, while the average COI (1.51) exceeds unity (meaning that on average, our categories perform somewhat better online versus offline), the COI distribution is highly skewed, with a median value that is much lower (.43). Like for BOI, the COI standard deviation (2.66) and the lower and upper quartiles (.22 vs. 1.06) reveal considerable heterogeneity in categories’ performance online versus offline.

BOI and COI histograms.
Brand Performance in Function of BOI and COI
Figure 3 plots ln(BOI) against ln(COI) for all brands, calculated across years. As the graph shows, brands are quite spread in the ln(BOI) × ln(COI) space. The diagonal line through the origin indicates where the product of BOI and COI equals unity. If the rise of online does not affect total grocery sales (i.e., g = 1), brands positioned above the line see their overall sales increase as the share of grocery sold online goes up, whereas brands below the line face a decline in total sales. Across the 448 brands studied, the product of BOI and COI exceeds unity for 119 brands (i.e., 26.6%), whereas BOI × COI is below unity for 329 brands (i.e., 73.4%).

Brand distribution in BOI–COI space (N = 448 brands). Notes: BOI and COI are calculated across the full data period.
However, as mentioned earlier, if the rise of the online channel leads to an increase in total expenditure on groceries (g > 1), the diagonal shifts downward, reflecting that the cutoff value for BOI × COI is smaller than 1. Conversely, if the rise of the online channel leads to a decrease in total expenditure on groceries (g < 1), the diagonal shifts upward, reflecting that the cutoff value for BOI × COI is greater than 1. The magnitude of the shift upward or downward depends on the magnitude of g and the online share in total groceries (see Equation 1). Table 4 shows results for six levels of g and four levels of online share of groceries. We use the BOI and COI values of the individual brands across the full data period to identify how many brands for which BOI × COI exceeds the cutoff, therefore causing the brand to experience sales expansion, and how many brands for which BOI × COI falls short of the cutoff, therefore causing the brand to experience contraction in sales. For illustrative purposes, we insert two lines in Figure 3, viz., for g = .5 and g = 1.75, where we assume that in both cases the online share of groceries is 7.6% (according to Edge Retail Insight, this is the actual share halfway through our estimation period, i.e., in 2013).
Brand Performance in Function of g and Online CPG Sharea

Notes: 5% is the approximate online share of groceries in the United States, 7.6% is the online market share of groceries in China in 2013 (halfway through our estimation period), and 33% is the approximate online grocery share in China in 2018. The simulation uses BOI and COI calculated across the full data period. In actual market conditions, the manager can calculate their own BOI and COI and assess whether BOI × COI is above or below the cutoff, taking into account g and total online grocery share.
Table 4 shows that, as expected, the larger g, the more brands profit from the shift to online shopping—not necessarily because they do well online but simply because of the total increase in grocery expenditure due to greater availability to more Chinese consumers. Furthermore, it shows that as the online share becomes higher, brands profit less from further increases.
What is the actual situation in China? There is evidence that the shift to online does indeed lead to expansion of total grocery expenditures (g > 1), which is consistent with the leapfrogging argument. China Internet Watch (2015) reports a more conservative number, namely that 78% of online shopping consumption in China is an alternative to traditional consumption, and 22% is new demand stimulated by the online shopping market in 2014. A caveat is that the study referred to all products and services, not just groceries. With that caveat in mind, it appears that g = 1.25 for China is a reasonable estimate. This suggests that 31.9% of grocery brands see their sales grow, of which 83.4% (26.6 / 31.9) is in the healthy situation of seeing their sales grow because they capitalize on online developments well (BOI × COI > 1) as well as benefit from total expansion of the grocery market due to the shift to online.
Although Table 4 shows that in growing markets like China where the shift to online can lead to sales expansion even for brands that actually underperform online (because of their low BOI, low COI, or both), this is not a satisfactory situation in the long run. If a brand’s BOI score is low, they may want to work on this. If their category’s COI score is low, they need to know what is causing the category’s low COI and assess what they can do about that as well. Thus, managers need to know what drives both BOI and COI. Our regression results shed light on this issue.
BOI Model
The estimation results of our BOI models can be found in Table 5. As expected, foreign brands perform relatively better online versus offline than domestic brands (β3 = .22, p < .01). In addition, brands that are more widely available online and charge relatively lower prices in that channel will improve their position within the category as the online channel grows (β8 = 1.39, p < .01; β6 = −.61, p < .05). Interestingly, we find no significant impact of offline availability on BOI (β9 = .03, p > .10), possibly because the positive billboard effect and the negative substitution effect cancel each other out. Brands that sell relatively more large packages generally do not enjoy higher market shares online than offline (β4 = −.46, p < .05). This might be caused by consumers’ attempts to minimize shipping costs, something we will turn to when discussing the results of the COI model. The estimate of (high) price positioning does not reach significance (β5 = −.06, p > .10), refuting the premise that expensive brands fare relatively better in the digital channel. Finally, although the selection model revealed that heavily advertised brands are more likely to be present online, they do not seem to enjoy higher BOIs (β7 = .000003, p > .10).
Drivers of BOI.a.

aMean-centered estimates are reported, and the dependent variable is ln[BOI × 100 + 1].
b Dummy variables and covariates are effect-coded, and base categories are domestic, food, and 2012.
Moving to the subset of brands for which survey data are available (typically somewhat larger brands), we find that more trusted brands generally have higher online versus offline market shares (β1 = −.69, p < .01), whereas the opposite holds for fun brands (β2 = −.61, p < .05). The pattern of effects for the other variables remains largely similar (except for the online-to-offline price ratio and large packages, the coefficients of which are no longer significant).
COI Model
Table 6 shows the estimates of the COI models. As expected, more expensive, less perishable, and less frequently purchased categories capture a larger grocery share online than offline (α8 = .69, p < .01; α5 = −.22, p < .01; and α7 = −.11, p < .01, respectively). The same holds for categories with large assortments (that can be easily searched through online; α2 = .0002, p < .01) and that are less locally embedded (α6 = −.17, p < .01). Opposite to our expectations, categories that consist of less heavy products perform relatively better online than offline (α4 = −.07, p < .01). This may have to do with the structure of shipping costs, which decrease when the total amount spent goes up but increase with the weight of the shopping basket. Neither advertising nor bulkiness of a category has a significant influence (α9 = .005, p > .10; α3 = −.00007, p > .10).
Drivers of COIa.
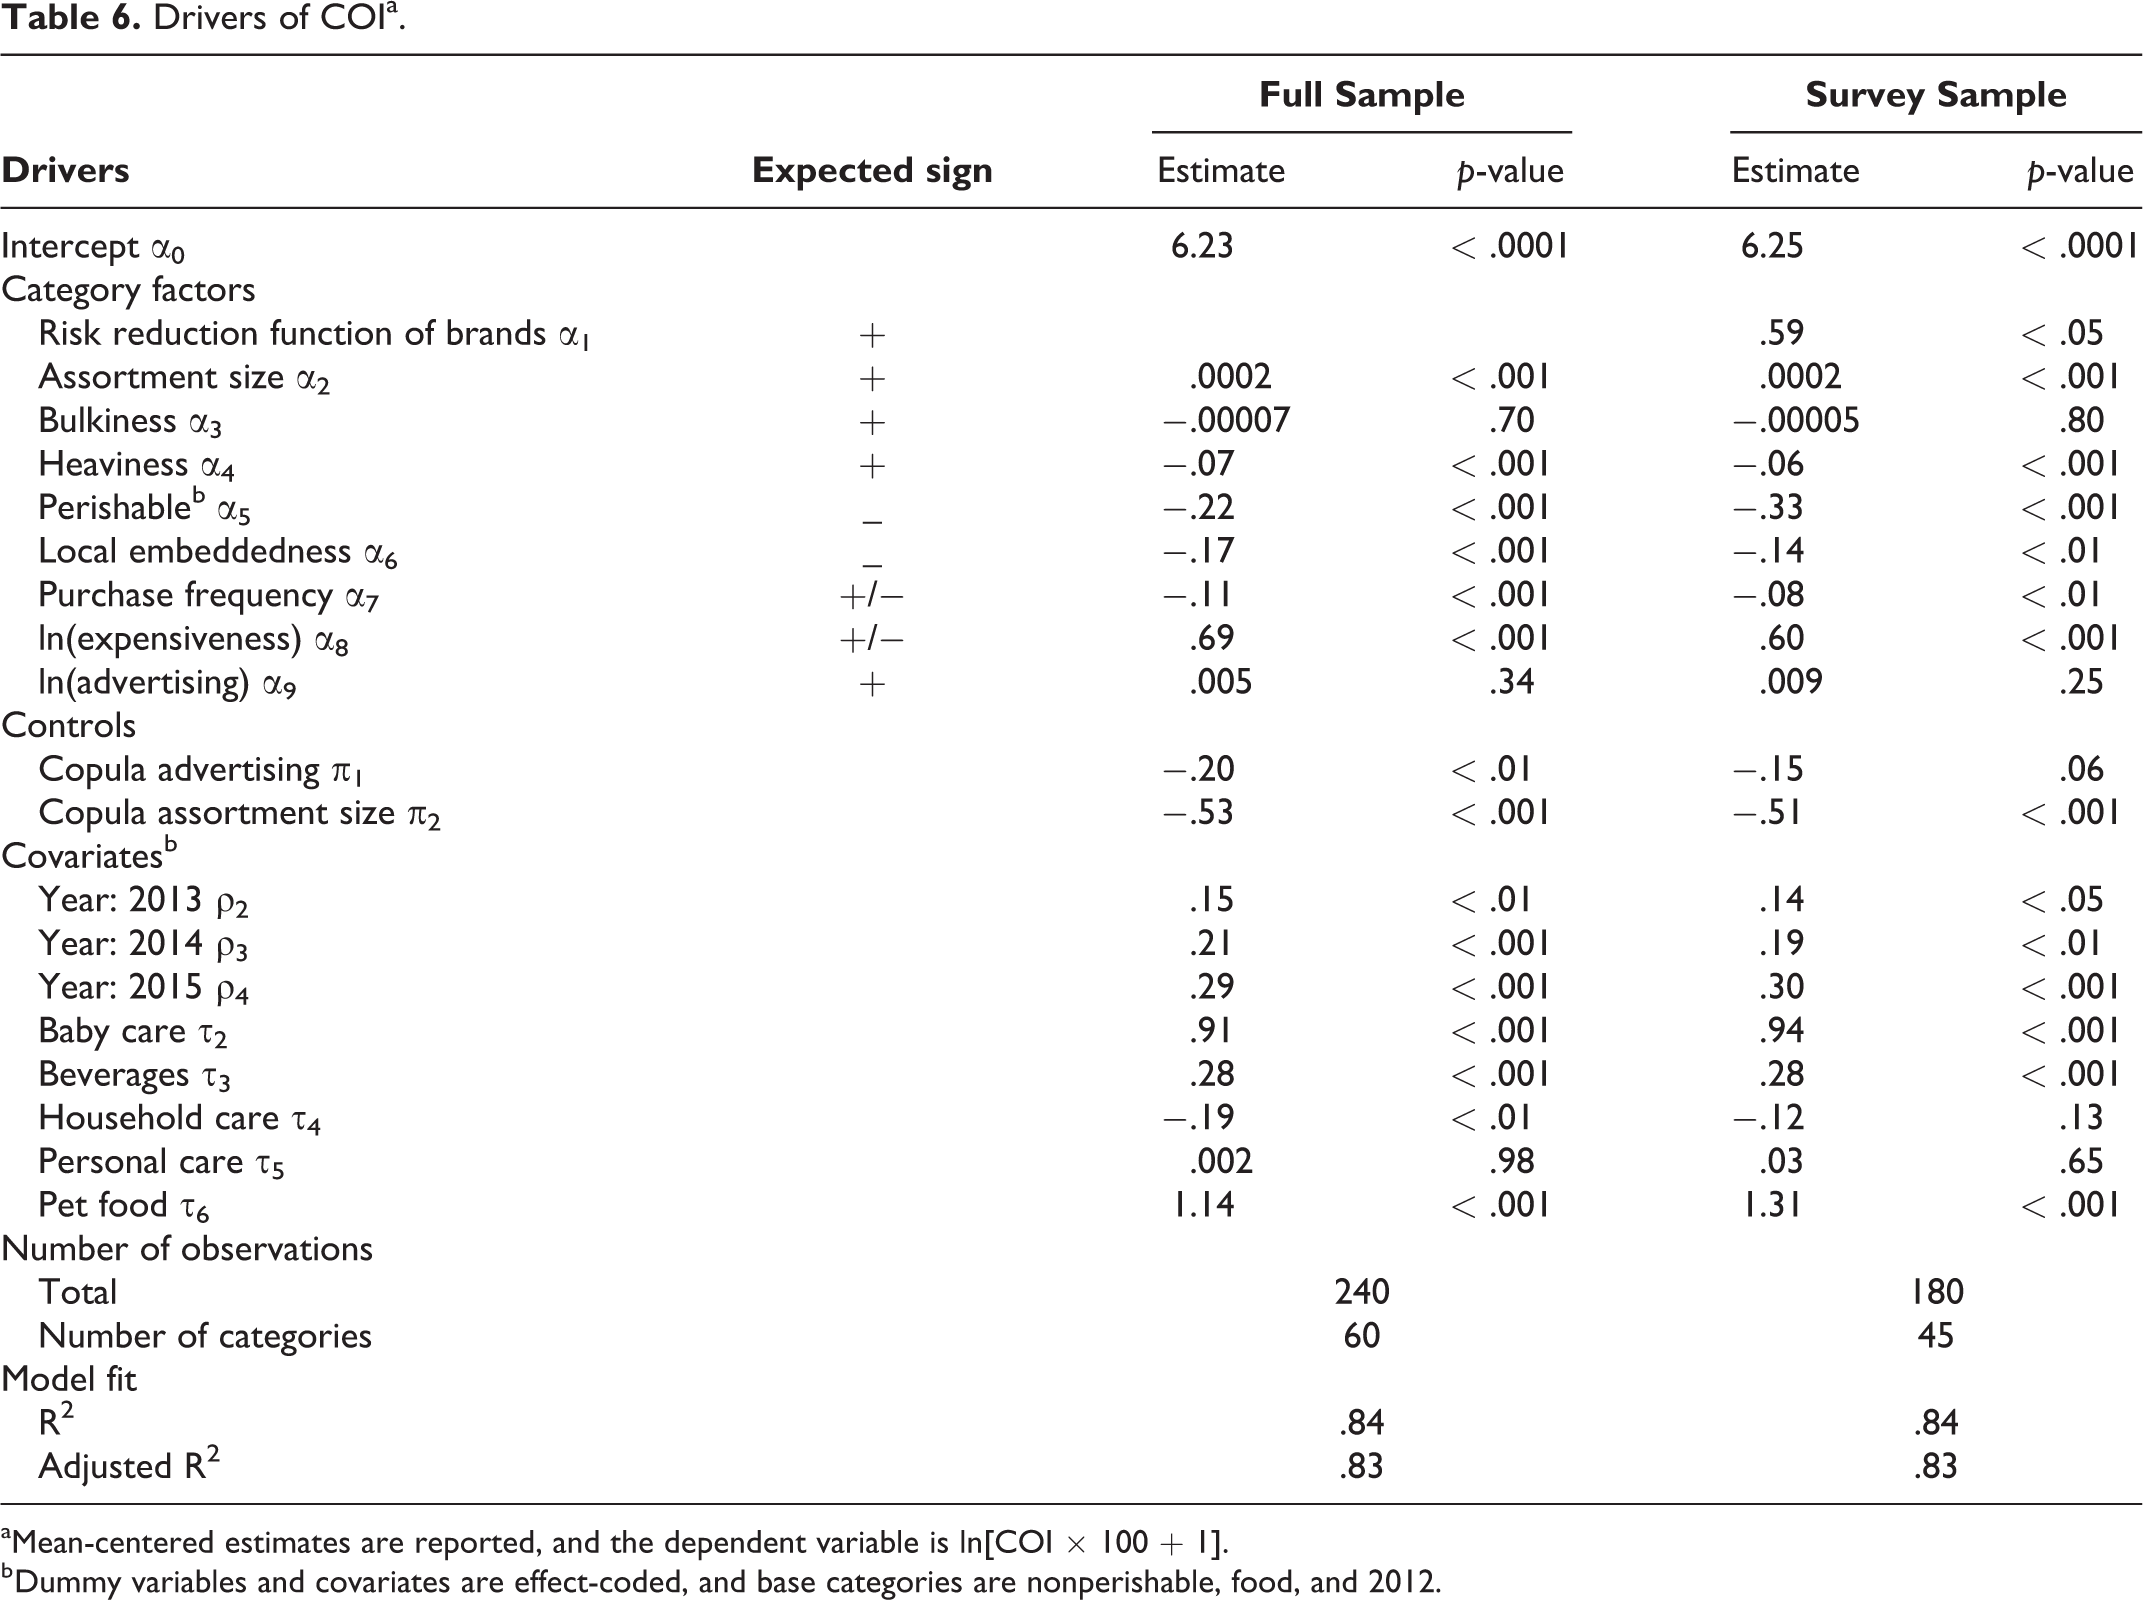
aMean-centered estimates are reported, and the dependent variable is ln[COI × 100 + 1].
b Dummy variables and covariates are effect-coded, and base categories are nonperishable, food, and 2012.
Looking at the regression outcomes for the subset, in which risk reduction is added as a driver, we find that categories in which brand names serve as important risk reduction cues take a larger share of groceries sold online versus offline (α1 = .59, p < .05). The other effects are robust in sign and significance.
Discussion
Grocery sales are becoming increasingly digital, and this trend will unavoidably affect total brand performance. This holds especially in markets like China, where the shift to ecommerce is dramatic and where jumping on the online bandwagon is critical for future brand success. The objective of this article is twofold: (1) to develop two metrics to assess brands’ “online viability” (i.e., their change in total [online plus offline] sales as a function of a change in the share of total groceries sold online) and (2) to propose and empirically document brand and category factors driving these metrics, including factors that particularly play a role in the Chinese grocery market.
We show that, apart from total grocery expansion or contraction effects, in today’s mixed online/offline world, changes in brand sales depend on two indices: (1) BOI, which reflects the brand’s relative market position within the category in the online versus the offline channel and (2) COI, which captures the category’s share of total grocery sales online versus offline. Calculating the BOI and COI for a set of 448 brands in 60 categories in the Chinese grocery market, we observe large variation in these metrics across categories and brands. We next identify brand and category drivers that may underlie this variation. We then empirically assess the impact of these drivers after controlling for possible selection bias in our brand (and category) set. We find that, overall, these drivers explain a large portion of the variability in our key metrics: up to almost 40% of the variation in BOI, and over 85% of the variation in COI. 11
Managerial Implications
How do total brand sales in China change as the online channel grows? Our results show that, overall, brands that can be expected to fare better online are also more likely to enter the online channel. However, we also observed interesting deviations: Though their BOI and COI prospects are rosier, lower-priced brands in less perishable and less frequently purchased categories are less present in the online channel in China. Thus, our results add to the prevailing industry wisdom by pointing out missed opportunities for those brands that have not yet ventured online.
For brand managers that have entered the online channel in China, our results provide guidance on how to improve their overall brand performance. As a first step, they can measure and track two easy-to-calculate metrics—COI and BOI—to get a first indication of how their relative market position and that of their category is likely to evolve, as well as how this will affect their brand sales. Brands with BOI > 1 and COI > 1 will experience a “double whammy” as the online channel grows, being situated in a category that lends itself well to online buying while also doing better than their immediate competitors within that category. For brands in high COI categories but with low BOI, our decomposition acts as a warning signal: Though these brands will appear to maintain high sales levels in China as the online channel becomes more popular, they will simply be “riding on the category waves” while losing position relative to other players in the category. Conversely, for brands in low COI categories, the sales erosion will likely be attributable to factors outside of the brand managers’ control. Importantly, our decomposition model, which allows researchers to disentangle the effects of the online channel on sales, is applicable in any market—not just China.
If this first step leads Chinese managers to conclude that their BOI and/or COI is unsatisfactory, what can they do about it? Which drivers can they employ? To help them with this, we use the model estimates (whose magnitude is not directly interpretable or comparable across drivers) to calculate the comparable effect sizes as the difference between the predicted value of BOI (COI) if the driver equals (1) a high level (mean plus two standard deviations) versus (2) a low level (mean minus two standard deviations, except for foreign vs. domestic and perishable vs. nonperishable, which are dummies and for which we consider values of 1 vs. −1). 12 The results are reported in Figure 4.

Effect of drivers on BOI and COI.
One straightforward and impactful way to improve a brand’s BOI in China is to expand online availability. Brands should be available in all the relevant Chinese ecommerce channels. There is still room to grow: 25% of brands in China have an online availability of around 75% or less. Although 75% is a high number in most countries, it is not high in China, where the top 25% of brands have an online availability of 97%. This is associated with a substantial difference in BOI of 1.05. Package size also matters, but contrary to expectation, small package size is associated with greater success online. This suggests that brands should offer smaller package sizes online. This effect might be caused by the way delivery fees are set in China: shipping costs charged to consumers are a function of the order value (amount spent) and weight. The effect is an appreciable ΔBOI of .41. Chinese consumers are keen on price and charging higher prices online than offline is a substantial detriment to online success: ΔBOI = .53. Brand trust has been identified as an important factor in offline consumer behavior (Chaudhuri and Holbrook 2001), and this study shows that it matters even more online, where people cannot physically inspect grocery products before buying: ΔBOI = .69. Especially in a market like China, where brands have a strong risk-avoiding function (Kantar Millward Brown 2010), managers should aim to increase brand trust. Rajavi, Kushwaha, and Steenkamp (2019) describe strategies on how to achieve this, including product innovation and advertising. Although advertising has no direct effect on BOI, it can have an indirect effect through increasing brand trust (Rajavi, Kushwaha, and Steenkamp 2019). Fun brands can expect lower BOIs. Such brands are often purchased on impulse, for which online shopping is perhaps less conducive. Unless the brand manager wants to reposition their brand, they will have to work harder on other aspects. Finally, foreign manufacturers have an advantage over Chinese players: ΔBOI = .27. They usually have deeper pockets, which secures them better presentation and more support at e-commerce retailers. To counter this, local players can engage in mergers and acquisitions to create larger companies with the heft to support their brands on Tmall, JD.com, etc.
By its very nature, COI is less easily affected by the actions of the brand manager. Still, managers can use these insights by modifying their brand’s offering to deviate from typical offerings in the category. Figure 4, Panel B, shows that category’s perishability and expensiveness are the most important drivers of a category’s online-to-offline performance in China. COI is lower in perishable categories (ΔCOI = 2.27) and higher in more expensive categories (ΔCOI = 1.92). Chinese brand managers can use these insights by offering nonperishable versions of their product (e.g., sterilized milk rather than fresh milk) and by overweighing their top-of-the-range product items in their online offering. Heavy categories also do less well online (ΔCOI = 1.03), probably because consumers may see their shipping fees increase when such items are added to their shopping basket. Smaller package sizes could be one way to address this. Purchase frequency reduces COI as well (ΔCOI = 1.04). One way to capitalize on this is for brands in these categories to offer subscription-based services in which the product is delivered frequently. Risk reduction plays a role in the Chinese grocery market as well. In categories in which the risk reduction function of brands is low, online performance suffers (ΔCOI = .50). The brand manager can attempt through advertising and other means to highlight that not all brands are created equal and that their brand does perform better than others. In addition, COI is higher in newer categories that are less embedded in the Chinese culture. One idea for brands that operate in locally embedded categories might be to offer modern and unusual varieties that go against ancient traditions. It is possible that consumers will see these offerings as part of the global culture rather than embedded in the local culture (Steenkamp 2019).
Although these recommendations are developed for China, they may also be used as benchmark for other emerging markets, which may follow China’s lead and leapfrog from relatively unsophisticated offline grocery retailing to online grocery retailing. There is no a priori reason why these factors would not apply to these markets as well. Finally, BOI, COI, and Equation 1 can be used by Western brand managers to assess and monitor the online health of their brands. They may expect, though, that their g will be much closer to 1 than in emerging markets. They can also use Figure 4 as a first indication of what will affect their brands’ online performance. This is an example of how research in emerging markets can advance marketing science and practice in the vein proposed by Burgess and Steenkamp (2006).
Limitations and Future Research
Our study opens important avenues for future research. First, our empirical analysis pertained to only one market: China. Although China is very important in terms of total grocery sales and leads the way when it comes to online share, some of the effects may be idiosyncratic to the country. Future studies should verify generalizability to other markets. Second, our measures of BOI and COI represent a snapshot, and even their drivers may change over time as consumers become more accustomed to buying online and the modalities of buying in the digital channel evolve. Though we expect these changes to be gradual, they imply that the impact of drivers needs to be revisited as time progresses. Third, the BOI and COI metrics and the underlying brand and category determinants may depend on the setting (e.g., urban vs. rural local market) and online format. For instance, placing an online order through different devices (e.g., desktop vs. mobile phone) or using different types of online order fulfillment (e.g., home delivery vs. click and collect) may trigger different marketing mix responses and favor some categories more than others. As these different formats become more important, a separate study of their impact on brands’ relative market position and categories’ sales shares is warranted.
Supplemental Material
Supplemental Material, Web_Appendix - The Rise of Online Grocery Shopping in China: Which Brands Will Benefit?
Supplemental Material, Web_Appendix for The Rise of Online Grocery Shopping in China: Which Brands Will Benefit? by Bernadette J. van Ewijk, Jan-Benedict E.M. Steenkamp and Els Gijsbrechts in Journal of International Marketing
Footnotes
Appendix A: Proof of Equation 1
Our key question is: How does a change in the share of groceries sold online influence brand sales? To see this, we start from total brand sales, which we can write as:
where
We allow every dollar sold offline to lead to an equivalent of g dollars sold online, with values of g smaller (larger) than 1 indicating contraction (expansion). This implies that:
where
Using Equations A1 and A2, we can calculate the change in total brand sales as the share of total grocery sold online goes up through the following derivative:
For this expression to be positive, we need that:
Or:
Or:
where
Acknowledgments
We thank AiMark, Kantar Worldpanel, Kantar Media, and GfK Verein for providing the data. We gratefully acknowledge the help and comments of Zhiling Bei, Suzanne Bies, Nick Bombay, Katrijn Gielens, Harald van Heerde, Esther Jaspers, Wenlin Lu, Shijie Lu, Ana Martinovici, Constant Pieters, Anouk Sayed, Astrid Stubbe, Ning Yanbin, Yan Xu, and Yazhu Xu, and the participants at the 2017 Marketing Science conference in Los Angeles, 2019 Theory and Practice in Marketing conference in New York, and 2019 EMAC conference in Hamburg.
Associate Editor
Kelly Hewett
Declaration of Conflicting Interests
The author(s) declared no potential conflicts of interest with respect to the research, authorship, and/or publication of this article.
Funding
The author(s) received no financial support for the research, authorship, and/or publication of this article.
Notes
References
Supplementary Material
Please find the following supplemental material available below.
For Open Access articles published under a Creative Commons License, all supplemental material carries the same license as the article it is associated with.
For non-Open Access articles published, all supplemental material carries a non-exclusive license, and permission requests for re-use of supplemental material or any part of supplemental material shall be sent directly to the copyright owner as specified in the copyright notice associated with the article.