
Abstract
In response to pressure to defend their stand sales against discounters, grocery retailers started engaging in retailer-themed super saver events: promotional events (1) specific to the retailer, in which they (2) mass advertise (3) unusually deep, immediate deals (4) across a broad range of categories (5) under a common savings theme and deal format. Given these characteristics, such events are expected to generate higher awareness and interest than typical day-to-day promotions, thereby enhancing visits and purchases during the event but also reducing them before and after. The authors evaluate these effects by analyzing 44 retailer-themed super saver events operated by the largest Dutch grocery retailers over four years. They find a substantial increase in visits and total purchases during the event, especially among nonprimary customers and hard-discount shoppers. The larger part of this lift stems from the use of an overarching event theme. Consumers buy less in anticipation of the event and visit the store more often afterward, but for smaller baskets—typically leading to a null effect in terms of profit. Finally, our results suggest that rather than the deal depth or advertising budget, the number of items and media resonance of the theme are key drivers of event success.
Pressured to defend their sales against (hard) discounters such as Aldi, Lidl, or Walmart, traditional grocery retailers have increased their promotional activities considerably in recent years (Gauri et al. 2017; Planet Retail 2016). Studies suggest, however, that simply offering more or deeper discounts hardly generates incremental increases in traffic or sales. Given the high promotional clutter, consumers are often unaware that a product is on sale (e.g., Van Lin and Gijsbrechts 2016) and, thus, do not buy more, even though they could benefit from the discount (Gauri, Sudhir, and Talukdar 2008). Even if such deals are noted, they often fail to attract consumers who would otherwise not visit the store. Research has indeed found limited evidence of direct grocery-store switching due to promotions (Gedenk, Neslin, and Ailawadi 2010). This has led “a growing number of industry stakeholders [to question] the long-term viability of retailers’ promotional activities” (Planet Retail 2016).
To address these problems, several grocery retailers have ventured into
Through such events, retailers hope to improve, or at least consolidate, their market position 1 by revitalizing their customer base (i.e., attracting extra visitors to the store) and increasing current customers’ spending at the store (Garstenveld 2015). By integrating the offers into a common deal format and savings theme, and combining feature ads with mass media to advertise them, these events may generate extra attention and signal unusual bargain opportunities. As such, they may attract extra visitors and/or expand current customers’ purchase baskets, thereby generating incremental business.
Anecdotal evidence suggests that traffic and basket sizes do increase during the ReTSS period (e.g., Bijlsma 2009; Garstenveld 2015) and that such events are “the engine behind revenue growth” (Garstenveld 2015, p. 2). This indicates that ReTSS may help traditional retailers defend against price fighters. However, it does not imply that ReTSS are a panacea. First, regular store customers may anticipate upcoming ReTSS and postpone purchases until the event. Moreover, the deep, storewide, and uniformly tagged promotions may simply entice those customers to stock up on larger inventories of more promoted items and to buy less after the event. Second, newly attracted visitors may stay away in postevent weeks, when the retailer’s promotional activity returns to business as usual. Thus, some industry analysts express doubts about the net outcomes of these ReTSS (Meijsen 2014), and any claims that ReTSS are the road to promotion success remain unsubstantiated.
A rigorous analysis of ReTSS is currently lacking; this sets the stage for our research. Our contribution is twofold. Substantively, we conceptualize how the combined characteristics of ReTSS could make their effect different from that of business-as-usual retailer promotions. We develop a conceptual framework that lays out the behavioral mechanisms, and, although we do not test these mechanisms per se, we use them to form expectations for how ReTSS affect store visits and purchases. Empirically, we document the impact of ReTSS on these metrics before, during, and after the event. In so doing, we address several questions: Do ReTSS attract extra visitors to the store during the event? Do they increase visitors’ purchases at the store? Are these effects incremental—that is, do increases during the event period outweigh negative pre- and postevent dips? We address these questions by studying weekly store visits and purchases of a panel of households, across the top seven Dutch grocery chains (of which four engage in ReTSS), during a period covering over 200 weeks and 44 ReTSS (nine themes, with several occurrences). We study the impact of ReTSS as a whole and show that it is stronger than the mere discounting and advertising effect. In addition, we explore which consumers respond more favorably to these events, what makes some ReTSS more successful than others, and how they affect the retailer’s bottom line.
The article is organized as follows. After a brief review of background literature, we describe the ReTSS and outline their characteristics. Next, we develop a framework for their anticipated effects on store visits and purchases before, during, and after the event. We then present the models followed by the empirical estimates, which we use as inputs for simulations to test and further explore the proposed effects. We conclude with summary insights for academics and managers.
The Effects of Promotions
This section offers a brief literature review on the nature of, and evidence for, promotional effects. Previous work has identified the components of promotional responses and indicated those that contribute to a net gain (excellent overviews are given in Ailawadi, Gedenk, et al. [2007], Ailawadi, Harlam, et al. [2007], Van Heerde et al. [2004], and Van Heerde and Neslin [2017]). From a retail perspective, the total lift during the promotion period can be split into an effect due to changes in visits or purchases per visit and further decomposed into (1) deceleration (consumers postponing visits/purchases at the promoting store in anticipation of the promotion); (2) cross-store switching, either direct (consumers visiting the promoting store instead of a competitor) or indirect (consumers shifting purchases between stores they would visit anyway); (3) expansion (due to consumers engaging in more shopping trips and/or consuming more in the promoted categories); (4) acceleration (consumers visiting/buying earlier than they usually would to benefit from the promotion); and (5) halo effects (promotions lifting the purchases of other [nonpromoted] categories in the store).
Of these components, only expansion, halo effects, and cross-store switching contribute to the incremental promotion lift for the retailer. Deceleration and acceleration produce pre- and postpromotion dips that must be deducted from the lift during the promotion period. 2 Thus, to appreciate the truly incremental outcome of promotions, one needs to consider not only immediate effects (during the promotion period) but also effects before (leads) and after (lags) the promotion period.
Empirical studies on the impact of grocery retailer promotions abound. These works typically study the impact of what we refer to as “business-as-usual promotions”: frequent discounts, premiums, or coupons on individual brands or stockkeeping units (SKUs) that are not part of an overarching event and that may be announced through feature ads or in the store’s weekly flyer. Most of these studies focus on the effect of brand- or SKU-level offers in isolation, with brand or category sales as the outcome of interest 3 (for an excellent discussion, see, e.g., Ailawadi et al. [2009] and Van Heerde and Neslin [2017]). The results show that at the category level, the larger share of the promotional sales lift comes from purchase acceleration, followed by store switching, with only a small portion stemming from increased consumption (e.g., Guyt and Gijsbrechts 2014; Van Heerde et al. 2004). The store switching appears to be mostly indirect—consumers shifting category purchases among stores they visit anyway (Bucklin and Lattin 1992; Guyt and Gijsbrechts 2014)—such that, to the extent that competing supermarkets run promotions for different categories, the question remains how these effects translate to sales for the retailer as a whole.
A smaller subset of research examines the combined effect of different promotional offers at the store level. Some of these document the impact of promotional calendars—in other words, the sequence of promotional actions over time (Mehta and Ma 2012; Silva-Risso, Bucklin, and Morrison 1999; Tellis and Zufryden 1995). Others analyze how the total number of products promoted by a retailer and their average discount depth affect store traffic and sales (e.g., Gauri et al. 2017; Gijsbrechts, Campo, and Goossens 2003; Urbany, Dickson, and Sawyer 2000; Volle 2001). The general finding is that more and deeper promotions can increase traffic and basket size, but that this effect is often small, with elasticities in the range of .05 to .2 (Gauri et al. 2017; Gijsbrechts, Campo, and Goossens 2003). Moreover, to the extent that consumers accelerate purchases to benefit from a promotion (Ailawadi et al. 2006), only a portion of this temporary lift in traffic or spending is incremental.
Retailer-Themed Super Saver Events: Characteristics
Retailer-themed super saver events (ReTSS) exhibit a unique combination of characteristics. They promote storewide benefits across a broad range of categories in the store. The offers are immediate (i.e., the consumer receives the price cut or extra quantity at the time of purchase) and unusually deep. More importantly, the event-related deals share a common format that is easy to recognize (e.g., “One Euro only,” “BOGO”), and they are presented to consumers under a theme that is unique to the retailer. This theme is not just apparent in-store or featured in the store flyer; it is also supported with mass-media advertising that emphasizes the considerable potential savings. In terms of timing, retailers themselves choose when the event takes place and for how long. As an example, the Hamsterweeks event, organized several times per year by Dutch chain Albert Heijn, involves BOGO offers on items across 50 categories, rotating during three consecutive weeks. The event is advertised on national TV, in newspapers (and on the radio) using images (sounds) of a hamster carrying the chain’s logo and dragging large amounts of groceries out of the store while crying out, “Hamsterééééén!” 4
Table 1 compares ReTSS with other retailer promotions. As shown there, ReTSS share some characteristics with other promotional activities. However, what sets ReTSS apart is the joint occurrence of these characteristics. Unlike popular, category, and seasonal events, which typically focus on specific types of products, ReTSS span categories storewide. In contrast to popular and seasonal events, the timing of the ReTSS is retailer-specific. 5 Unlike business-as-usual promotions that use store flyers and in-store tags focused on activation, ReTSS combine these with mass-media ads designed to form attitudes. The discounts that are part of the ReTSS event are immediate (unlike in temporary loyalty programs, in which consumers save for rewards) and unusually deep (typically 30%–50%; other promotions are, on average, less than 20%). 6 Perhaps the most discriminating feature of ReTSS is the use of a common deal format under a common (retailer-specific) theme focused on monetary savings. Other promotion activities either lack an overarching theme (i.e., business-as-usual promotions) or, if they do have a theme, encompass a variety of offers, some of which are not even savings-related (e.g., popular events including premium gadgets linked to the event, category and seasonal events also pertaining to temporary additions to the assortment). In our empirical analysis, we control for the presence of such other events when assessing the impact of ReTSS on visits and purchases.
ReTSS Events Versus Other Promotion Activities.

aBusiness-as-usual promotions are typically not communicated through mass media (though the retailer often uses mass-media image advertising during business-as-usual weeks).
Conceptual Framework
This section outlines a conceptual framework that examines the effects of ReTSS on consumer and store outcomes. We proceed in three steps. First, we argue how the joint characteristics of ReTSS increase promotion awareness and perceived benefits. Next, we delineate how this influences the different components of promotion response identified in previous literature. Although we do not observe these mechanisms directly, we use them in a third and final step to form expectations about consumers’ visits and purchases at the store before, during, and after the ReTSS period, which we subsequently test empirically.
Consumer Mechanisms Driving ReTSS Success
Why do promotions often fail to generate incremental visits and purchases? We identify two main reasons for this. First, consumers—and especially those who are not regular store customers—are often not aware of the promotion. As indicated by Batra and Keller (2016, p. 122), shoppers are “perhaps more than ever…seemingly in a perpetual state of partial attention.” They are bombarded with promotional messages, yet experience high search costs (Gauri, Sudhir, and Talukdar 2008). This makes it difficult for specific deals to stand out from the clutter and to reach potential customers. Second, the deals may not seem interesting enough to trigger a promotional purchase at the store. They are often not unique to the retailer—promotions that run concurrently with other stores yield less bang for the buck (Guyt and Gijsbrechts 2014)—and, many times, the benefits are too small to warrant the cost of an extra visit or even to justify the effort to look for the item in-store. In the following subsections, we argue how their combination of characteristics may allow ReTSS to overcome these hurdles.
Impact on consumer awareness
Promotions at the store are typically communicated through store flyers for which readership may be high among current customers, but less so among potential customers (e.g., Foldermonitor and GfK 2016; Van Lin and Gijsbrechts 2014). By combining store flyers with mass-media advertising, ReTSS cover a broader target audience, including noncustomers of the store. In addition, the presentation as an event with a common theme may create higher resonance (Batra and Keller 2016) and trigger word of mouth, thereby further enhancing promotional reach.
Moreover, consumers who encounter ReTSS messages are more likely to encode them. The combined use of different modes (mass media and store flyers) may render the ReTSS more salient (Unnava and Burnkrant 1991; Young and Bellezza 1982). Furthermore, the common event theme provides a hook that fosters message processing (Gijsenberg 2014; Keller, Deleersnyder, and Gedenk 2019), especially so because—unlike season-sale or popular external events—the theme and timing of ReTSS is retailer-specific and does not automatically coincide with above-average competitive clutter.
In summary, consumers are more likely to be aware of ReTSS events. We expect this to hold during and after the event period but also—to the extent that these events are announced up-front or recur around the same period—in the period leading up to it.
Impact on consumer interest
Retailer-themed super saver events should generate higher interest by providing larger perceived benefits. They offer deeper-than-normal monetary discounts that are immediately available across a broad set of items and, therefore, appeal to many (current and potential) customers. This is reinforced by the integrated nature of the campaign: unifying the ReTSS deals through a common format and theme that is unique to the store may produce signaling value (Zhang and Breugelmans 2012) and enhance the perceived monetary benefits.
In addition, ReTSS offer nonmonetary benefits, which further contribute to consumers’ promotional response (Chandon, Wansink, and Laurent 2000): convenience, smart-shopper, and exploration benefits. First, ReTSS hold the promise of important convenience benefits. The broad offer propagates the store as the place of choice, with a multitude of deals under one roof, making it worth a visit. The common format makes it clear to consumers what to look for and easy to spot the deals in-store, reducing the search cost of promotional shopping (Gauri, Sudhir, and Talukdar 2008).
Second, the use of complementary media may instill psychological triggers to participate. While store flyers and in-store deals stimulate action, mass (TV) advertising is effective at eliciting emotions that heighten the success of direct sales incentives (Batra and Keller 2016; Pfeiffer and Zinnbauer 2010). In this vein, mass advertising that presents the ensemble of ReTSS deals as one large, not-to-miss event may create value-expression or smart-shopper benefits: the feeling of being a responsible shopper when visiting the store (Bagozzi, Baumgartner, and Yi 1992; Chandon, Wansink, and Laurent 2000).
Finally, ReTSS can create exploration benefits. To the extent that ReTSS deals are announced in mass media to cover a broad set of categories but are not individually listed in those ads or grouped in one place inside the store, consumers may become curious to discover which specific items are covered. This may stimulate them to look for (promoted) items in-store and to enjoy traveling the aisles (Chandon, Wansink, and Laurent 2000).
Table 2, Panel A, summarizes the links between ReTSS characteristics and consumer awareness and interest (due to perceived monetary and nonmonetary benefits). We expect these links to apply to ReTSS in general but to be particularly strong for events with more items, higher advertising budgets, deeper discounts, and more resonant themes.
ReTSS: Consumer Mechanisms and Store Outcomes.

Notes: The table summarizes how the impact of ReTSS differs from business-as-usual promotions. Panel A links event characteristics (left side) to resulting consumer mechanisms (right side). For instance, because of the unusually deep, immediate discounts, ReTSS entail larger monetary benefits than regular promotions (✓). Panels B and C indicate which of these consumer mechanisms (left side) influence which promotion component (middle), and how this component affects visits (right side of Panel B) and purchases per visit (right side of Panel C). ↑ = the promotion component in the row enhances the outcome variable in the column; ↓ = the promotion component reduces the outcome variable; empty cells indicate that it has no impact. For instance: trip acceleration enhances visits during (↑) but reduces visits after (↓) the event, postpromotion direct switching to other stores reduces visits after the event (↓), and so on.
ReTSS-Induced Consumer Behaviors
How do increases in awareness and perceived benefits translate to consumer reactions to ReTSS, over and above business-as-usual promotions? To see this, we discuss how they influence the aforementioned promotion-response components, split into visit responses (Table 2, Panel B) and purchase responses given a visit (Table 2, Panel C).
Impact on store visits
The high awareness of ReTSS may make consumers decelerate visits in anticipation of the event (Neslin and van Heerde 2009, Sun 2005), and more strongly so than for regular promotions. This is bolstered by the interest generated by these events: the large expected monetary benefits and emphasis on smart shopping reinforce consumers’ desire to be economical (Chandon, Wansink, and Laurent 2000; Zhang and Breugelmans 2012).
During the promotion period, we expect ReTSS to trigger more direct cross-store switching than other promotion activities. Their high reach and salience make even noncustomers aware of the event. Attracted by the promise of substantial monetary benefits (which may act as a commitment device; Lal and Matutes 1994) and smart-shopper benefits (which make them feel like a responsible shopper; Chandon, Wansink, and Laurent 2000), these consumers may decide to visit the promoting store instead of a competitor. Moreover, because the perceived benefits are likely to exceed the cost of a visit (Bell, Ho, and Tang 1998), consumers are more prone to engage in extra trips during the event (visit-expansion effect).
The ReTSS mechanisms that attract new consumers may also trigger current customers to more strongly accelerate their shopping trips. While this further increases store traffic during the event, it leaves these consumers with an unusually high inventory that reduces their visit propensity in postevent weeks (see, e.g., Gedenk and Neslin 1999).
Finally, more so than other promotions, ReTSS may produce direct cross-store switches that persist for some time after the event. These switches can be in either direction. On the positive side, increased awareness may produce more sustained switches toward the promoting store. New customers may have found their way to the store and, having become more familiar with it during the event, or realizing its attractive features in-store, return even after the ReTSS ends (Ailawadi, Gedenk, et al. 2007; Van Lin and Gijsbrechts 2014). Moreover, increased awareness may produce a rewarded behavior effect of consumers feeling obliged to those who treat them well (DeWulf, Odekerken-Schröder, and Iacobucci 2001) and becoming more committed to the store at the expense of competing stores. On the negative side, the stronger promotion salience and emphasis on smart shopping may trigger a reference-price effect and reduce consumers’ willingness to visit at regular prices (Hamilton and Chernev 2013). Even consumers who did not visit the retailer during the event may exhibit such an effect and switch to competing stores subsequently (Zeelenberg and Van Putten 2005).
Impact on store purchases
The promotion events may also affect consumers’ purchases on a given visit, in a way that differs from their regular promotion response. Even if they maintain their visits before the ReTSS, awareness of and interest in the upcoming event may make current customers more strongly decelerate certain purchases—depleting inventories of items in their pantry to replenish them during the event.
During the event period, and once customers are in the store, the combination of benefits (rather than their reach or salience) especially sets ReTSS apart from other promotions. These benefits may provoke multiple, sometimes countervailing, purchase responses. The monetary and convenience benefits may enhance indirect cross-store switching, stimulating consumers to procure promoted items at the ReTSS store instead of other visited stores (Chandon, Wansink, and Laurent 2000). These same benefits may also foster purchase expansion, as when people buy and consume more of the promoted products (Ailawadi and Neslin 1998; Ailawadi, Gedenk, et al. 2007). Moreover, because they find the offer so interesting, consumers (in particular current customers; Ailawadi, Gedenk, et al. 2007) may more strongly accelerate their purchases, which increases purchase volume in the course of the ReTSS period but produces deeper postevent purchase dips. When it comes to halo effects, the impact of ReTSS relative to business-as-usual promotions is equivocal. On the one hand, the perceived monetary gains and smart-shopper benefit may produce a windfall or licensing effect and justify extra expenses (Khan and Dhar 2006; Van Heerde et al. 2008). Especially when coupled with the exploration benefits (consumers traveling more aisles), this may result in more (impulse) buying of nonpromoted items (Bell, Corsten, and Knox 2011; Stilley, Inman, and Wakefield 2010). On the other hand, the monetary and smart-shopping benefits may foster cherry-picking (Gauri, Sudhir, and Talukdar 2008)—that is, more consumers visiting the store for promoted items alone. As such, ReTSS may also come with smaller baskets. 7
Likewise, indirect store switching after the event can go two ways. On the positive side, ReTSS may more strongly expand the future basket at the expense of competitors because newly reached consumers have discovered the strengths of the store (Ailawadi, Gedenk, et al. 2007) or because the highly salient deals have elicited reciprocity and a shift in commitment to the store (DeWulf, Odekerken-Schröder, and Iacobucci 2001). On the negative side, this same promotion salience, along with the increased emphasis on smart shopping, may make customers less willing to pay the full price and cause shifts to rival stores after an event (Van Heerde and Neslin 2017).
ReTSS Impact on Visits and Purchases over Time: Expectations
Adding up the responses 8 in each period (across the rows in Table 2, Panels B and C), the bottom of Table 2 summarizes the anticipated visit and purchase outcomes before, during, and after the event. Compared with business-as-usual promotions, we expect ReTSS to lower (extant) customers’ visits and purchases prior to the event. In the course of the ReTSS period, we anticipate more visits, including visits from new customers. Because the increase in basket size from temporal shifts, expansion, or increased halo effects, on the one hand, is likely to exceed any negative effects of cherry-picking (reduced halo effects), on the other, we also expect purchases per visit to more strongly increase. Following the event, although newly acquired customers may continue to visit and buy at the store for some time, we expect this effect to be outweighed by below-baseline levels for extant customers, so we anticipate a larger postevent drop in visits and purchases.
How these effects net out over time is not clear a priori, and we leave it as an empirical issue. Next, we present the household-level visit and conditional-purchase models used to verify these effects.
Model
As indicated previously, a ReTSS may influence both the decision to visit a retailer and the basket size at that retailer. Similar to Fox, Montgomery, and Lodish (2004) and Zhang and Breugelmans (2012), we model this in two layers.
Visit incidence
The first layer captures a household’s decision about whether to visit a retailer in a given week. Like Zhang and Breugelmans (2012), we focus on retailer-visit incidence rather than retailer choice for a given visit, because large-scale events may well affect households’ trip organization and number of store visits (e.g., they may begin to split their grocery trips between their regular and the promoting store in a given week). We specify the probability that household h visits retailer r in week w as follows:

with

where
Conditional purchase volume
The second layer relates to households’ purchases at a retailer in a given week, equal to 0 if the retailer is not visited, and some quantity

where
To accommodate unobserved household heterogeneity, the parameters in the visit and purchase models follow a normal mixing distribution (with means and standard deviations to be estimated). We estimate Equations 1 –3 with simulated maximum likelihood.
Data and Measures
Data
Our primary data source consists of GfK panel data from 2008, week 31, until the last week of 2012. The data set contains household purchase histories as well as weekly price levels and feature activities at all Dutch retailers. We consider household purchases at the top seven retailers in terms of market share. Table 3, Panel A, provides some descriptive statistics for the considered retailers, which, together, cover about 60% of the Dutch grocery market. To ensure stable estimates, we retain only households that remain in the panel for more than 26 weeks and that make at least ten visits to (any of) the top seven chains throughout our observation window. For tractability, we estimate our models on a random subsample of 1,000 households. On average, a household visits 1.19 retailers per week and spends €31.73 per visited retailer. Albert Heijn has by far the highest weekly visit rate (i.e., fraction of weeks with a chain visit, averaged across households), followed by Aldi, C1000, and Lidl. Weekly spending by store visitors is more comparable across chains, with slightly higher levels for Albert Heijn and lower levels for the hard discounters.
Descriptives.

a Fraction of weeks with household visit, averaged across households.
b Weekly spending per household, conditional on store visit (in euros), averaged across households.
c A detailed timeline for the ReTSS is given in Web Appendix W3.
d Number of promotions that fall under the event-theme heading, based on anecdotal information and industry/press reports. “Products” can refer to entire brands or SKUs.
e Average of LexisNexis mentions in event-year.
Notes: Hi–lo = adoption of a high–low pricing scheme; HD = hard discounter; EDLP = everyday low pricing. Level = the average value at the retailer during event weeks (including any concurrent business-as-usual promotions or advertising). Index = the value relative to weeks without a ReTSS event at the same retailer. During ReTSS weeks, the retailer also features other promotions that do not fall under the event-theme. Depending on the number and discount depth of such other promotions, the total number of feature promotions and discount depth during ReTSS weeks may be higher or lower than usual. Likewise, mass-media budgets can be lower during ReTSS weeks than non-ReTSS weeks because of mass-media image campaigns or communication of other events during non-ReTSS weeks.
Promotion Events: Descriptive Statistics
To identify the promotion events that qualify as ReTSS, we combine several additional sources. We begin from a data set compiled by GfK that contains descriptive information, by retailer and week, on promotional actions that are somewhat broader (i.e., covering more than one specific brand/SKU in a specific category). As such, it includes a very diverse set of promotional events. For each event, it contains the name as communicated by the retailer, the event timing, and, in many instances, information on the deal format and the promotional conditions. Wherever the latter event-specific information is missing, we supplement it with data from newspapers and industry sources available online. Our second source consists of Nielsen data on weekly advertising spending, by retailer and by medium. These data allow us to gauge the advertising support received by these events through mass media (TV, print, and radio). Drawing on the event information and the characteristics in Table 1, two independent judges classified each event as one of the following types: Seasonal Events (e.g., promotion events related to Easter, Christmas), Temporary Loyalty Programs (e.g., saving stamps for collectables), Category Themes (e.g., “Best Deals with the C1000 Butcher”), Popular Events (e.g., buying merchandising products for World Cup Soccer), Business-as-Usual promotions (premiums, quantity discounts, or coupons on specific items that are not part of an overarching theme), and ReTSS. The classification by the experts was identical in 98.4% of the instances, and the few disagreements were resolved through discussion.
Table 3, Panel B, provides an overview of the ReTSS. We identify nine different ReTSS, all of which occur at traditional retailers, as hard discounters have no such savings events. On average, a ReTSS event lasts three weeks, with a maximum of four weeks, and some events recur multiple times during our observation period (Web Appendix W3 documents the calendar times of the events). Each ReTSS has a distinctive theme (e.g., “Hamsterweeks”), whose core message is that the consumer can save large amounts of money by shopping at the retailer during the event. All ReTSS deals follow a unified format, with a consistent (low) price point (e.g., all for €1; Event 2), deep percentage discount (e.g., 50% off in Events 6 and 7), or a multibuy offer (e.g., BOGO in Events 3, 4, and 5). The items promoted under the theme heading usually rotate weekly. While the number of items varies (ranging from <30 per week for Event 1 to 100 per week for Event 2), the deals span a wide range of categories. Moreover, as Table 3 shows, retailers use mass-media advertising during each ReTSS event.
Retailers may run different types of promotions concurrently; for example, during ReTSS weeks, consumers may also receive (business-as-usual) deals on specific brands and SKUs that are not part of the ReTSS offer. To isolate the impact of ReTSS per se, it is therefore imperative to assess (and account for) the overall depth and breadth of weekly promotional activity at the store level. Next to the event list and the advertising data, the GfK scanner panel provides us detailed indications—for each SKU in each week—on actual prices and promotions/feature appearances. We use these data to calculate, for each retailer-week, the total number of SKUs advertised in the store flyer (including offers that do and do not fall under the event theme), and the discount depth on promoted items (details on the operationalization are provided in the variables section). Table 3, Panel B, provides summary statistics for those variables during ReTSS, in absolute terms, as well as relative to nonevent weeks at the same retailer. It shows that the focal retailer carries more SKUs on feature and offers deeper discounts (p < .01 for all events) in ReTSS weeks than in other weeks. 10
Even if all ReTSS events do enjoy mass-media support, advertising spending is not always higher on average in event weeks than in nonevent weeks (see Table 3). This is because retailers advertise other types of events as well (see Table 1 and Web Appendix W1) or engage in image advertising unrelated to promotions, and because ad investments are subject to seasonal and long-term changes. 11 To grasp the presence and timing of (extra) advertising support related to our savings events, we regress retailers’ weekly advertising spending (stacked for the four retailers involved in these events) against retailer-specific constants, time-related variables (i.e., year and quarter dummies, a trend, and end-of-year and beginning-of-year dummies), and variables related to the occurrence of the ReTSS. Specifically, we include dummy variables for (1) the week before the start of an event, (2) the first event week, and (3) the remaining event weeks. The results show that there is no significant lead-week advertising effect, but that advertising is typically higher in the first week of the event and lower in remaining event weeks.
Model-Free Evidence
Table 4 provides model-free evidence on the impact of the different ReTSS. For each retailer and event, it reports the mean (standard deviation) of the weekly unconditional purchase amount per household (in euros), the weekly visit propensity per household, and the purchase amount conditional on a visit in that week. It does so for event weeks as well as baseline weeks (in which no ReTSS takes place at the focal retailer) and calculates the change rate.
Model-Free Evidence.

aBaseline weeks are weeks for the focal retailer without a ReTSS event for that retailer.
bStandard deviation between brackets.
A few tentative observations can be made. First, for most events (seven of nine), spending levels are higher during event weeks. Second, this overall spending shift conceals countervailing forces: whereas retailer patronage (i.e., the number of households visiting the chain at least once) typically increases during event weeks, spending per visitor often decreases. Third, there are differences between events: some ReTSS show sizable increases in sales (e.g., Events 2 and 6, with spending levels that are almost 15% higher), others seem less successful (e.g., Event 1, during which we observe a 17% sales decline). The ReTSS effects also vary within retailers, as illustrated by Events 2 and 7, which—although organized by the same chain—show different spending increases.
However, the values in Table 4 should be treated with caution. First, they do not distinguish quantity from price effects (consumers paying less per unit during event weeks). Second, because they do not control for changes in other variables that co-occur with the events, they cannot be interpreted as causal effects. Third, they do not allow us to separate the dynamic (over-time) impact of the events. Fourth, they do not account for reaction differences among consumers. Our formal modeling approach addresses these issues.
Variables and Operationalization
Table 5 describes the variables and their operationalization. For each household, we set aside a 26-week initialization period and use the remaining observations for calibration.
Variable Descriptions.
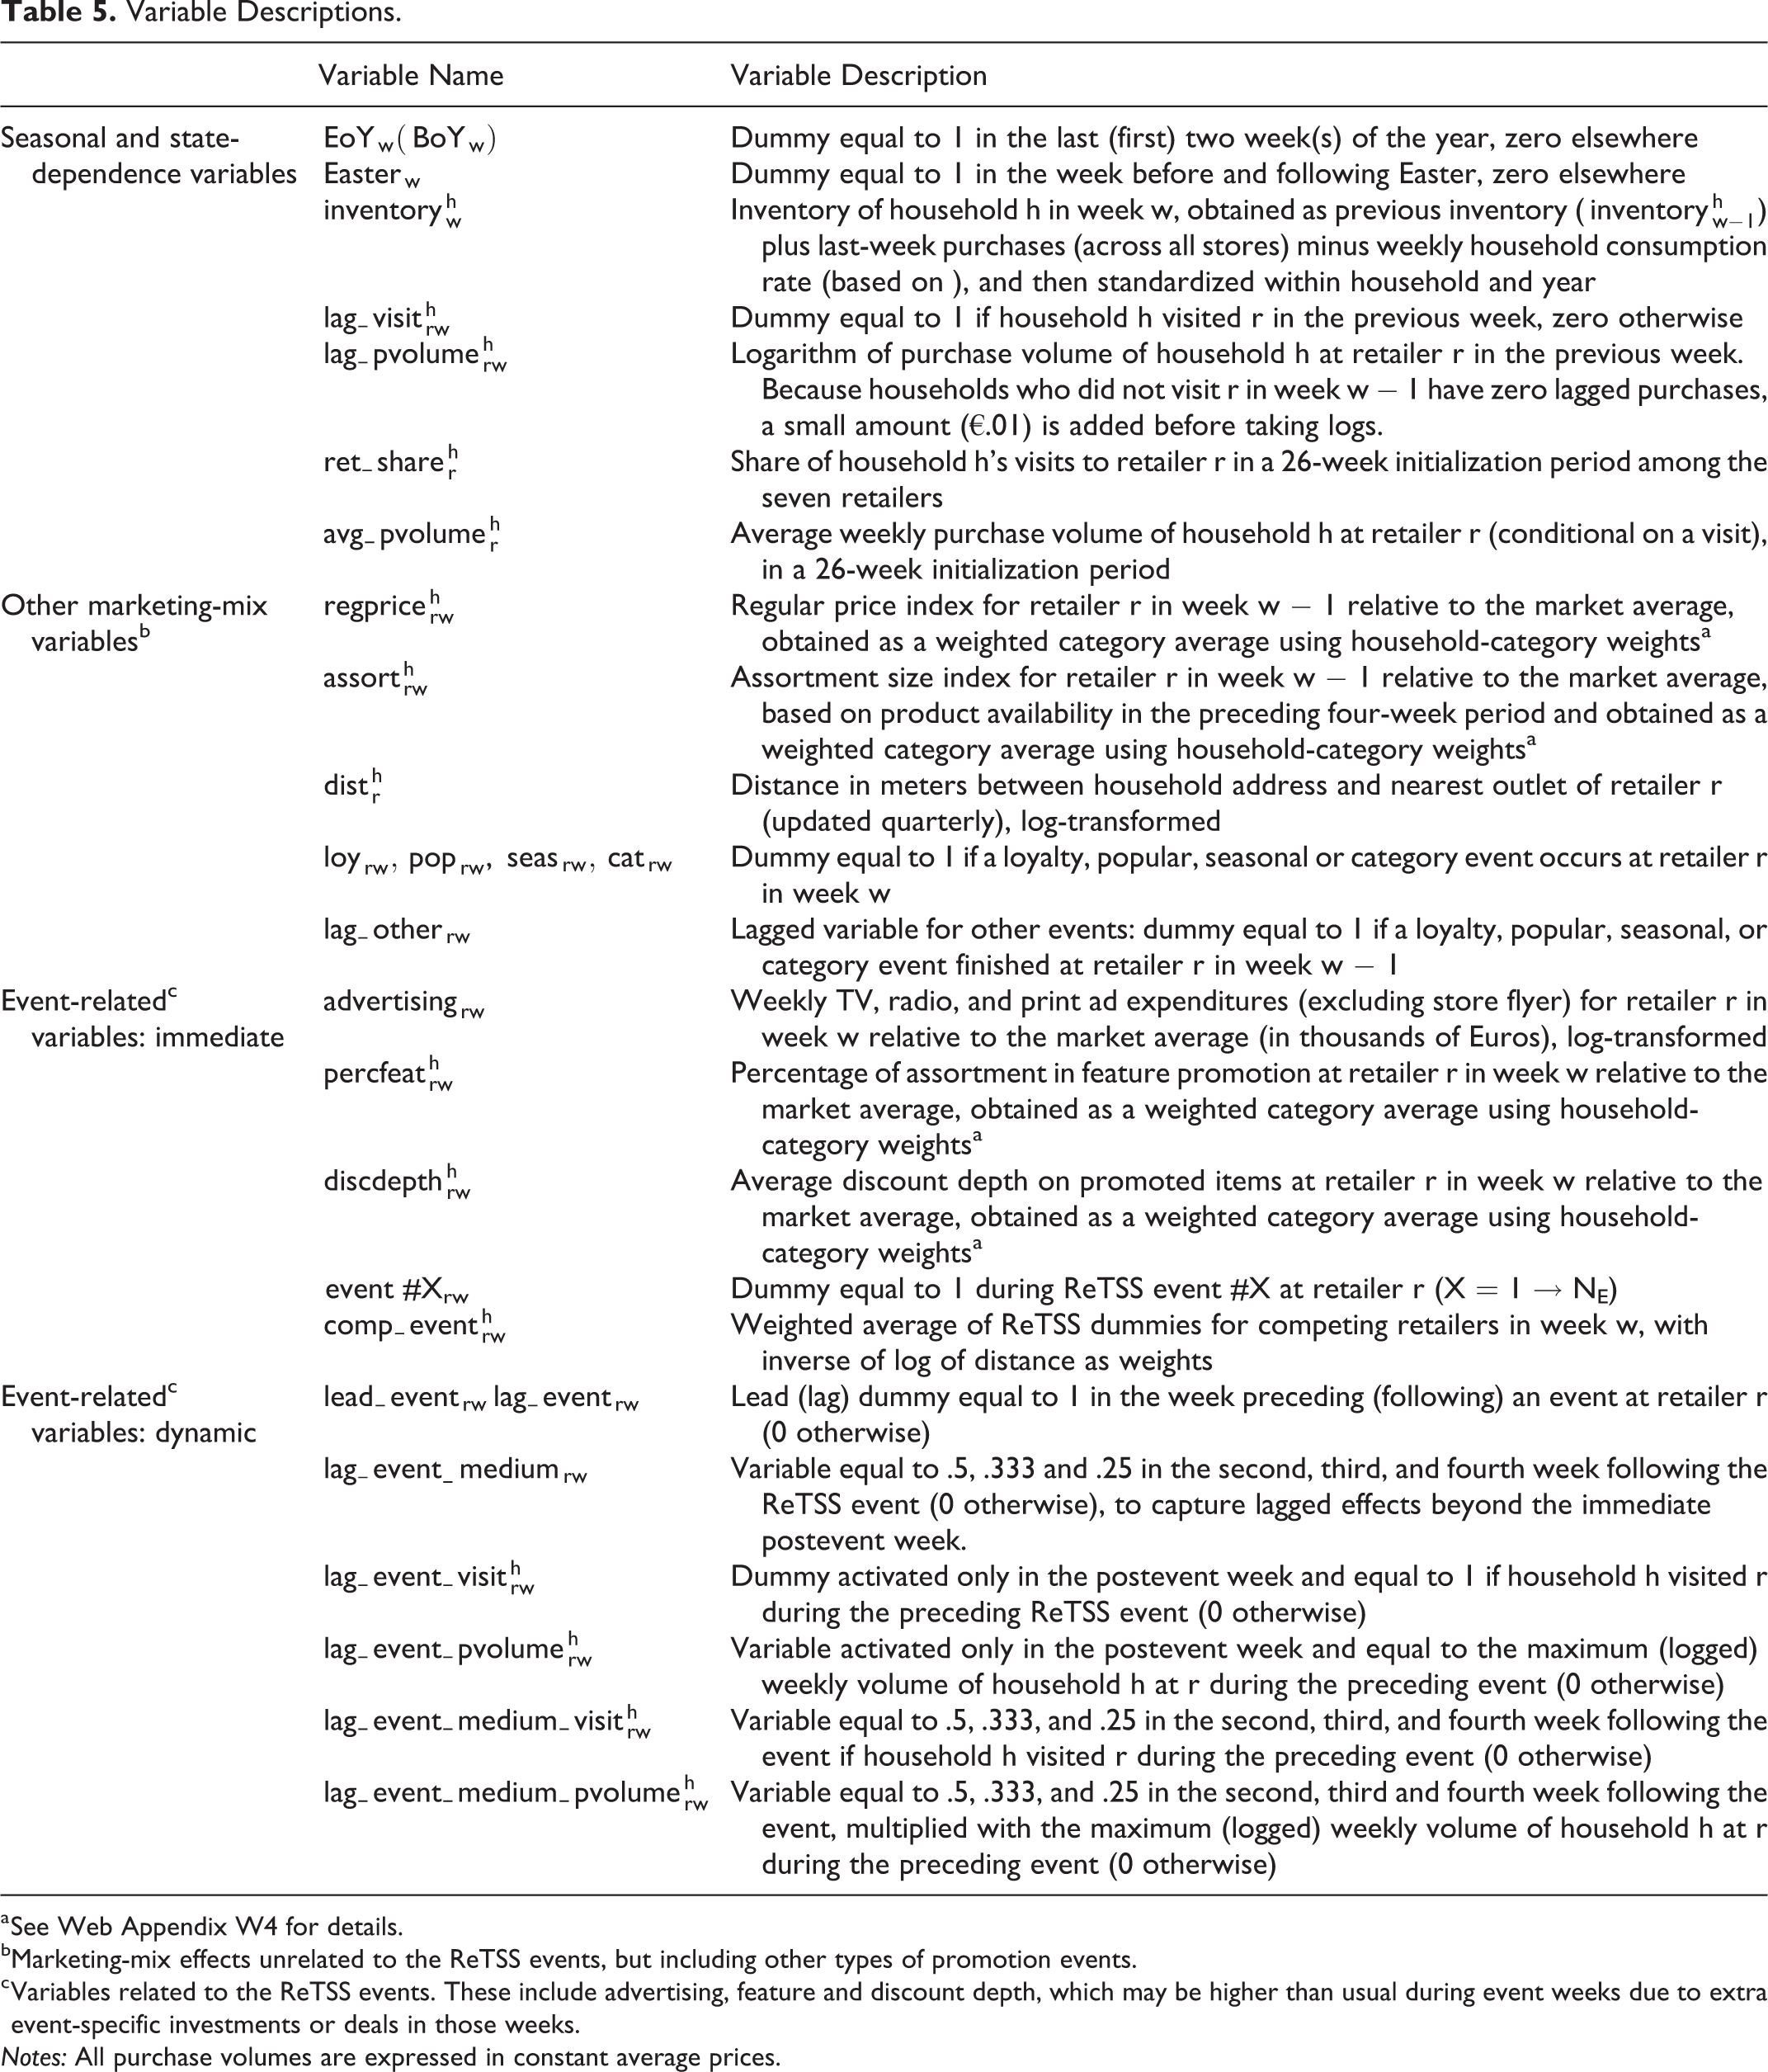
a See Web Appendix W4 for details.
bMarketing-mix effects unrelated to the ReTSS events, but including other types of promotion events.
c Variables related to the ReTSS events. These include advertising, feature and discount depth, which may be higher than usual during event weeks due to extra event-specific investments or deals in those weeks.
Notes: All purchase volumes are expressed in constant average prices.
The dependent variable in the retailer-visit model is a dummy equal to 1 for each retailer patronized by the household in the considered week, and 0 otherwise. In the purchase-volume model, the dependent variable is the logarithm of the volume purchased (
As explanatory variables, next to retailer constants, we incorporate multiple drivers of store visits and purchases identified in the literature (see, e.g., Fox, Montgomery, and Lodish 2004; Van Heerde and Neslin 2017). A first set comprises seasonal and state-dependence variables. To account for seasonality, we include end-of-year, beginning-of-year, and Easter dummies (
Second, we incorporate marketing variables unrelated to the ReTSS. These include the (log-transformed) distance to the nearest retailer outlet
The third set of variables captures the impact of the ReTSS events during event weeks. These include the (log of) investments in mass media
The fourth set of variables relates to the ReTSS dynamics.
Estimation Results
Store Visits
Table 6 reports the results for the visit-incidence model. With an average probability for hits of .654, the model fits the data well, and far better than chance. 15 For simplicity of exposition, in this section we focus on the estimated population means. We briefly discuss the control variables (i.e., the seasonal, state dependence, and other marketing variables) first. Inventory reduces the propensity to visit a store. The coefficient of the household’s initial retailer share is positive, pointing to explained heterogeneity, as is the lag-visit parameter, indicating that shoppers tend to revisit a retailer where they shopped before. Distance exerts a negative, and assortment a positive, impact. The regular-price coefficient is not significant, probably because most of the price variation is promotional and thus captured in the discount variable. Except for seasonal events, the coefficients of non-ReTSS events (i.e., loyalty, popular, or category events) are not significant, nor is their lag—indicating that they do not alter traffic relative to business-as-usual weeks (which serves as the reference).
Parameter Estimates.
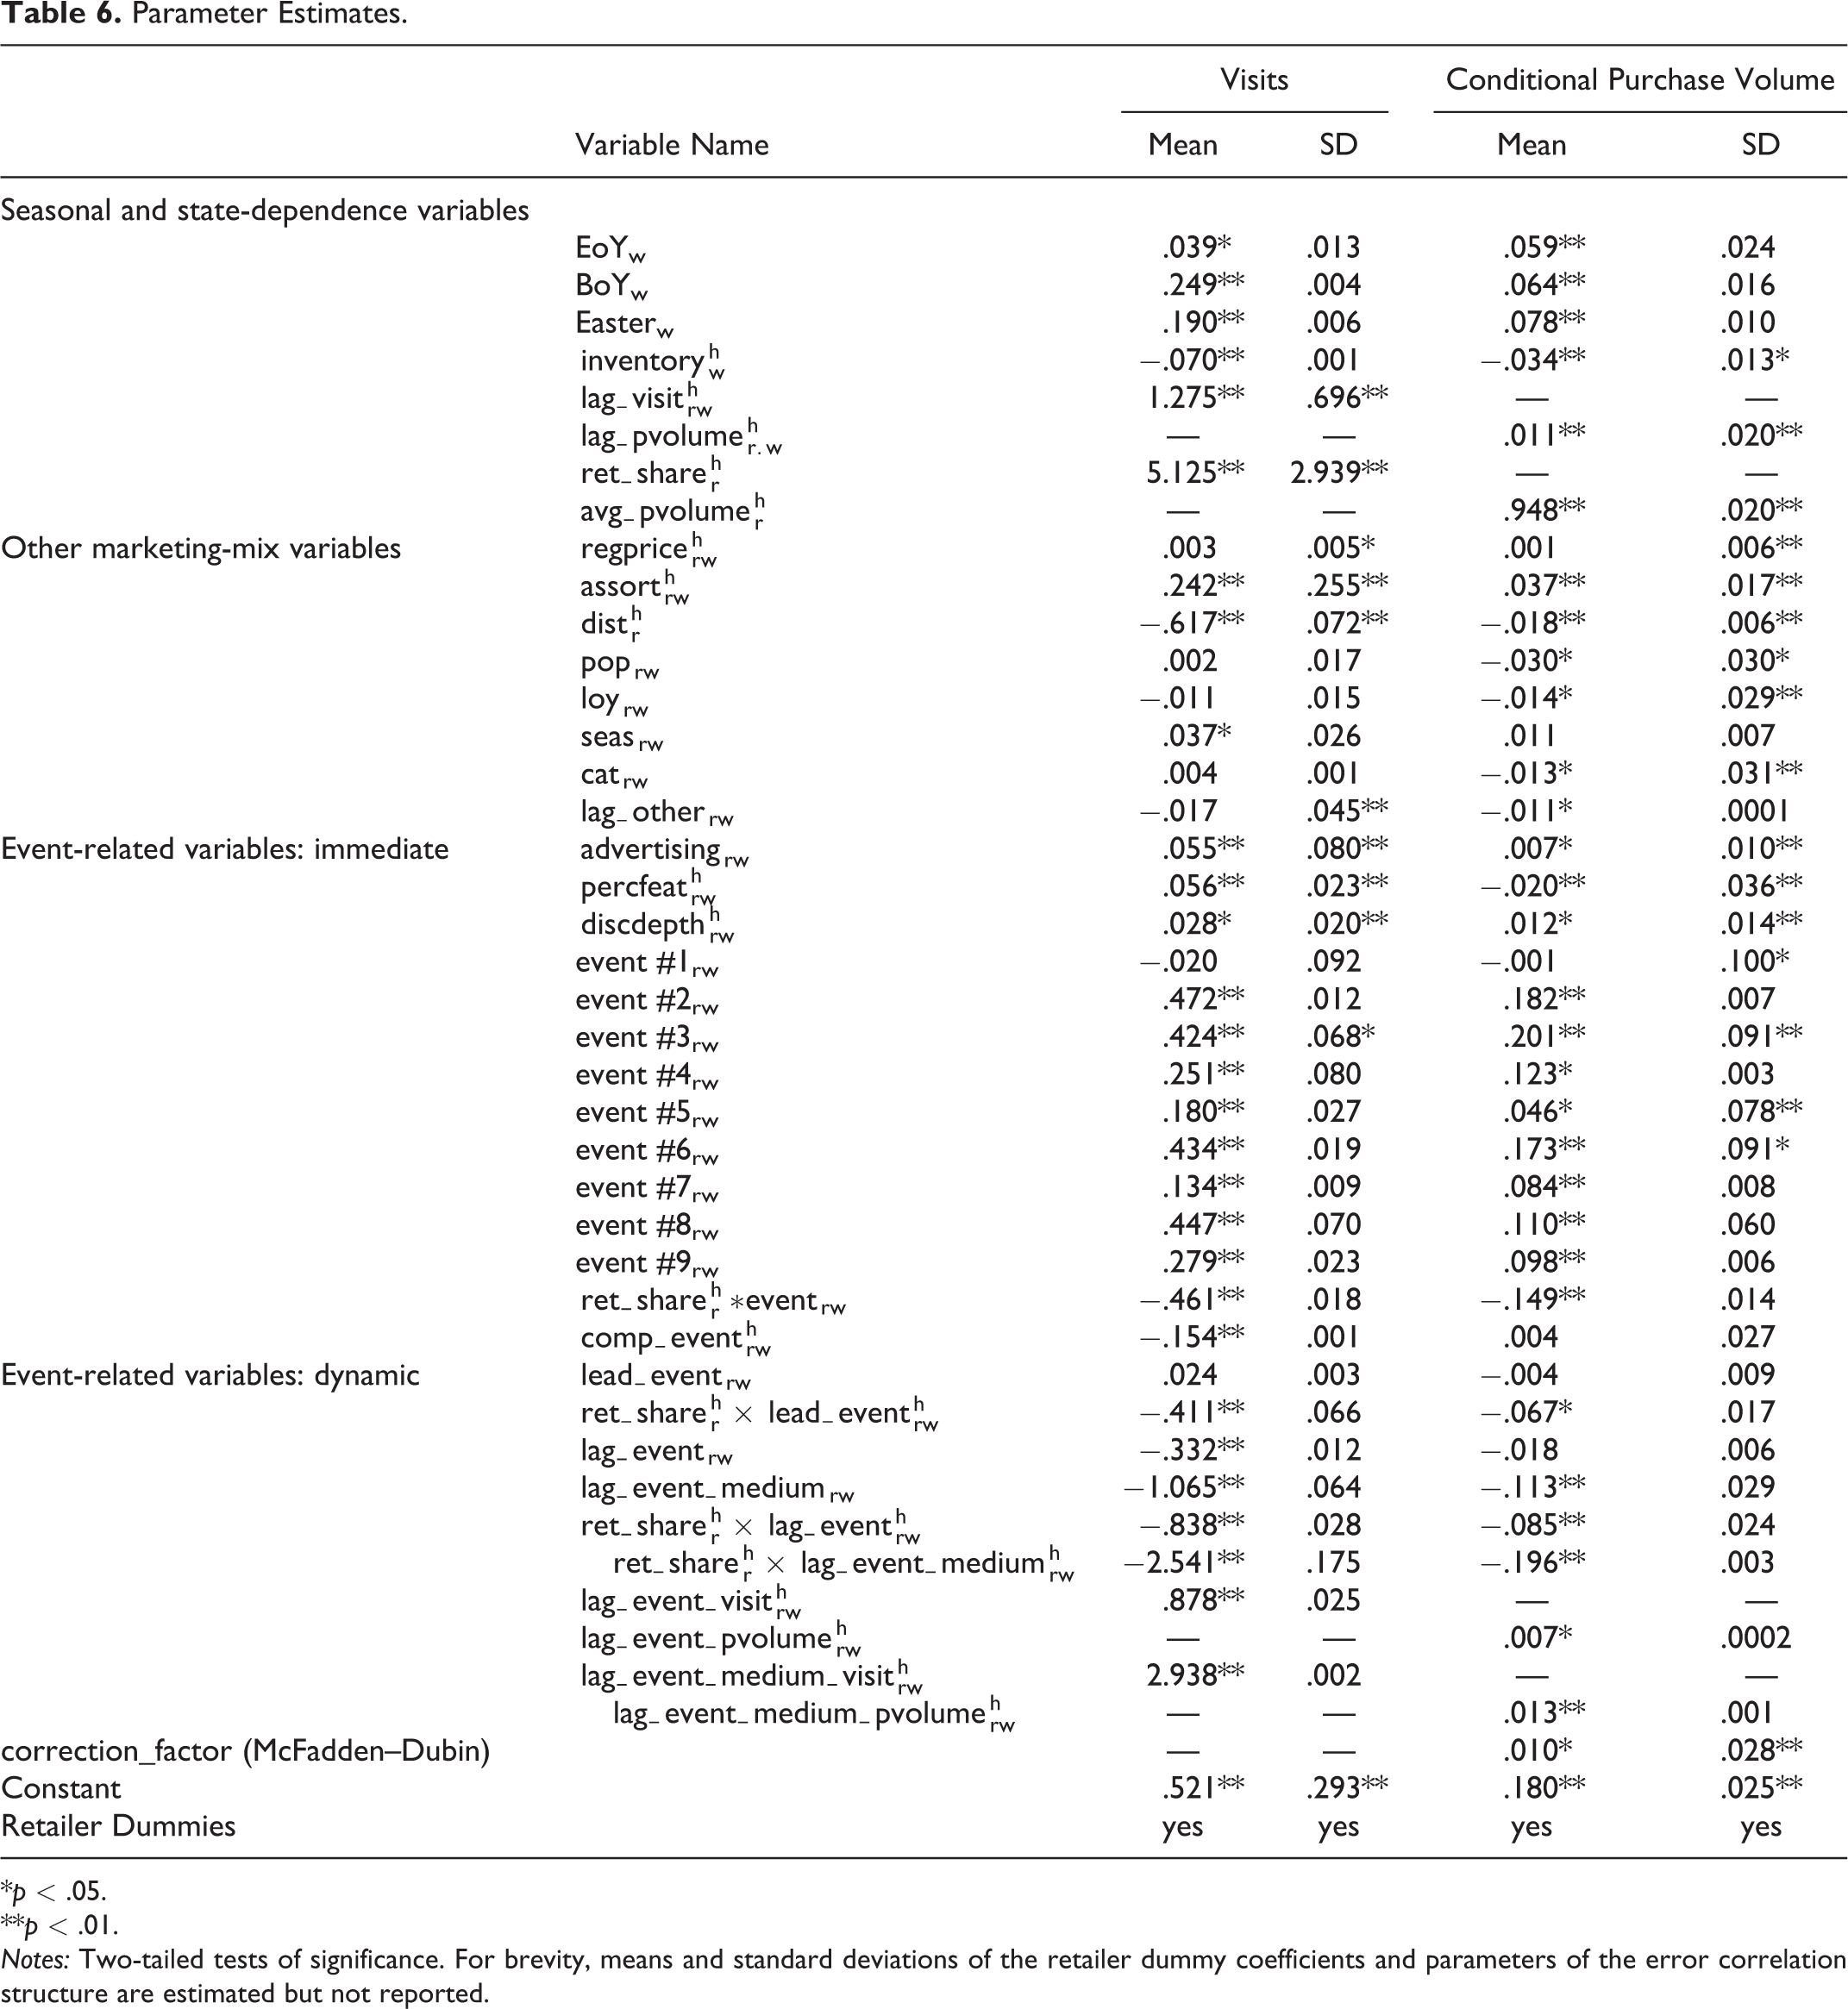
*p < .05.
**p < .01.
Notes: Two-tailed tests of significance. For brevity, means and standard deviations of the retailer dummy coefficients and parameters of the error correlation structure are estimated but not reported.
Turning to the immediate ReTSS-related effects, we find that discount depth, percentage of SKUs featured, and ad spending have the expected positive impact. In addition, all events show positive and significant dummy coefficients—except Event 1, whose impact is not significant. For the remaining events, the coefficients range from β = .134 (Event 7, p < .01) to β = .472 (Event 2, p < .01). Overall, this indicates that ReTSS do enhance store patronage during event weeks beyond the pure discount or advertising effects. The negative parameter associated with the Retailer Share × Event interaction (β = −.461, p < .01) indicates that ReTSS draw disproportionately less from regular store customers. A competing retailer event lowers the likelihood of a store visit for the focal retailer (β = −.154, p < .01). This confirms that, because of their high awareness and unusual perceived benefits, the events attract new customers through extra visits and/or direct store switching.
As for the dynamics, the coefficient of the lead-event dummy is not significant (p > .10), but its interaction with the household’s prior retailer share is significantly negative (β = −.411, p < .01), indicating that regular customers postpone store visits in anticipation of the event. We obtain negative coefficients for the lagged-event variables in the week following the event (β = −.332, p < .01) and afterward (β = −1.065, p < .01), as well as for their interactions with the households’ initial retailer-visit share (β = −.838, β = −2.542, p < .01). This is consistent with stronger acceleration effects among heavier (i.e., more frequent) customers. Interestingly, though, the coefficients of
Conditional Purchase Volumes
The right-hand side of Table 6 reports the results for the purchase-volume model conditional on a visit. The pseudo-R2, compared with a null model with store intercepts only, equals .702, and the mean absolute percentage error of predicted versus actual purchase volumes is only 6.92%, pointing to high explanatory power. Turning to the parameter estimates, we first consider the control variables. Households buy more at their customary store, as shown by the positive coefficients of average initial retailer purchases and lagged purchases. However, they procure smaller baskets when their inventory is still high. Purchases are higher in nearby stores with larger assortments. The regular-price coefficient is not significant—possibly, again, due to lack of variation. Once in-store, households spend less during loyalty, popular, and category events than during business-as-usual promotion weeks. 16
Our focus is on the ReTSS-related effects. As for the immediate effects, we find that baskets increase with deeper discounts and more mass-media advertising. Whereas feature activity enhances households’ propensity to visit the store, it has a negative impact in the conditional-purchase model, suggesting that feature ads attract smaller-basket shoppers. 17 The event-dummy coefficients again reflect the impact of the event over and above the discounts and advertising investments per se. They are significantly positive for eight of nine events (and insignificant for the other): the effect is largest for Event 2 (β = .182), Event 3 (β = .201), and Event 6 (β = .173) (all ps < .01). The coefficient of the Retailer Share × Event interaction is negative but smaller in absolute value (β = −.150, p < .01). Thus, even for regular customers, baskets tend to increase during event weeks because customers stock up on promoted items (acceleration), consume more (expansion), and/or explore the aisles or feel licensed to purchase extra nonpromoted items (halo effects). In contrast, although events at nearby rival stores reduce households’ propensity to visit, they do not affect purchases beyond the competitive impact already included in the relative discount variable (p > .10).
Turning to the dynamics, the main lead effect is insignificant (β = −.004, p > .10), but its interaction with retailer-visit share is negative (β = −.067, p < .05), indicating that current customers decelerate purchases if they suspect an upcoming event. Finally, we obtain an interesting pattern of postevent effects. Heavier customers show deeper quantity dips immediately following the event (β = −.085, p < .01) and in the few weeks afterward (β = −.196, p < .01), a pattern indicative of purchase acceleration. However, consumers who bought more at the store during the event show a positive effect afterward (β = .0073, p < .05; β = .013, p < .01), consistent with the notion of increased store familiarity or commitment.
Simulations
Although the coefficients in Table 6 shed light on the significance of event effects, they do not give a clear picture of the effect sizes or the net outcome of the (countervailing) dynamics. We use simulations to provide such insights. Using the actual data as a backdrop, we dynamically predict the panelists’ visit sequence and purchase volumes per visit for each retailer, using their posterior estimates of the visit and purchase models and based on the procedure described in Train (2009). Starting from the first week, we calculate the panelist’s visit probability for each retailer in the subsequent week. We then simulate 100 shopping sequences, each time taking a random draw from this probability to predict whether the retailer is visited in the shopping sequence in that week. For each visited retailer, we calculate the panelist’s purchase volume based on the conditional-purchase model coefficients. Using these values, we update all the dynamic variables (i.e., inventory and all lagged variables) for the next week. We then average the results across shopping sequences to obtain the panelist’s visits, conditional purchases, and total purchases (not conditional on a visit; thus equal to 0 in weeks without a store visit) per week and retailer. Using the actual retailer prices during event and nonevent weeks, we also obtain the corresponding spending levels. Finally, we add a layer to the simulations in which we draw sets of values for the means and standard deviations of the mixing distributions and obtain the corresponding posterior estimates by household and the associated ReTSS effects. We use the distribution of these outcomes to assess the statistical significance of the effects.
We simulate three scenarios. In the Baseline scenario, we use the actual levels of the non-event-related explanatory variables but, in weeks where a ReTSS occurred, we set the event-related dummies to 0, and the promotion (discount depth and percentage of SKUs on feature) and advertising variables equal to their expected level in nonevent weeks. 18 In the Event + Support scenario, we fix a (three-week) event period. For each retailer, in turn, we assume that an event at that retailer took place (i.e., we activate all event-related variables for that retailer, set the promotion and advertising variables to their values during the retailer’s event period, and flag the presence of a competing event for other retailers). To separate the impact of increased advertising and discounting from that of the event theme as such, we also consider a Support Only scenario, in which we keep advertising, features, and discounts at their event levels but set the event-related dummies to 0. For each retailer and week, we then compare the households’ visit propensity, purchase volumes, and spending in the Event + Support and Support Only scenarios with the Baseline.
Impact During Event Weeks
Table 7, Panel A, reports the change in weekly visit propensity, purchases (spending) conditional on a visit, and total weekly store purchases (spending) during the event period, based on comparison of the Event + Support and the Baseline scenarios. It does so for the average, worst, and best event (results for individual events are in Web Appendix W5). As we expected, for eight of nine events, ReTSS leads to significant increases in store visit propensity. Visit incidence during event weeks increases by 7.75% on average (a 1.58-percentage-point increase, p < .01), but with variation across events (lowest value: −.25% for Event 7, highest value: 20.22% for Event 6). As the “Conditional Volume” row indicates, average basket sizes during ReTSS weeks also increase, but the effect is minimal (+.34% on average) and statistically insignificant. Combining the two, we find that the “Total Volume” typically increases during event weeks, with an average lift of 8.47% (p < .01) and an increase of up to 20.74% for the most successful event (Event 6). Retailers thus enjoy a clear upswing in visits and total purchases 19 in the course of the event. On average, this lift in purchase volume translates to a 3.67% immediate spending increase, with significant positive numbers for six of nine events, ranging from a decrease of 8.94% for the worst-performing event and to an increase of 14.61% for the best-performing event.
Overall Impact of ReTSS over Time.

*p < .05.
**p < .01.
a Impact over the eight-week period following the event.
b Impact over the 12-week period (1 pre-event week + 3 event weeks + 8 postevent weeks).
Notes: One-tailed tests of significance based on distribution across parameter draws. % = the percentage change relative to the no-event baseline. Results for all events are given in Web Appendix W5. “Worst” and “Best” correspond to the lowest and highest % figures across events for a given period and outcome variable. Conditional volume = the change in purchase volume over the considered period, per household, given a visit, and expressed in constant monetary value (Euros). Total volume = the change in total purchase volume (in Euros) over the considered period, per household, unconditional on a store visit (so: zero if the household did not visit the store in those weeks). Total spending = the revenue equivalent of total volume, based on actual prices during (or before/after) the event. The economic significance of these figures is clear from Table 9, where we report the equivalent revenue value at the market level.
Dynamic Effects
The question remains (1) to what extent extra visits or higher purchases during the event period are due to the ReTSS as such, rather than merely to the accompanying promotion or advertising effort, and (2) if they are offset by negative pre- and postevent effects. Using the simulation results (i.e., comparing the Event + Support and Baseline scenarios), we calculate the changes in visits and total purchase volumes before, during, and after the event. We also consider the impact of increased mass advertising, featuring, and discount support absent an event theme (i.e., the difference between the Support Only and Baseline scenarios; Figure WA1 in Web Appendix W5 plots these results for three exemplar events). Two findings emerge. First, the larger part of the uplift during event weeks (across all events: 89.24% for visits, 80.91% for conditional volume) stems from the event as such: simply stepping up advertising or promotion activities entails a much smaller increase in visits and purchases (for details by event, see Web Appendix W5). 20 Second, the ReTSS impact extends beyond the event period and subsides in about eight weeks.
Building on these insights, Table 7 reports, for each event, the impact (Event + Support minus Baseline) in the preceding week (Panel B), the eight weeks following the event (Panel C), and the net impact (Panel D). The table confirms the presence of negative anticipation effects in visits (−2.70% on average), basket sizes (−2.02%), and total purchase volumes (−7.84%; all ps < .01). Interestingly, the pattern of postevent effects is mixed. Against expectations, visits are still higher on average in the eight-week period following the event (+1.45%, p < .05), but this effect is nullified by lower purchase volumes per visit (−.86%, p < .01). Combining the figures across periods, we find that while the events yield a net visit increase on average (+2.68%, p < .01), this is partly offset by smaller basket sizes (−.66%, p < .01), resulting in only a 1.08% (p < .05) net increase in total purchase volume. For total incremental spending, we observe a bleak overall picture: the average being close to 0 (−.10%, p > .05), albeit again with differences between events (−3.74% to +3.23%).
Impact by Customer Segment
Drawing on our conceptual framework and estimation results, we expect the values in Table 7 to conceal reaction differences between more and less customary shoppers of the store. To further explore this, for each retailer and event, we consider the visit and purchase effects for bins of customers with lower versus higher prior visit shares at that retailer (each bin representing an incremental 10% prior visit rate; plots for exemplary events are given in Web Appendix W5). We find that visits increase especially for nonregular customers of the store; for example, for Event 4 (which is close to average), the visit propensity increases by 21% for consumers with a 5% prior-visit probability (first bin) against a status quo for those with a 45% prior-visit rate (fifth bin). These consumers also account for the largest lift in purchase volumes; for example, for Event 4, the total purchase lift amounts to 35% for consumers with a 5% prior-visit rate, but only 8.3% for those with a 45% prior-visit rate. Higher-bin customers do not generate net volume gains: these consumers do not increase their visit rates, and their extra purchases during event weeks are likely cannibalizing nonpromotion purchases during or following the event.
Competitive Effects
If ReTSS yield extra business during the event, who suffers? To address this, we check the changes in visits and purchases in rival stores produced by a ReTSS at the focal store and calculate the portion of these changes that is borne by traditional versus hard-discount chains. We find that the larger share the competitive shifts (i.e., about 67% [70%] of the competitive visit [purchase] losses) is at the expense of traditional supermarket rivals, but this may merely be because they represent a larger share of the market (72%) to begin with. To explore this further, we identify the consumers who contribute most strongly (top 10%) versus least strongly (bottom 10%) to the ReTSS’s (immediate) visit and purchase lift and compare their store-type allegiance in the initialization period. Interestingly, we find that for each event and for both visits and purchases, the more responsive consumers have a significantly higher share of wallet at hard-discount chains (on average, more than twice the share: 31% vs. 14%; for more details, see Web Appendix W6). Thus, hard-discount shoppers in particular incur extra visits and increase their purchase volume in response to the event. In summary, this indicates that although both traditional competitors and discounters suffer, ReTSS events disproportionately draw business from hard-discount rivals.
Success Drivers and Profitability
Drivers of ReTSS Success
The results show substantial differences in impact between ReTSS events. What drives these differences? In line with our conceptualization, the success of a ReTSS (over and above the accompanying advertising and discounting) may depend on the deal format (i.e., uniform [low] price per product, BOGO, or percentage discount), scope (number of products eligible for the ReTSS each week), discount depth, (extra) amount spent on advertising, and resonance of the event theme. To explore this further, we conduct a moderator analysis 21 : we rerun the visit and conditional-purchase models after replacing the event dummies with a function of these characteristics. Because, unlike the other characteristics, theme resonance is not directly observable, we approximate it through media attention to the ReTSS, as reflected in the number of LexisNexis mentions (offline and online articles that refer to the ReTSS) for each year in which it runs. To reduce the concern that ReTSS’s success drives the media attention (rather than the other way round), we use previous-year values for the LexisNexis mentions. We also add the number of times the event has run before as a potential driver, the impact of which may be positive (higher event recognition) but also negative (wear-out).
Table 8, Panels A and B, summarize the key results. Recall that because advertising and promotion are separately accounted for in the model, these coefficients indicate what makes the event as such more successful, over and above the underlying ad budgets, features, and discounts. We find that while the ReTSS’s design characteristics hardly shape the conditional-purchase effects (Table 8, Panel B), they do influence its impact on visits (Table 8, Panel A). Stronger synergetic effects are generated from ReTSS that cover more items. Deal format also matters: (deep) percentage discounts and BOGOs contribute equally strongly to ReTSS success, whereas uniform prices (the financial advantage of which is less clear) bring somewhat lower visit and purchase lifts. Discount depth is not significant, probably because it hardly varies within deal formats. And although retailers always use mass media to advertise the ReTSS, higher levels for those budgets do not differentiate more from less successful events. We do find a strong positive association with press coverage (LexisNexis mentions in the previous year), which enhances both visit propensity and basket size. Together, this suggests that it is the content of the message that matters (rather than the advertising weight) and underscores that having a unique, resounding theme is key. Finally, ReTSS events that ran more frequently in the past do worse in terms of visits and basket size, suggesting the presence of wear-out.
Impact of ReTSS Characteristics.

*p < .05.
**p < .01.
Notes: Two-tailed tests of significance. For brevity, we report only the coefficients of the ReTSS characteristics (i.e., the moderator variables). The full set of estimation results for visits and conditional purchases can be requested from the first author.
Impact on Retailer Profitability
So far, we have documented how ReTSS events affect consumer visits, purchase volumes, and spending. However, even if spending increases, an event may still be unprofitable if the revenue increase for the retailer does not outweigh the margin losses on ReTSS-promoted items. To calculate the profit implications rigorously, we would need detailed information on (1) the specific items sold under the ReTSS heading for each event week, (2) regular retailer margins on these items compared with items that consumers may have shifted away from, and (3) retailer pass-through for all these items in event and nonevent weeks. Because we do not have such data, we resort to back-of-the-envelope approximations of event profitability. For each store and event, we do know the average fraction of revenue sold on deal in event and nonevent weeks and the average discount depth for items sold on deal in such weeks. Based on these figures, the total (gross) profit associated with revenue Rrw for a given retailer and week can be approximated by (see Web Appendix W7):

where m is the average retailer unit margin absent promotions (expressed as a fraction of the selling price), gw is the fraction of the promotional discount borne by the retailer,
Table 9, Panel A, reports the revenue implications at the market level. The table also shows that while the share sold on promotion is higher during event weeks, nonpromotional revenue decreases for only three of nine events and actually increases for Event 6 (+6.46%), in support of a halo effect. Table 9, Panel B, displays the profit outcomes. It shows that the profit implications remain quite limited. If the retailer bears a larger part of the discount during event than during nonevent weeks (e.g., gw_event = .3 and gw_regular = .1; Case 3 in Table 9, Panel B), ReTSS entail a small loss on average (−.44%), with statistically significant losses for five of nine events. If the retailer can convince the manufacturer to contribute more strongly during the ReTSS than usual (something that, as our interviews with retailers reveal, volume-oriented manufacturers or those under threat from hard-discounters are willing to do), the picture becomes slightly different. For instance, if gw drops from .3 in nonevent weeks to .1 in event weeks (Case 4 in Table 9), the loss turns into a small profit gain (+1.47%). 24
Profitability Analysis.
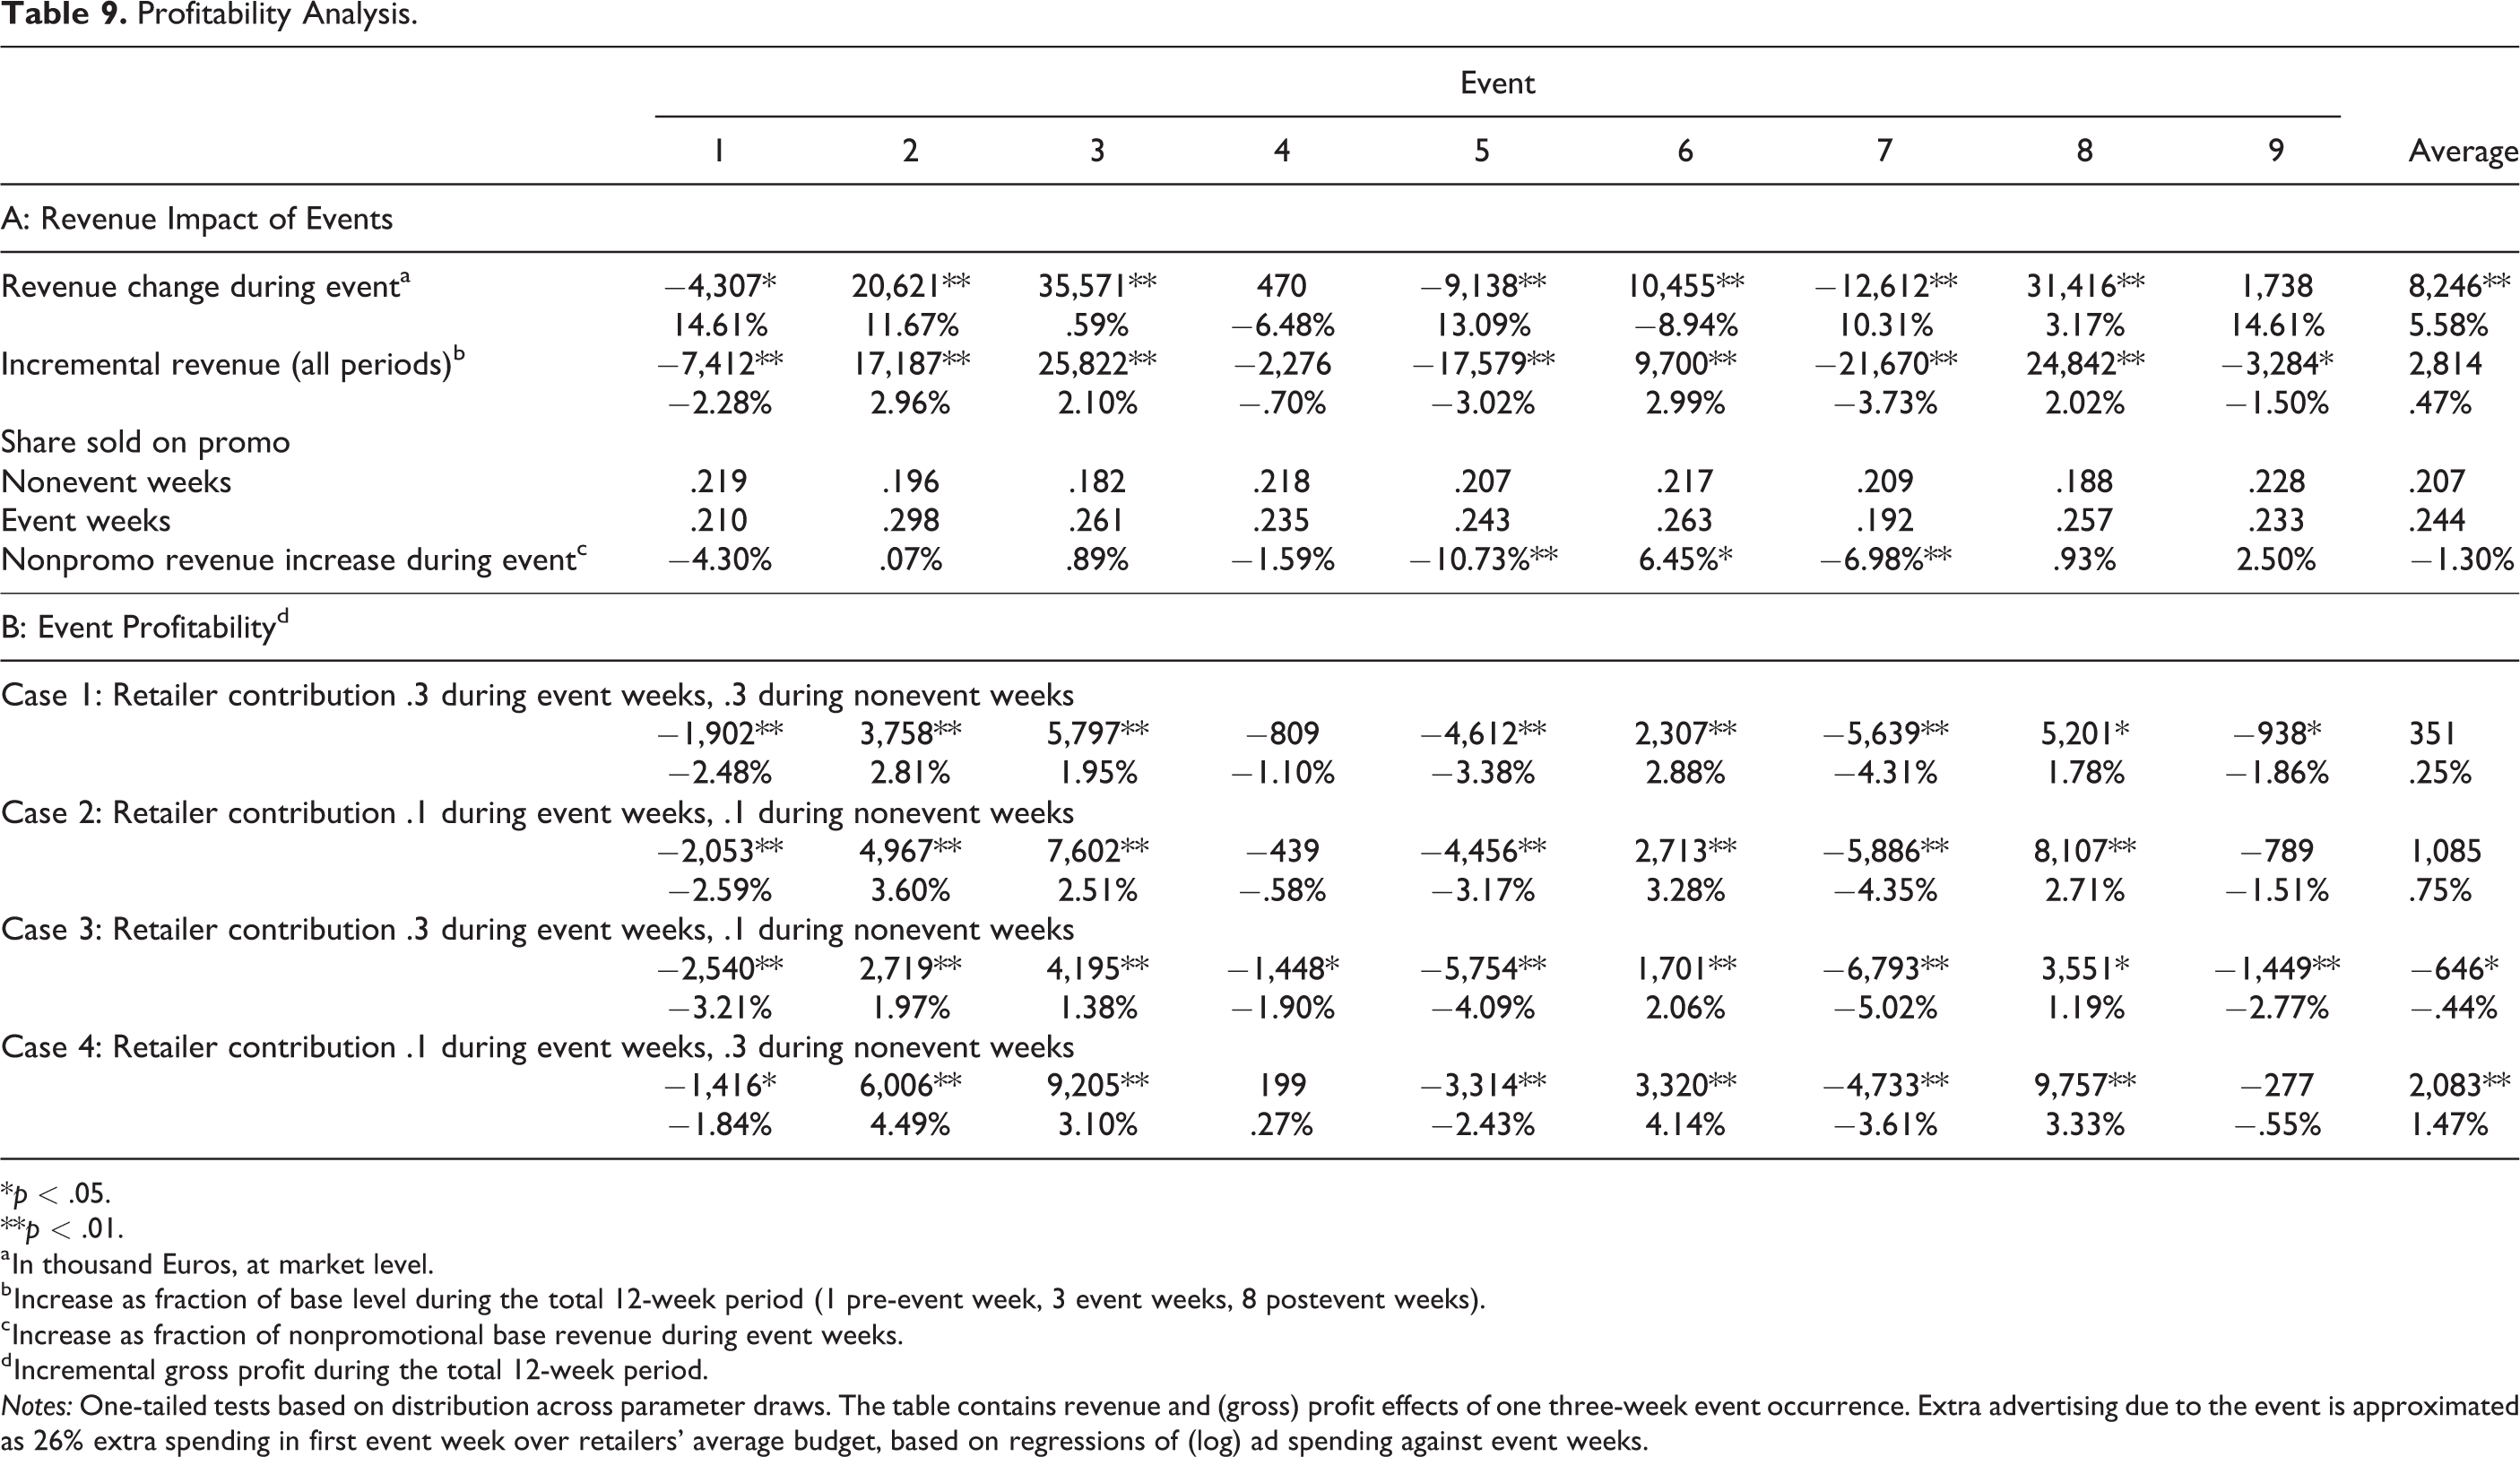
*p < .05.
**p < .01.
a In thousand Euros, at market level.
b Increase as fraction of base level during the total 12-week period (1 pre-event week, 3 event weeks, 8 postevent weeks).
c Increase as fraction of nonpromotional base revenue during event weeks.
d Incremental gross profit during the total 12-week period.
Notes: One-tailed tests based on distribution across parameter draws. The table contains revenue and (gross) profit effects of one three-week event occurrence. Extra advertising due to the event is approximated as 26% extra spending in first event week over retailers’ average budget, based on regressions of (log) ad spending against event weeks.
Again, however, profitability varies across events. Linking profit figures to event characteristics, we find that larger scope (.774, p < .05) and high resonance (.638, p < .10) (which were associated with stronger lifts during the event) also positively correlate to event profitability. “Uniform price” deal formats (which did worse in terms of immediate visit and purchase response) bring higher profits (correlation: .584, p < .10), possibly because their deals are less deep and they encourage consumers less to stock up on the product.
Implications and Directions for Future Research
Research Implications
Unlike business-as-usual retailer promotions—for which previous research revealed only weak evidence of direct store-switching—we find that ReTSS can substantially increase the number of shoppers drawn to a store. Even though basket size (conditional on a visit) typically does not change, this implies that shoppers buy more in total at the retailer during event weeks: 8.5% more on average, and up to 21% more for the more successful events.
In particular, households that rarely patronize the retailer absent the event and that spend a larger share of their grocery budget at hard discounters shop and buy more at the store during event weeks. This corroborates that, based on their characteristics, ReTSS enjoy higher awareness than business-as-usual discounts and bring higher perceived monetary and nonmonetary benefits that outweigh the hurdles of an (extra) store visit. It also underscores that ReTSS can indeed revitalize the retailer’s customer base. An intriguing observation, however, is that in some instances ReTSS (like our Event 1) reduce purchase volumes during event weeks. Because we observed and tested only shoppers’ behavioral responses, we can only speculate on the underlying reasons. If retailers mass advertise the event theme but the actual scope of the offer is too small, this may produce a reactance effect. Insights into consumers’ mindset metrics could further verify mechanisms underlying these effects.
Only a small part of the lift in visits and purchases stems from the (increase in) discounts/features and advertising budget during the events. Instead, the event as such leads to marked performance improvement. Consistent with findings on popular event advertising (Gijsenberg 2014; Keller, Deleersnyder, and Gedenk 2019; Naik, Raman, and Winer 2005), this confirms that unifying and communicating the deals under a common savings theme creates extra synergies. These synergies appear particularly strong for events with higher media resonance and that involve more items. Thus, not only do the deals or ad budget as such matter; what matters in particular is the thematic framing as a super saver event, which allows retailers to break away from the clutter and convince households that the gains are worthwhile. Future studies could pursue how retailers can craft and market savings themes for maximum buzz, as data on the virality of advertising is becoming more readily available.
From a broader perspective, our findings underscore the critical importance of promotion communication and framing. In reality, the actual number of promoted items during the ReTSS (and the potential for extra savings relative to nonevent weeks) remains limited, and much of the ReTSS success stems from the theme that makes consumers aware and generates the perception of large and frictionless savings. Yet previous studies have shown that consumers do learn from experience. If an event does not yield the hoped-for savings, consumers may not be attracted by it next time and may even develop a negative attitude toward the retailer. Thus, our finding that specific ReTSS events lose effect over time may result not only from theme wear-out but also from consumer disappointment with actual savings. Future studies could analyze how the interplay between anticipated and actual savings shapes consumers’ ReTSS response.
The impact of ReTSS extends beyond the event period. The higher awareness and perceived benefits make some consumers lie in wait and decelerate visits and purchases prior to the event. This holds even though retailers do not seem to mass advertise the event beforehand and likely stems from the fact that most ReTSS recur roughly around the same time(s) each year. The question remains how retailers can circumvent these negative lead effects without jeopardizing the success during the event period. Should retailers randomize the timing of their event to prevent current customers from postponing their visits? Or, conversely, should they mass advertise an upcoming event, such that rival-chain customers hold back on their purchases at competing stores and buy more with the retailer during the event? The answers will depend not only on the size and composition of the retailer’s current customer base but also on consumers’ (psychological) reaction to (not) being notified up front—an issue for further study.
The weeks following an event show a higher-than-usual number of visits but smaller basket sizes. Newly attracted customers are more likely to return to the store after the event, consistent with a store-salience and familiarization effect. However, consumers who bought at the chain during event weeks buy smaller quantities subsequently, possibly because they built up inventory or because the emphasis on smart shopping has reduced their willingness to purchase at full price. For the average event, the net result across periods is still an increase (albeit small: about 1% on average) in purchase volume. As for profitability, our back-of-the-envelope calculations suggest that unless the retailer bears the brunt of the extra discount depth, the ReTSS neither helps nor hurts the bottom line. In all, our results thus clearly show the immediate and medium-term outcomes of the events in terms of traffic, sales, and profit.
Retailers may have additional, longer-term, motives to establish these events, such as improving the store’s price image or fostering current customers’ loyalty. Moreover, in time, more (frequent) ReTSS actions may lead to a new type of promotion trap: retailers being caught up in a race for events that stand out. On the consumer side, more exposure to events may desensitize shoppers and dilute their interest in (and response to) specific events. As longer data series including more events become available, analysis of these long-term outcomes becomes a fruitful area for study.
Marketing Implications
Our results reveal that ReTSS can be an effective way for traditional retailers to (temporarily) regain customers and increase in-store purchases. Consumers who spend a higher share of their grocery budget at hard discounters are especially likely to increase their visits and purchases at the traditional chain in response to the event. Moreover, even if such events do not increase profits, they do not really hurt the bottom line, either. Thus, although not a panacea, ReTSS events can be a valuable defense tool, strengthening the retailers’ share of wallet among light customers and preventing them from permanently defecting to discount stores.
However, not all events succeed. Generating uplift in visits and purchase volumes calls for a sufficiently large event scope. Retailers should find the right balance between raising awareness and expectations and honoring promises by offering (deep) enough deals. As for format, whereas percentage-off discounts and BOGOs—which clearly emphasize the monetary advantage—appeal most strongly to consumers, ReTSS with uniform prices seem more profitable for the retailer. Although advertising matters, the key to success is not in increasing the advertising budget per se. Instead, the media resonance of the savings theme appears to be key. This is not surprising, given that most of the incremental gains come from nonregular customers who may be more responsive to sources other than the chain’s communication. Thus, apart from creating a unique and easy-to-recognize theme, retailers should strive for more earned rather than owned media impressions and focus on how to make the theme go viral. As a caveat, we also find evidence of wear-out, urging retailers to craft novel themes in time. Our retailer interviews suggest that turning the event theme into a brand of its own, and/or using market influencers to promote it, may prove fruitful here.
Our findings caution retailers to be wary of consumers lowering their purchase volumes prior to and after the event. In addition, deep discounting may hamper revenue and profitability. To guard against these dangers, retailers could try to capitalize on the exploration benefits of ReTSS, by judiciously steering consumers through the aisles in search of the ReTSS offers, and on the licensing effect, by displaying impulse items in indulgence categories next to the ReTSS deals. Finally, given that ReTSS weeks attract extra consumers (in particular, hard-discount shoppers), the events may be a unique way for national-brand manufacturers to increase volume or present consumers with their (new) brand offerings. Retailers could use these arguments to increase the promotion contribution of manufacturers during events, an essential ingredient of ReTSS profitability.
The effects of ReTSS may differ in countries with different retailer landscapes or business-as-usual promotion activity. Given our framework and findings, these events would be most instrumental for traditional chains severely threatened by hard discounters, in markets with substantial promotional clutter. While our focus was on grocery retailers, similar savings events emerge in nongrocery settings, such as Inno’s “Crazy Days,” Asda’s “Green Is the New Black” savings event, or Amazon’s “Prime Days” (recently extended to Whole Foods). And although some of our ReTSS effects (e.g., visit or purchase expansion) may hold in those settings as well, others (e.g., purchase acceleration and stockpiling) may not, or may emerge in a different time frame—aspects that we leave for future study.
Supplemental Material
Supplemental Material, jm.18.0319-File003 - Evaluating the Effectiveness of Retailer-Themed Super Saver Events
Supplemental Material, jm.18.0319-File003 for Evaluating the Effectiveness of Retailer-Themed Super Saver Events by Jonne Y. Guyt and Els Gijsbrechts in Journal of Marketing
Footnotes
Acknowledgments
The authors are indebted to AiMark for providing the data. They sincerely thank Marnik Dekimpe as well as the JM review team for their exceptionally constructive and helpful comments on previous versions of this manuscript.
Associate Editor
Kusum Ailawadi
Declaration of Conflicting Interests
The author(s) declared no potential conflicts of interest with respect to the research, authorship, and/or publication of this article.
Funding
The author(s) received no financial support for the research, authorship, and/or publication of this article.
Notes
References
Supplementary Material
Please find the following supplemental material available below.
For Open Access articles published under a Creative Commons License, all supplemental material carries the same license as the article it is associated with.
For non-Open Access articles published, all supplemental material carries a non-exclusive license, and permission requests for re-use of supplemental material or any part of supplemental material shall be sent directly to the copyright owner as specified in the copyright notice associated with the article.