
Abstract
We provide the first examination of the extent to which voters cast ballots for copartisan candidates in nonpartisan elections using cast vote record (CVR) data. These records permit direct observation of whether demonstrably partisan voters vote for copartisan candidates at the same rate in partisan and nonpartisan local elections. We find that voters classified as partisan based on their vote choices in federal/state elections cast ballots for candidates—whose partisanship we ascertain based on their primary election voting records—from the opposing party at higher rates in nonpartisan compared to partisan elections. We also find that partisan voters appear to respond to the race and gender of the candidates, but those heuristics do not always line up in the predicted partisan manner for voters. These results suggest that many voters cast ballots in nonpartisan elections that they may not have otherwise with more complete partisan information about the candidates.
Introduction
In the typical election in the United States, voters are faced with many decisions. Not only must they decide how to vote in the partisan federal and state elections that typically occupy the top of their ballot, but they must also navigate down-ballot races for myriad offices such as judges, county commissioners, school board members, or town councilors. Many of these offices are nonpartisan, which means that voters will not see a partisan affiliation on the ballot for candidates who are seeking them. In partisan elections, voters typically rely on their partisan attachments to select a candidate (Achen and Bartels 2017; Campbell et al. 1960; Green et al. 2002). However, it is unclear whether voters can consistently choose the candidate that best aligns with their partisan and/or ideological preferences in nonpartisan elections.
In removing party labels, nonpartisan elections raise information costs for voters. If they lack sufficient information to decide between several nonpartisan candidates, some voters may determine that it is best to delegate the decision to others, abstaining in that contest (Feddersen and Pesendorfer 1996; Wattenberg et al. 2000). Others may make a less-than-informed decision, risking the choice of a candidate who is least reflective of their values. Either of these outcomes is sub-optimal from a democratic standpoint, as well-functioning representative government should reflect the informed will of the electorate. Thus, it is crucial to understand whether voters are consistently capable of choosing the candidate in nonpartisan elections who most closely represents their own views.
The extant scholarship on voting in both nonpartisan and partisan elections provides valuable insight into voter behavior in these contests. This said, much of this work relies on aggregate-level election returns (e.g., Lim and Snyder 2015; Lucas 2022; Schaffner et al. 2001; Weinschenk 2022), which can suffer from problems of ecological inference. Alternatively, researchers may observe individual-level behavior with surveys and self-reports (e.g., Badas and Stauffer 2019) and embedded experiments (e.g., Badas and Stauffer 2019; Bonneau and Cann 2015; Kirkland and Coppock 2018; Squire and Smith 1988). However, these approaches invite external validity concerns as it is difficult to mimic the conditions of “real world” voting in low-information elections. However, to date, these approaches have been necessary, given that researchers cannot accompany voters to the polls and observe how they complete their ballot. We employ records from the 2018 election in South Carolina that allow us to do just that.
As part of its election audit procedures, South Carolina makes public a record of every (anonymous) voter’s preferences on each cast ballot, providing the entire population of individual-level preferences in each electoral contest. We employ these cast vote records (CVRs) to examine how partisan voters (as determined by their vote choices in the partisan part of their ballot) vote in nonpartisan elections, specifically examining whether their selections tend to be in line with their underlying partisan preferences. Using these data—coupled with information from the South Carolina voter file—we make three primary contributions, one of which is methodological and two of which are substantive.
Methodologically, we develop a measure of the partisanship of nonpartisan candidates based on their voting history in primary elections. This measure appears to have high validity, as the same measure employed for partisan candidates is correlated at 0.91 with their actual (stated) partisanship. Identifying the partisanship of candidates in nonpartisan elections in this way permits us to assess the extent to which partisan voters still vote for copartisan candidates when party labels are not available.
Substantively, we find that partisan voters cast ballots for candidates from the opposing party (i.e., cast a “crossover vote”) at higher rates in nonpartisan compared to partisan elections. This is the case even when comparing elections for the same office that happen to be conducted in a partisan or nonpartisan manner depending on the county within South Carolina. For example, in contested partisan county council races the crossover voting rate is roughly 5%, but in contested nonpartisan county council races it is roughly 35%. We interpret this as evidence that though partisan voters have clear incentives to locate copartisan candidates, the lack of a party label on the ballot fosters greater uncertainty about which candidate to choose. In turn, this leads to voters casting votes for candidates that (we presume) they would not support with more complete information.
In addition, we find evidence that partisan voters attempt to use available heuristics—such as candidate gender and race—as a stand-in for partisanship in nonpartisan elections, but are not always successful in doing so. When typical heuristics are “incorrect” we observe more crossover voting; for instance, when a Democratic male runs against a Republican female, Democrats are more likely to vote for the Republican. Our regression models also indicate that, irrespective of a candidate’s actual partisanship, Democrats vote for nonpartisan Black candidates at higher rates, while Republicans tend to vote against nonpartisan Black candidates.
In short, our results are cause for concern about voters’ ability to choose an ideologically proximate candidate in nonpartisan races. In an ideal world, voters would learn about the particular stances of each candidate on their ballot and cast their vote for the person who would best represent them. Instead, voters seem to heavily rely on partisan affiliation to signal the candidate whom they ought to support. When that signal is absent, we find evidence consistent with the conclusion that many voters guess.
Party, Heuristics, and Crossover Voting
The question of whether and under what conditions voters cast ballots for the candidates that best match their own interests is of longstanding interest. Lau and Redlawsk (1997) refer to voters’ ability to make choices that align with their own values as “voting correctly.” A great deal of subsequent scholarship focuses on characteristics of voters that are associated with their capacity to vote correctly, including gender (Dassonneville et al. 2020), cognitive capacity and political motivation (Lau et al. 2008), and involvement in social networks (Ryan 2011; Sokhey and McClurg 2012). Other studies examine system-level factors that make correct voting more or less likely, such as the magnitude of districts (Blais et al., 2016), the polarization between the choices in an election (Pierce and Lau 2019), and the availability of informational heuristics (Lau et al. 2008; Heit and Nicholson 2016; see also Lupia (1994) and Bartels (1996) and subsequent work on heuristics and “informed” voting).
While we are agnostic as to the actions that entail “correct” voting, an important assumption underpinning our analysis is that political parties typically help voters locate candidates whose views more closely match their own. 1 Knowledge of a candidate’s party affiliation is a powerful heuristic, allowing voters to choose a candidate with a reasonable level of comfort that they are making a sound decision—even if they have little other information about the candidates in a given election (Achen and Bartels 2017; Campbell et al. 1960; Green et al. 2002). With the rise of nationalized politics in the past several decades, voters have become even more reliably partisan in their voting behavior; for instance, since the 1990s, the correlation between voting in presidential and gubernatorial elections has steadily increased (Hopkins 2018).
Put another way, as American politics has nationalized, partisan voters appear to have become much less likely to vote for a candidate of the other party (an action we refer to as a “crossover vote”), which implies that party is providing an increasingly uniform, strong signal about which candidates to support—at least in high-profile races (e.g., Hopkins 2018). Some prior work has found relatively higher instances of ticket splitting (and therefore crossover voting) in local partisan elections (Kuriwaki 2025), but for the most part, party appears to be the most important piece of information that voters use to make a decision. In partisan elections, we should therefore observe reliably low rates of crossover voting.
The manner in which voters choose between candidates is necessarily different in nonpartisan elections, which trace their roots to the wave of Progressive election reforms in the early twentieth Century. Abolishing party labels was seen as a move toward better government in both judicial and municipal elections, with the belief that judges should be impartial and local government should be concerned with mundane tasks—such as filling potholes—that were not naturally congruous with partisan platforms (Adrian 1952). It was thought that eliminating party affiliations among candidates for these offices would encourage voters to select the best person for the job, rather than merely supporting politicians from their party regardless of their talents.
Previous work has found that voters look to traits such as experience to guide their decisions in nonpartisan elections (Atkeson and Hamel 2020; Kirkland and Coppock 2018; Lim and Snyder 2015; Schaffner et al. 2001). It is however still an open question whether voters are able to consistently locate ideologically congruent candidates in the extremely low-information environment of a local election. To be clear, we assume that partisan voters’ utility function in nonpartisan elections is much the same as in partisan ones: All else equal, these voters prefer to select candidates whose views are most closely aligned to their preferred party and would prefer to avoid casting a crossover vote most of the time.
Nonpartisan elections place a substantial obstacle to this goal. Political scientists have long noted that voters are often inconsistent in their preferences, are uninterested in politics, and display low levels of political knowledge on average (Converse 1964; Delli Carpini and Keeter 1996). Coupled with the increasing focus among the general public on national politics (Hopkins 2018), it stands to reason that absent a party signal, voters might struggle to make the “correct” decision in low-information elections (Pomper 1966), and may therefore be especially likely to cast an erroneous crossover vote.
Parties, candidates, and voters all have clear incentives to avoid this outcome; as such, nonpartisan elections are not wholly devoid of partisan messaging. Nonpartisan candidates may send signals about their ideological positioning in hope that voters recognize that they are the “liberal” or “conservative” candidate in the race (Holman and Lay 2021). Alternatively, the parties themselves might have strategic objectives that incentivize their involvement in nonpartisan elections (Adrian 1959). For instance, parties may make it known through any number of channels which candidates they prefer, and outside groups can amplify this message with the goal of helping voters to avoid unintended crossover voting.
Such a campaign could prove effective. Prior work relying on survey or experimental evidence has found that when provided signals, voters are able to discern candidate ideology and/or partisanship in nonpartisan elections, ultimately evaluating candidates in a manner similar to how they approach decisions in partisan contests (Bonneau and Cann 2015; Heit and Nicholson 2016; Holman and Lay 2021). Indeed, providing even the slightest partisan signal about a candidate—such as which governor appointed a judge running in a retention election—can turn an ostensibly nonpartisan choice into one that is consistent with a voter’s party preference (Squire and Smith 1988). In short, existing work shows that voters apply partisan thinking to nonpartisan elections when they perceive partisan or policy signals, and are able to avoid casting unintended crossover votes.
In order for these signals to be effective however, voters must receive them. Relative to nonpartisan candidates looking to signal their party affiliation in comparatively more visible races—such as mayoral or state judicial races—those for positions such as school board or county commission likely face greater challenges. These elections are relatively low-budget affairs, and voters may not believe that elections to these offices are particularly salient. In these elections, voters may face more difficulty in distinguishing between the candidates (Holman and Lay 2021), which likely contributes in part to substantially lower turnout in nonpartisan elections (Schaffner et al. 2001). Even when nonpartisan races are held concurrent with high-profile ones—such as a school board race held in the November general elections—voters may feel they lack information requisite to make an informed choice, and might therefore skip voting in the low-information election even though they have already turned out to vote (Feddersen and Pesendorfer 1996; Wattenberg et al. 2000).
Assuming that they do want to locate the most proximate candidate, voters who do not abstain face relatively high costs of voting when they cannot turn to party labels on the ballot. Unless they have made efforts to learn about nonpartisan candidates ahead of time, which imparts a pre-election cost, voters may attempt to make an educated guess about nonpartisan candidates using heuristics other than their party affiliation, thereby raising the possibility of casting an unintentional crossover vote. Prior work has found that absent party cues, candidate traits such as gender or race can guide voters’ decisions. For instance, Badas and Stauffer (2019) find that while party dominates voters’ decision-making when it appears on the ballot, in its absence voters show affinity for women candidates. Crowder-Meyer et al. (2020a) also find evidence of a gender affinity effect where candidate party is constant or unknown, and also that voters penalize candidates they judge to be racial minorities.
These findings are broadly consistent with other existing research finding that candidate race and gender can influence voters’ willingness to support candidates (e.g., Bauer 2015; Crowder-Meyer et al. 2020b; Doherty et al. 2022; Dolan 2004, 2014; Kam and Kinder 2012; McConnaughy et al. 2010; Mcdermott 1998; Philpot and Walton Jr 2007; Sigelman et al. 1995). For voters in nonpartisan races, these traits can function as a direct heuristic if the voter has a preference for or against electing a woman or minority candidate (Philpot and Walton Jr 2007), but voters might also use their understanding of a candidate’s gender or race to infer their ideological position as well. For example, existing research finds that voters judge women, Black, and Hispanic candidates as more liberal than they actually are (e.g., Mcdermott 1998). Voters may therefore infer candidate race and gender from their names (e.g., Butler and Homola 2017; Elder and Hayes 2023) and then use that information to make an educated guess about which candidate is closest to their preference, even if doing so means that they might cast a vote for a candidate that they would not prefer with more complete information.
Our expectations regarding the propensity of voters to cast crossover votes are therefore straightforward. First, relative to their choices in county or local partisan races, voters will demonstrate a significantly higher likelihood of casting a crossover vote in nonpartisan elections (because candidate party is not available on the ballot). Indeed, in the absence of other information to help them locate copartisan candidates in nonpartisan elections, it is conceivable that many voters may simply guess. Second, even with no prior knowledge of the candidates in a low-information election, voters may be able to discern candidates’ gender and/or race from their names. We therefore anticipate that voters will employ candidate gender and race heuristics in an attempt to reduce the chances of casting a crossover vote in nonpartisan elections. Specifically, we expect that voters will infer that Black and women candidates are more liberal, and will vote (conditional on the voter’s partisanship) accordingly. We note, however, that these assumptions may not always be correct.
Assessing whether these expectations are borne out requires us to observe voting behavior in a real election while identifying the partisanship of both voters and nonpartisan candidates, as well as candidates’ race and gender. In the next section, we describe our strategy for doing so.
Data and Measurement
For elections between 2005 and 2019, all jurisdictions in South Carolina employed Election System and Software’s iVotronic voting machines, which captured voter selections via either paper or electronic ballots.26 The state’s post-election audit process required the preservation of a number of records from these machines, including all individual-level CVRs. The CVRs do not capture identifying information about the voter, but they do reveal all votes cast on each voter’s ballot so that we can see for whom each individual voted in every contest. This allows us critical insight into voters’ decision-making over the entirety of their ballot in real elections. We focus on the 2018 general election in South Carolina, as this permits us the fullest history to assess the partisanship of the candidates. 2 Our central aim is to assess the extent to which partisan voters cast crossover votes in partisan and, especially, nonpartisan elections in which Democratic and Republican candidates ran.
Example Coding for Measuring Voter Partisanship.
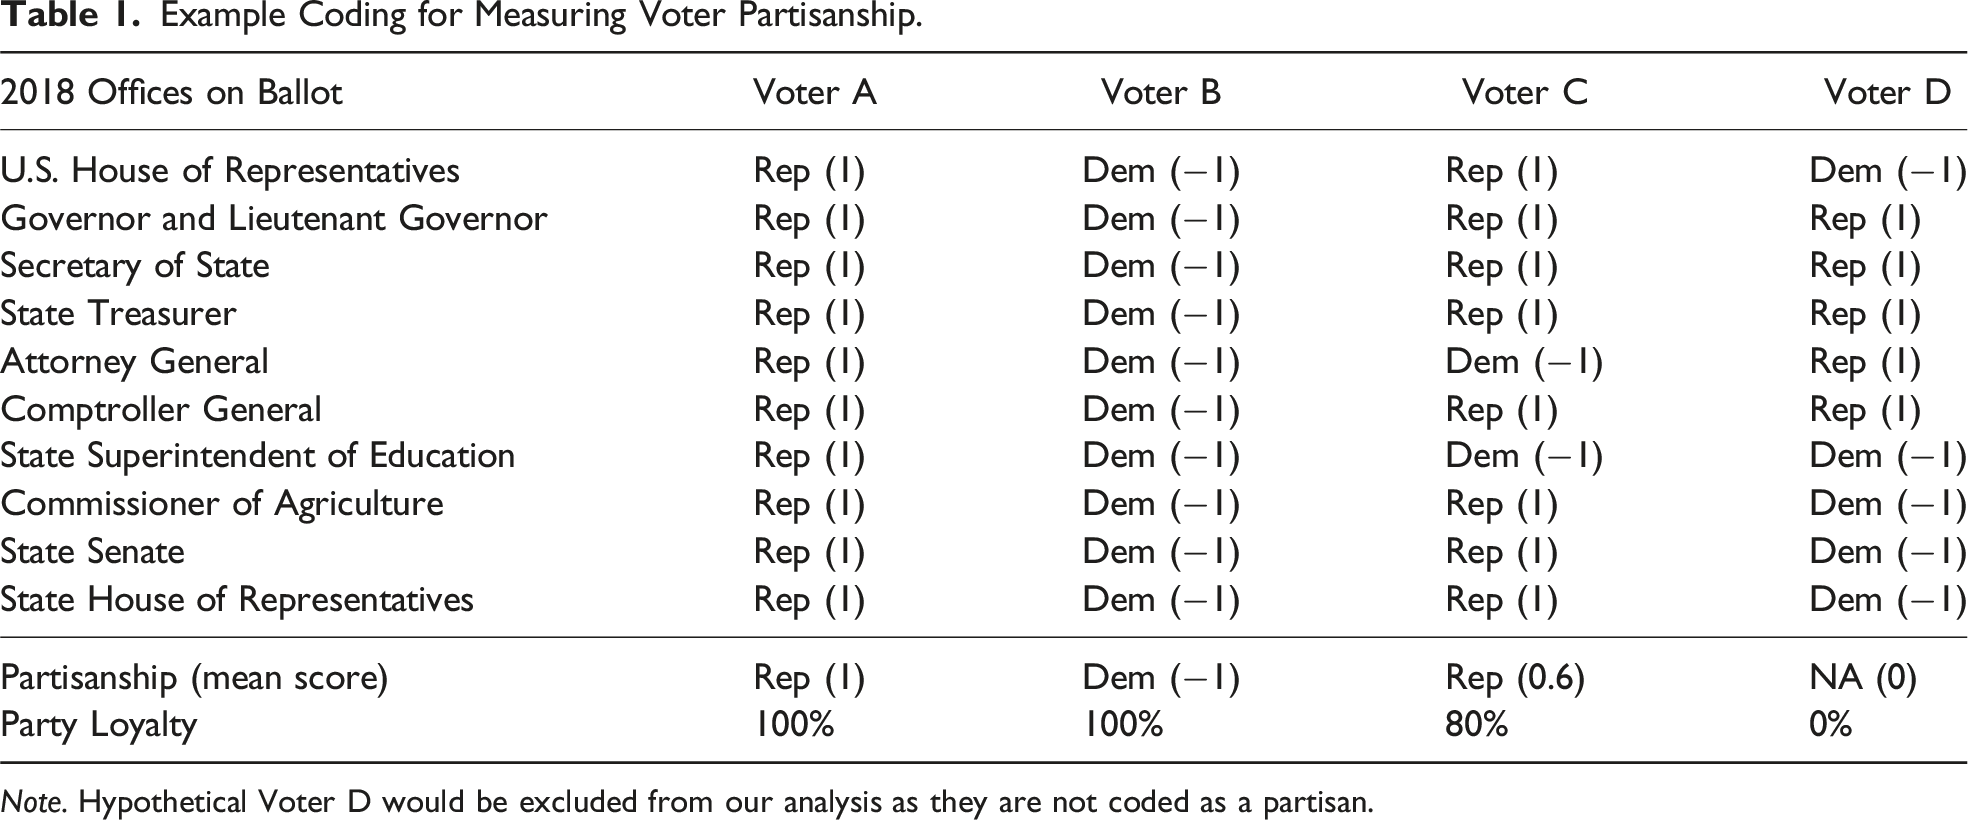
Note. Hypothetical Voter D would be excluded from our analysis as they are not coded as a partisan.
Our second challenge is to determine the partisanship of candidates running in nonpartisan elections in county or municipal elections. We do so by merging the roster of the 833 nonpartisan candidates who ran in 2018 with the South Carolina voter file, provided by L2 Political. All candidates provide their full name and a current address to the state when they file paperwork to run. We use this information to locate candidates in the 2017/2018 South Carolina voter file, and successfully matched all but 12 nonpartisan candidates. 5
South Carolina does not require voters to declare a partisan affiliation, so the voter file does not provide a direct indicator of partisanship. 6 To discern candidates’ party affiliation, we instead rely on their voting behavior in prior primary elections. During South Carolina primaries, voters are free to decide in which primary they wish to participate, so long as they vote in only one. The South Carolina voter file for a given year includes a binary indicator of whether a voter participated in the preceding cycle’s Democratic or Republican primary. It also contains a unique voter identification number for each registered voter in the state. Thus, once we match candidates to the 2017/2018 voter file, we can determine if they voted in the 2016 Democratic or Republican primaries. Using candidates’ voter registration number, we then merge historical voter files with even-year primary voting history back to 1998. 7 As the most recent election for which CVR data are available, the choice of 2018 therefore allows us the longest possible period from which to determine nonpartisan candidates’ party preferences; this process reveals a primary voting history that ranges between zero and 10 elections, depending on when candidates registered to vote in South Carolina.
We assign each candidate a partisan score using a similar process to the one we use for calculating a voter’s partisan score: For each election cycle in which they were registered, we assign a score of 1 if candidates voted in a Republican primary, −1 if they voted in a Democratic primary, and 0 if they were registered but voted in neither party’s primary. 8 We then take the average of these scores, yielding a partisan score for each nonpartisan candidate. As we did with voters, we designate nonpartisan candidates as Republicans if this score is positive, and as Democrats if negative. We retain the percentage of party primaries (of the same party) the candidate voted in as a measure of their “party loyalty,” which is directly analogous to the same metric calculated for voters. In Figure A2, we show that the distribution of candidate loyalty scores is generally similar for partisan and nonpartisan candidates.
While our primary focus is on voting behavior in nonpartisan elections, we also retain votes in sub-state partisan races as a basis of comparison, and merge partisan candidates to the voter file in the same manner as nonpartisan ones. 9 Since partisan candidates declare their affiliation, we do not need to rely on an estimate of their partisanship using their previous primary voting. However, merging partisan candidates to the voter file allows us to recover their gender, race, and party loyalty scores in the same way as nonpartisan candidates. It also allows us to correlate their declared party affiliation with our estimate of their partisanship—providing a validation of the key measure employed in our analysis of nonpartisan elections. For partisan candidates, the correlation between declared party affiliation and our measure of their partisanship is 0.91, which provides a great deal of confidence in our estimate of nonpartisan candidates’ partisanship.
The unit of analysis for most of our analyses is the voter-contest. We retain all votes cast in elections for offices below the State House (as elections for State House and above are used in our measures of voter partisanship and party loyalty; in that way, we do not use the same votes to both measure partisanship and predict partisan voting patterns). These races are for county or local offices; as such we refer to these races as “sub-state” elections. In total, our sub-state, vote-level data include nearly 3.8 million votes cast by partisan voters in the 2018 South Carolina election for county and municipal offices. Of these, more than 750,000 votes were cast in contested partisan elections, and more than 210,000 were cast in nonpartisan elections contested by at least one Democratic and one Republican candidate. 10 These votes drive most of the analysis presented below. 11
Descriptive Analysis
We begin with a descriptive analysis of the conditions in which voters make decisions in sub-state elections. For this analysis, we must account for whether the elections were “contested” because voters cannot cast a crossover vote if all candidates on the ballot are members of their party. We define partisan elections as contested if both a Republican and Democrat are on the general election ballot. Our preliminary analysis indicates that most sub-state elections are not contested by both Democrats and Republicans, and therefore offer no chance for some voters to cast crossover votes. For instance, of the 297 sub-state partisan elections in 2018, only 35 were contested by candidates from both major parties. Still, more than 750,000 votes were cast in these 35 elections.
For the 235 nonpartisan elections in 2018, we examine crossover voting in a range of contestedness scenarios. For instance, we restrict analysis to nonpartisan races contested by exactly one Democratic and Republican candidate, which provides the most direct analogue to contested partisan elections. This was the case in 14 nonpartisan elections, all but one of which were board of education elections (the other was a mayoral race). More than 70,000 votes were cast in these elections. Finally, we also observe crossover voting in races contested by at least one Democratic and one Republican candidate. 12 Using this more expansive definition of contestedness, we observe about 211,000 votes cast in 29 races. Here again, the majority are board of education contests, but there are also votes cast in county and town council races, in addition to the mayoral race. Descriptive statistics for votes cast in party-contested elections (employing these definitions) are displayed in Table A1. 13
How Often Do Voters Cross Over?
Figure 1 depicts the rate of crossover voting in elections for a range of county and municipal offices. The rates for partisan elections are shown in the upper pane of Figure 1, and for nonpartisan elections in the lower pane. We calculate these rates separately for elections to each office overall and across various states of contestedness. Figure 1 reveals several important patterns. Percent of crossover votes cast by partisan voters in sub-state partisan and nonpartisan elections, by office and contestedness.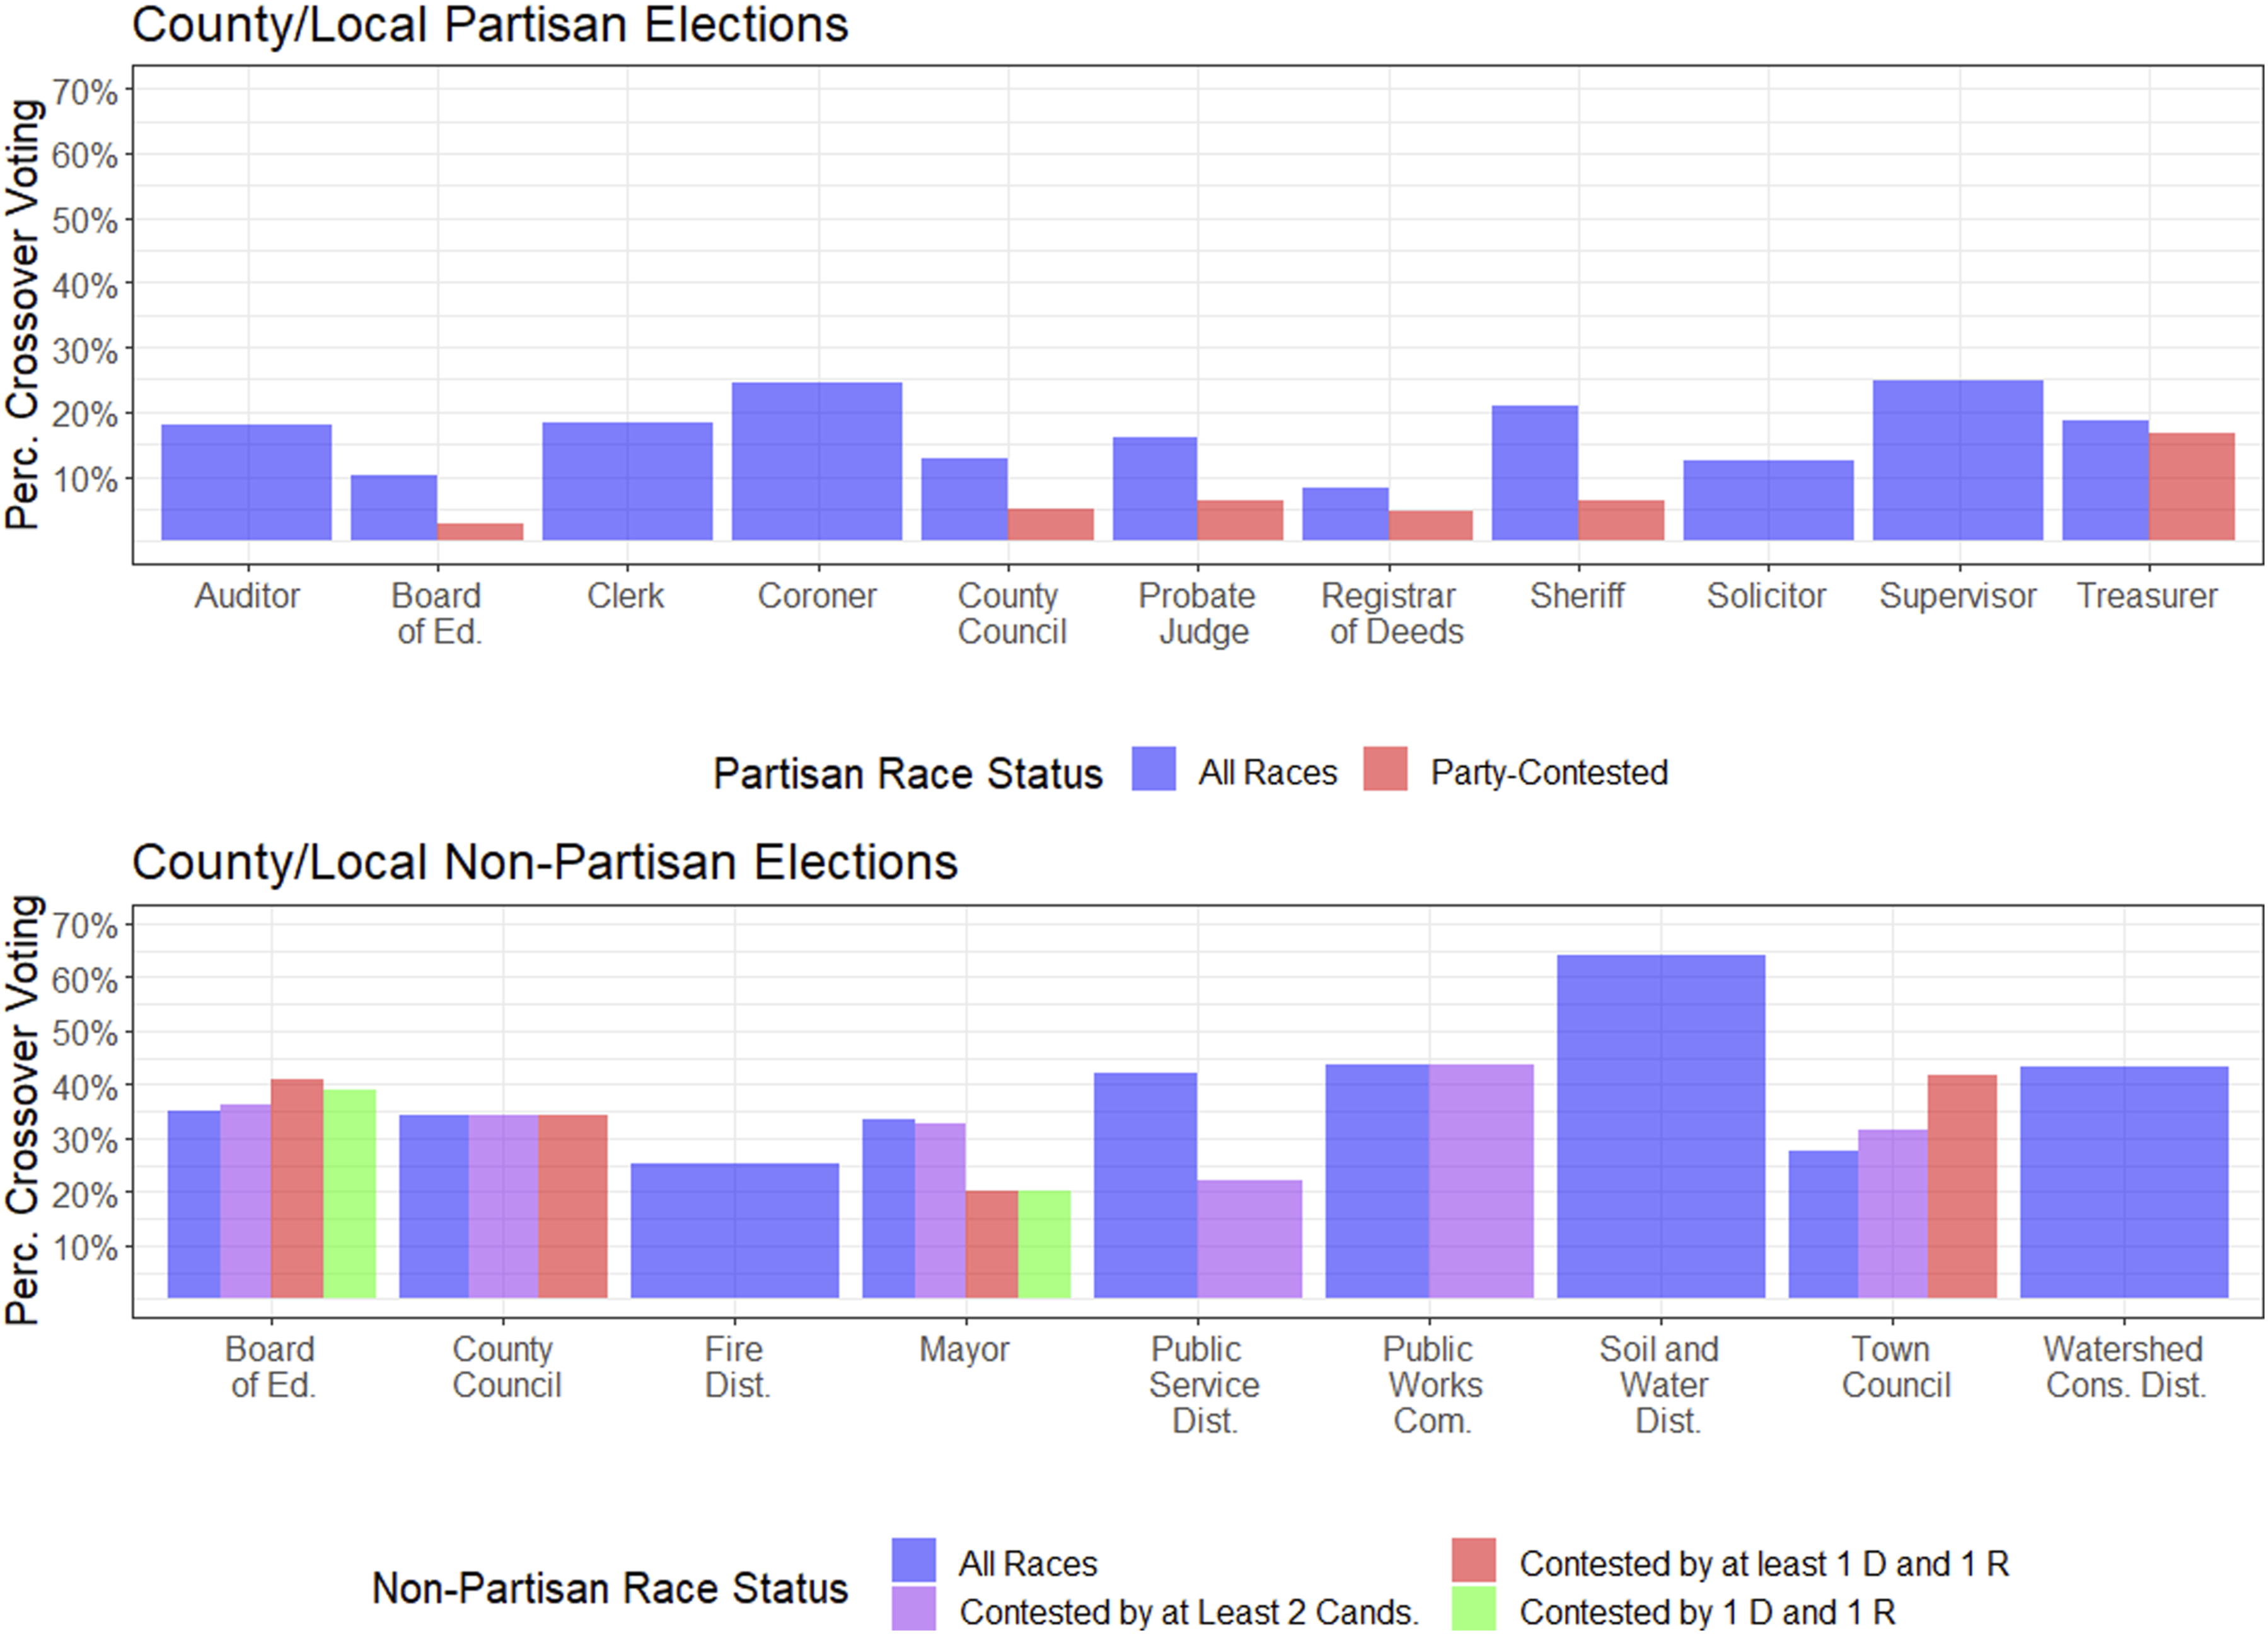
First, we generally observe much higher rates of crossover voting in nonpartisan elections compared to partisan ones. Overall, partisans voted for an opposite-party candidate in 15.6% of sub-state partisan elections, a rate more than 20% points lower than in nonpartisan contests. Moreover, we observe that crossover voting is typically even lower when partisan elections are contested; the rate falls to 5.6% when that is the case. Indeed, as Figure 1 shows, crossover voting declines in contested elections relative to uncontested ones for all sub-state partisan offices. The relatively low rates of crossover voting in partisan elections overall—and even lower rates in contested partisan elections, when all partisan voters could theoretically cross over—speak to the importance of candidates’ party affiliation to voter decision-making.
In the lower pane of Figure 1, we observe significantly higher rates of out-party voting. For instance, crossover voting in contested partisan elections was around 5% for five of the six offices for which we have data (and never exceeds 20%). In contrast, when looking at nonpartisan races where one Democrat and one Republican candidate ran (green bars)—which provides a fairly direct comparison to the dynamics of a contested partisan election—crossover voting exceeds 20% in both board of education and mayoral elections. Relaxing the definition of “party-contested” to races with at least one Democrat and one Republican (red bars) does not alter this pattern, as we observe crossover rates above 20% in elections to all four offices for which we have data. It is also worth noting that in contrast to partisan elections, crossover voting does not reliably decline when voters have a choice between a Democrat and a Republican in nonpartisan races; voters are at least as likely to vote for the out-party candidate when they have a partisan choice, relative to when they do not. The single exception to this rule is the one mayoral race in our data—the race in which, presumably, it would have been easiest for candidates to signal their partisanship and platforms to voters through the local media and other channels.
That crossover voting increases in party-contested nonpartisan races is consistent with the expectation that many voters find it more difficult to locate the most proximate candidate (based on partisanship) when they do not have a partisan ballot cue to aid them. Indeed, the most direct comparison between partisan and nonpartisan elections we can make is for county council and board of education elections. In contested partisan county council races (in the top pane of Figure 1), we observe a crossover voting rate of about 5%. This is one-seventh the rate at which partisans vote for candidates of the opposite party in nonpartisan county council races where they have a choice between a Democratic and Republican candidate (in the bottom pane of Figure 1). We observe an even greater disparity in board of education elections. There, party-contested nonpartisan elections have a crossover voting rate of roughly 40%, whereas their partisan counterparts have a crossover voting rate under 5%.
In total then, Figure 1 provides evidence not only that party cues substantially reduce the probability that a voter casts a vote for their non-preferred party in a low-information election, but also that in the absence of these cues a substantial proportion of voters (more than one-third on average) cast votes they may not have with more complete information about the candidate partisanship. Of course, it remains possible that these crossover votes reflect “correct” voting—that the removal of partisan labels removes a polarizing piece of information and frees voters to select the candidate that best represents them, regardless of their partisan affiliation. In the next sections, we present evidence that this is an overly optimistic interpretation of the patterns observed in Figure 1.
Competitive Dynamics in Nonpartisan Elections
We next examine how the “partisan” dynamics of a given nonpartisan race shape crossover voting. As the number of candidates in a nonpartisan race increases, it may be more difficult for voters to locate the candidate who is closest to their true preference. We investigate this possibility in Figure 2, which depicts crossover rates separately for Democratic and Republican voters in three nonpartisan election scenarios: (1) When two of their copartisan candidates are running against one out-party candidate, (2) when one copartisan runs against two out-party candidates, and (3) when one copartisan runs against one out-partisan candidate. The center bar pairing shows that when exactly one Democrat challenges exactly one Republican, crossover rates are similar for voters from the two parties—40% for Democrats and 35% for Republicans. Percent of crossover votes cast by partisan voters in sub-state nonpartisan elections, by number of candidates.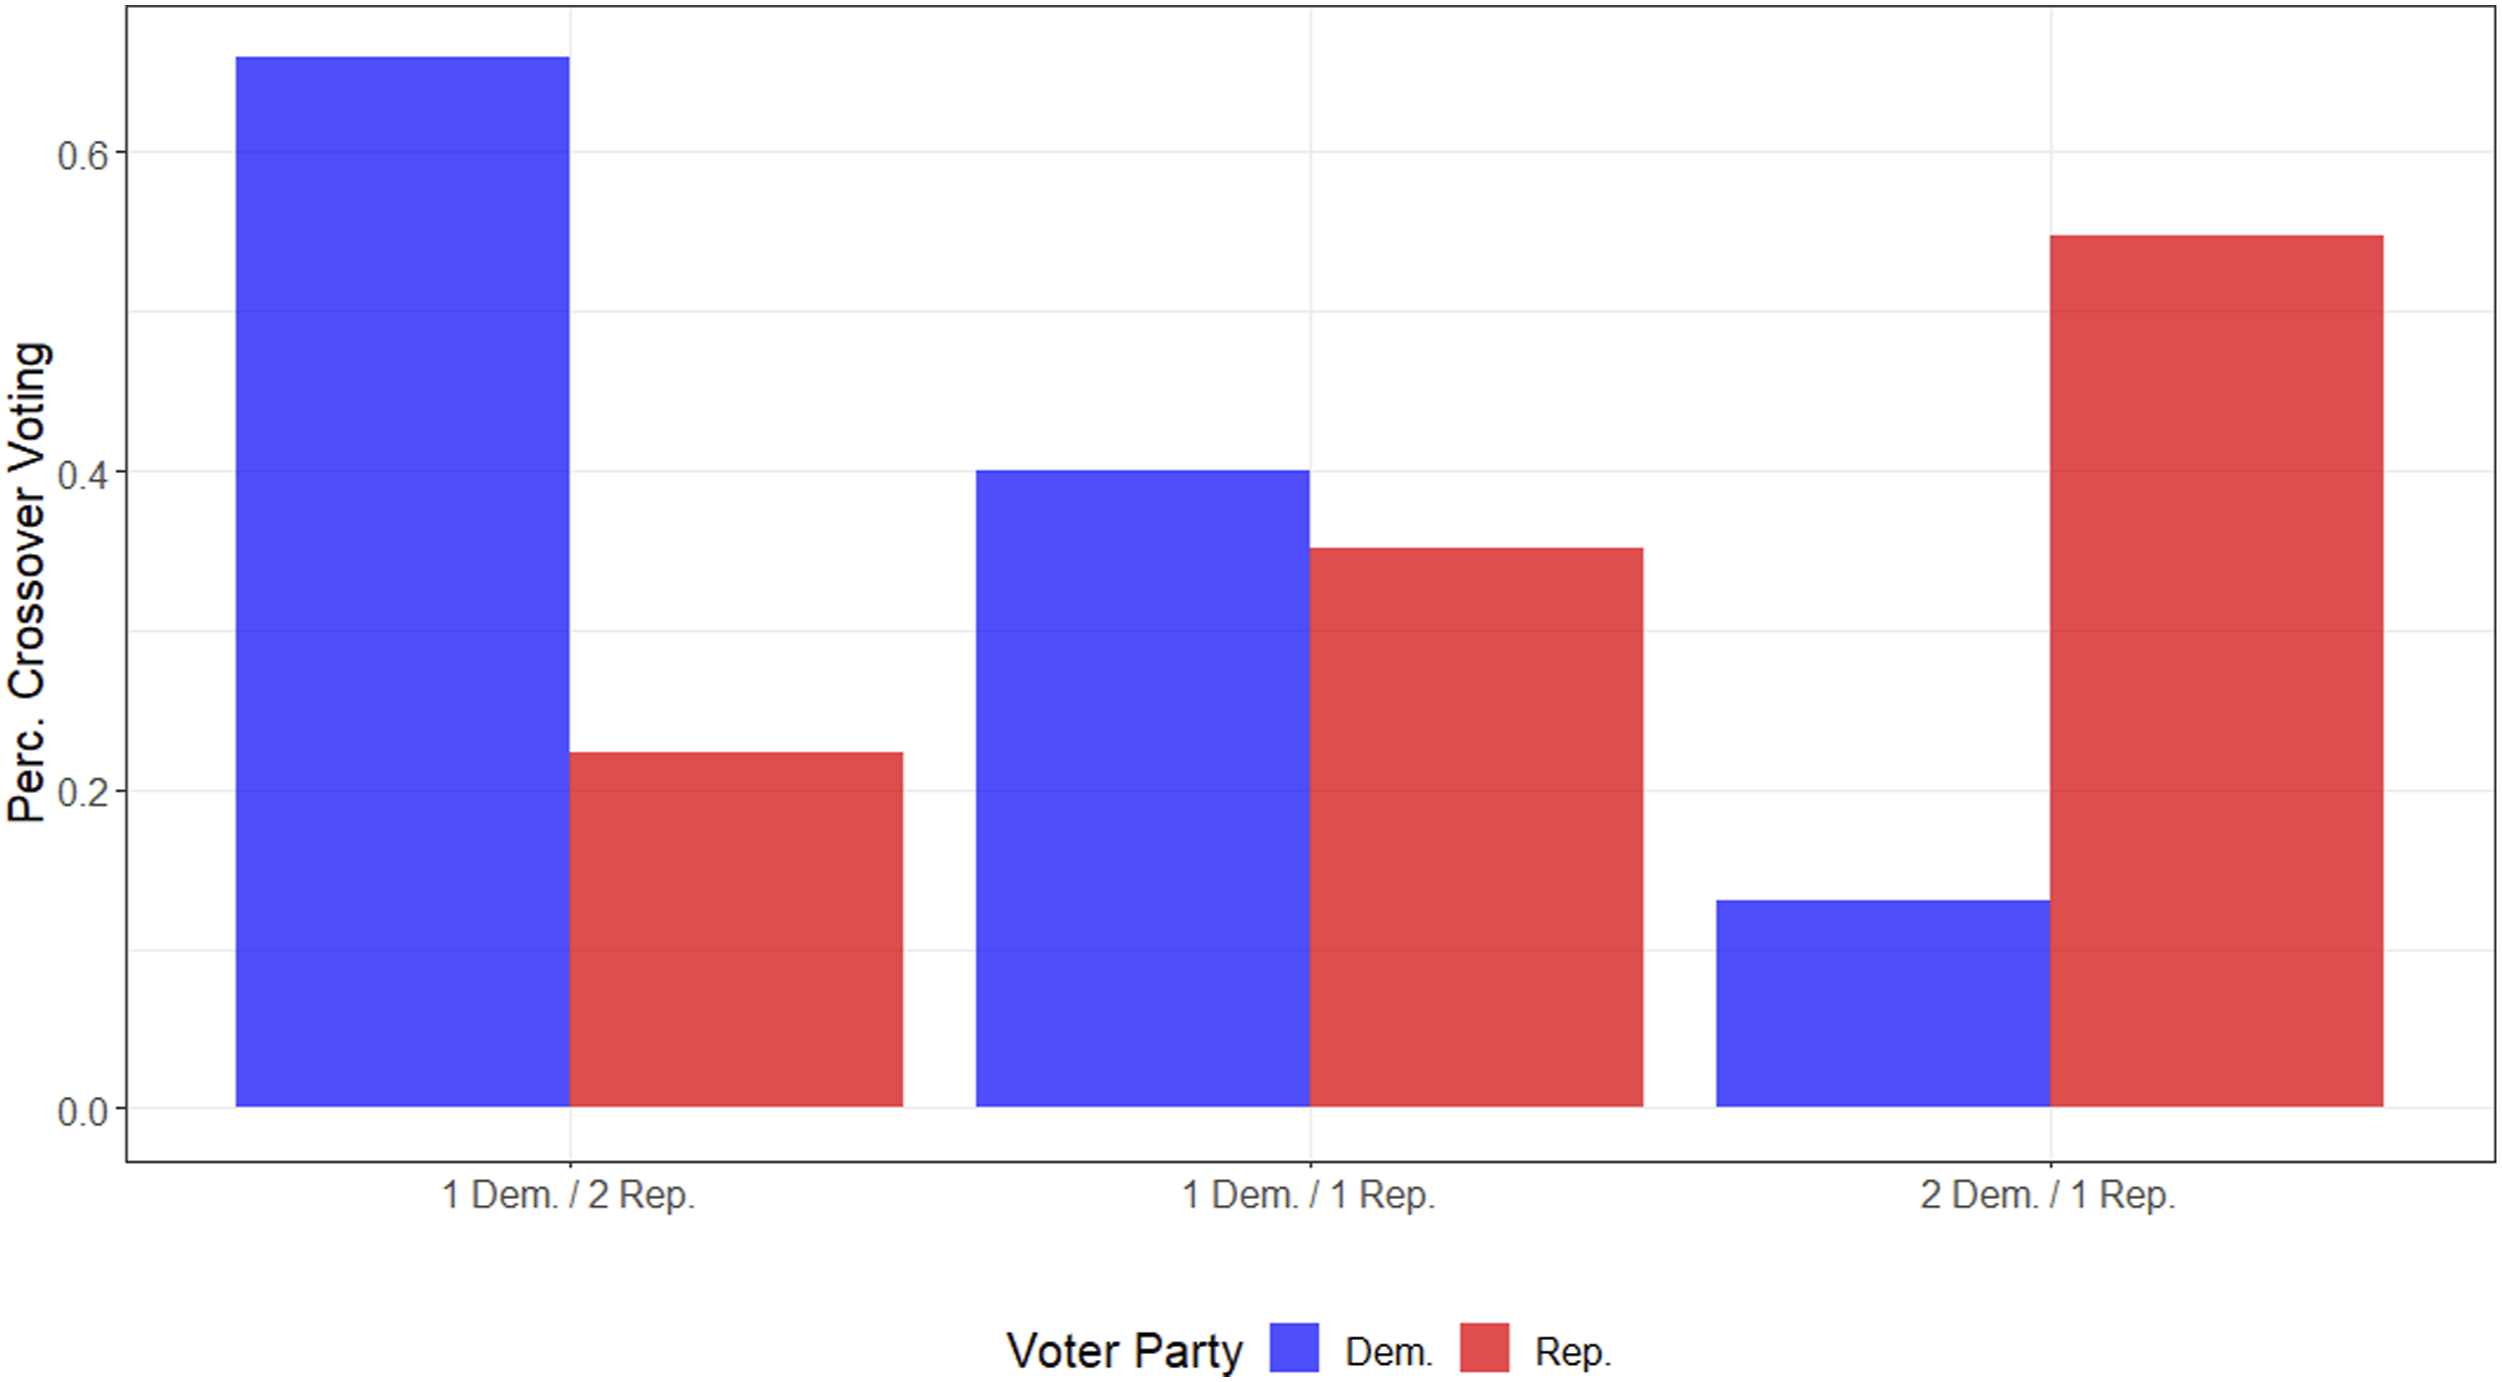
If voters are identifying copartisan candidates in nonpartisan elections, crossover voting rates should not be conditional on the number of copartisan or out-partisan candidates running. For instance, if a Democratic voter must choose from a group that includes one Democrat and two Republicans, all else equal we would expect them to select the Democrat. This is not what we observe in Figure 2, however. In the bar pairing at left, the crossover voting rate for Democratic voters in such elections is 66%; for Republican voters it is slightly higher than 20%. We observe a similar pattern in the rightmost bar pairing: When two Democrats run, Republican voters choose a Democratic candidate more than half the time, while Democrats’ likelihood of selecting a Republican is just over 10%.
The results presented in Figure 2 therefore suggest that even one additional out-party candidate in a nonpartisan election can dramatically increase the probability that a voter will cast a crossover vote. This suggests that voters find it more difficult to locate a copartisan candidate as the number of candidates grows. The pattern of crossover voting in nonpartisan elections observed in Figure 2 is also consistent with candidates’ party not guiding voter choices much at all. Indeed, if Democratic voters are guessing in a race with one Democratic and two Republican candidates, we would expect them to vote for Republicans about two-thirds of the time, which is precisely the pattern we observe in the left bar pairing of Figure 2. We consider this as evidence in support of a conclusion that many voters are not choosing the candidate that best represents them. While we stress anew that partisanship does not map neatly onto policy representation, it is unlikely that most voters are better represented by an out- than in-party candidate, even when two out-party candidates are running.
Voters’ Party Loyalty and Crossover Voting
Contestedness is only one aspect of an election that may shape the likelihood of a crossover vote. The strength of the voter’s party identification is also likely to influence their willingness to cast a vote for the opposite side. More rigid partisans may be better-attuned to unofficial signals from their party. They could also be privy to conversations or other exposure to local party leaders, or might be targeted by nonpartisan candidates looking to signal friendly voters. We therefore expect to find a negative relationship between higher levels of voters’ “party loyalty” 14 and their propensity to vote for an out-party candidate in sub-state races. However, this expectation is conditional on voters being able to identify the Democratic and Republican candidates. As such, we expect that voters’ party loyalty is more likely to be associated with their choices in sub-state partisan elections (where there is an explicit partisan ballot cue) than nonpartisan ones.
Figure 3 depicts the association between voters’ party loyalty scores and the likelihood that they cast crossover votes in sub-state partisan and nonpartisan elections. To provide the clearest comparison, we restrict data in this figure to races contested by one Democrat and one Republican. The y-axis in Figure 3 is the percentage of crossover votes. On the x-axis, we bin voters, where the leftmost and rightmost bins capture voters with perfect Democratic and Republican party loyalty scores, respectively, and the categories between the poles and zero reflect decreasing levels of party loyalty as we approach zero. Percent of crossover votes cast by partisan voters in sub-state partisan and nonpartisan elections contested by one democrat and one republican, by voter party loyalty score.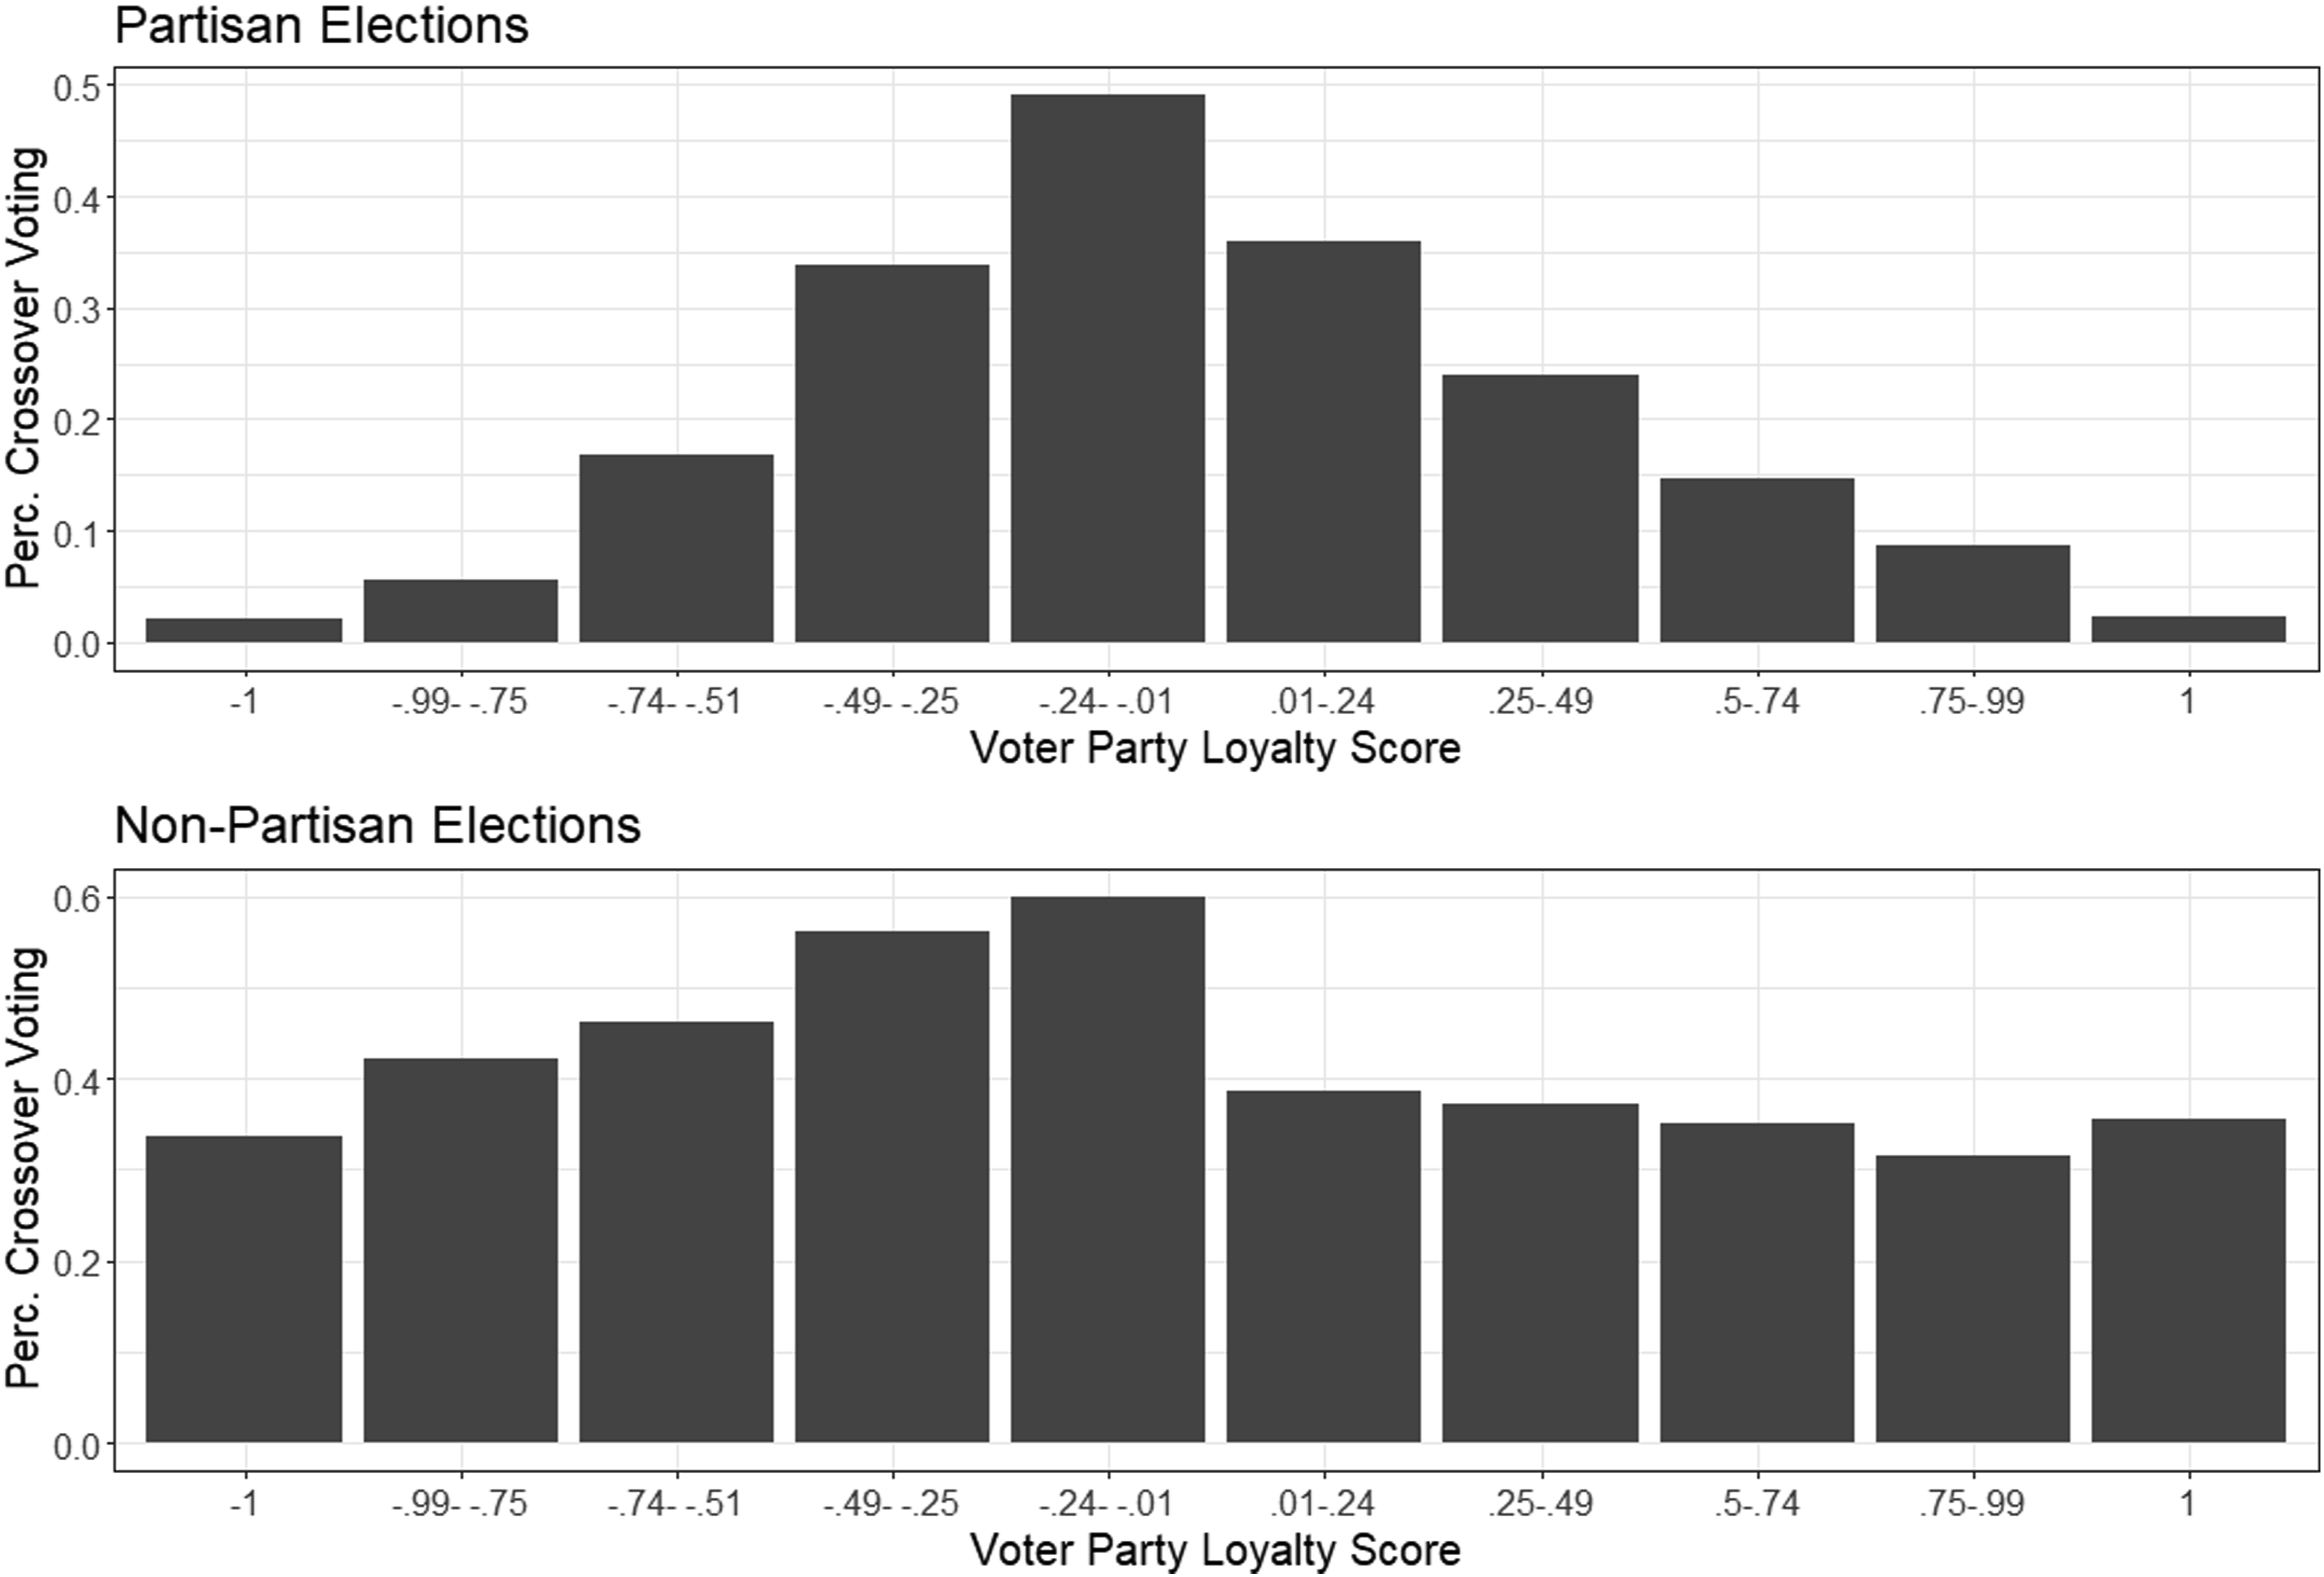
In the top pane of Figure 3, we observe that voters in the center of the party score distribution—that is, voters who split their ticket more evenly (but not exactly evenly, as those voters are excluded from the analysis) between Democrats and Republicans in up-ballot races—were also more likely to cast crossover votes in partisan local elections. For Democratic voters closest to the center of the party loyalty distribution, the probability of voting for a Democrat or Republican in a partisan local election is analogous to a coin toss—just as it was on the statewide partisan part of their ballot. As we move away from the center and toward the poles however, the probability of a crossover vote markedly declines in both parties. Indeed, the likelihood of a crossover vote in sub-state partisan elections from either a Democratic or Republican voter with a perfect party loyalty score is less than 5%. In short, the top pane of Figure 3 reflects the pattern we would expect if voters’ commitment to a party in federal/state elections is strongly associated with their commitment in sub-state races.
The pattern is quite different in the lower pane of Figure 3, which depicts the association between voter party loyalty and crossover voting in sub-state nonpartisan elections. There we find that among Democratic voters, reliable partisans are clearly less likely than less loyal ones to cast a crossover vote—though the likelihood of even the most reliable Democratic partisans casting a crossover vote is more than 10 times higher in nonpartisan elections compared to partisan ones. As Democratic voters’ party loyalty scores approach zero, the likelihood of a crossover vote in nonpartisan elections increases in each subsequent category; about 60% of votes from Democrats nearest the center of the distribution in nonpartisan races went to Republican candidates.
We observe a less clear pattern for Republican voters. Republicans exhibit a generally lower propensity for crossover voting in nonpartisan races than Democrats. We also observe smaller differences between the Republican bins: Regardless of the percentage of their votes going to Republican candidates on the federal/state portion of the ballot, the probability that Republicans cast a vote for a Democrat in a party-contested nonpartisan race is between 30% and 40%. Moreover, the strongest Republicans exhibit a substantively similar probability of voting for a Democrat as the least-loyal Republican voters.
The lack of a strong relationship between partisanship strength and crossover voting among Republicans substantially undermines the argument that voters are carefully determining which candidate best represents them in nonpartisan elections. Although partisanship and policy preferences are not perfectly aligned, we would expect that strong Republican voters are better represented by Republican candidates on questions of policy; they should, in other words, have lower crossover voting rates than weaker Republicans if they are voting solely “on the issues.” Put differently, strong Republicans should not be as well-represented by out-party candidates as weak Republicans; that they nevertheless vote for them at comparable rates in nonpartisan elections provides circumstantial evidence that the strength of Republicans’ partisanship is not helping them to locate Republican candidates in nonpartisan elections. 15
Regression Analysis
So far, our analysis has shown that partisan voters cross over at higher rates in nonpartisan elections, and that the number of candidates and party loyalty of the voter are bivariately associated with how much more or less crossover voting occurs. We next employ several models to consider the independent effects of the factors we have considered so far, while controlling for some other factors (described below) as well. We are especially interested in the extent to which voters apply other heuristics, such as the gender and race of the candidates, to attempt to locate copartisan candidates when party cues are unavailable. As discussed above, prior work provides ample reason to expect that in the absence of party, voters will use candidate gender and/or race to make inference about their partisanship.
For this analysis, we model votes in nonpartisan and partisan elections separately, with distinct models for votes cast by Democratic and Republican voters. 16 The unit of analysis is a cast vote. We employ linear probability models where the dependent variable is coded as a binary indicator Y ij ∈ {0, 1}, where 1 indicates that a vote cast in race i was a crossover vote cast for voter j’s out-party (and 0 indicates a vote was cast for voter j’s in-party). The models, which include electoral race fixed effects and cluster standard errors by voter, return the effect of each variable on the probability that a vote will be cast for an out-party candidate.
As covariates we include the voter’s party loyalty score, as well as a number of variables that capture the conditions of the election. Specifically, we include an indicator for whether an incumbent of the voter’s party was running, as well as an indicator for whether an incumbent of the voter’s out-party was in the race. 17 As we demonstrate above (in Figure 2), the number of candidates in a race has clear implications for voters’ ability to locate copartisan candidates; as such, we include as covariates the number of Democrats and Republicans in each race. 18 Similarly, in a race contested by more rigidly partisan candidates, voters might have an easier time discerning differences between them—and thus, locating their copartisan candidate. We therefore include in the model the range of party loyalty scores between Democratic and Republican candidates in a given race; this is calculated as the lowest (i.e., most loyal Democrat) score among candidates in a given race subtracted from the highest (i.e., most loyal Republican) score. In nonpartisan elections we also include an indicator of whether a copartisan (to the voter) candidate was listed first on the ballot. 19
We incorporate candidate race and gender in each race with a series of indicator variables that reflect the totality of conditions present in our data. In nonpartisan elections, there were five race-party scenarios: (1) White Democrat/White Republican, (2) Black Democrat/White Republican, (3) Black Democrat/Black Republican, (4) One Black Democrat/One Black and One White Republican, and (5) One Black and One White Democrat/One White Republican. We include separate indicators for each scenario in the model. Indicators for scenarios 2–5 are included, making races where one white candidate ran against another white candidate the referent group.
Similarly, there are seven gender-party scenarios in the nonpartisan elections we examine: (1) Male Democrat/Male Republican, (2) Male Democrat/Female Republican, (3) Female Democrat/Male Republican, (4) Female Democrat/Female Republican, (5) Female Democrat/One Male and One Female Republican, (6) One Male and One Female Democrat/Male Republican, and (7) One Male and One Female Democrat/Female Republican. We include indicators for scenarios 2–7 in the model, making the referent group races with one male Democrat running against one male Republican.
Figure 4 depicts regression coefficients and 95% confidence intervals from these linear probability models, where positive coefficients indicate a higher likelihood of crossover voting.
20
The model results for partisan elections appear in the top pane of Figure 4. We begin by discussing the results associated with party loyalty. With respect to voter loyalty, more party loyal voters of both parties exhibit a lower propensity to cross over, holding other variables constant. This is consistent with the descriptive analysis shown in Figure 3 above: The more votes they cast for their party in top-ballot races, the less likely voters are to cross over in sub-state partisan ones. Coefficient estimates from linear probability models of crossover voting in partisan and nonpartisan elections.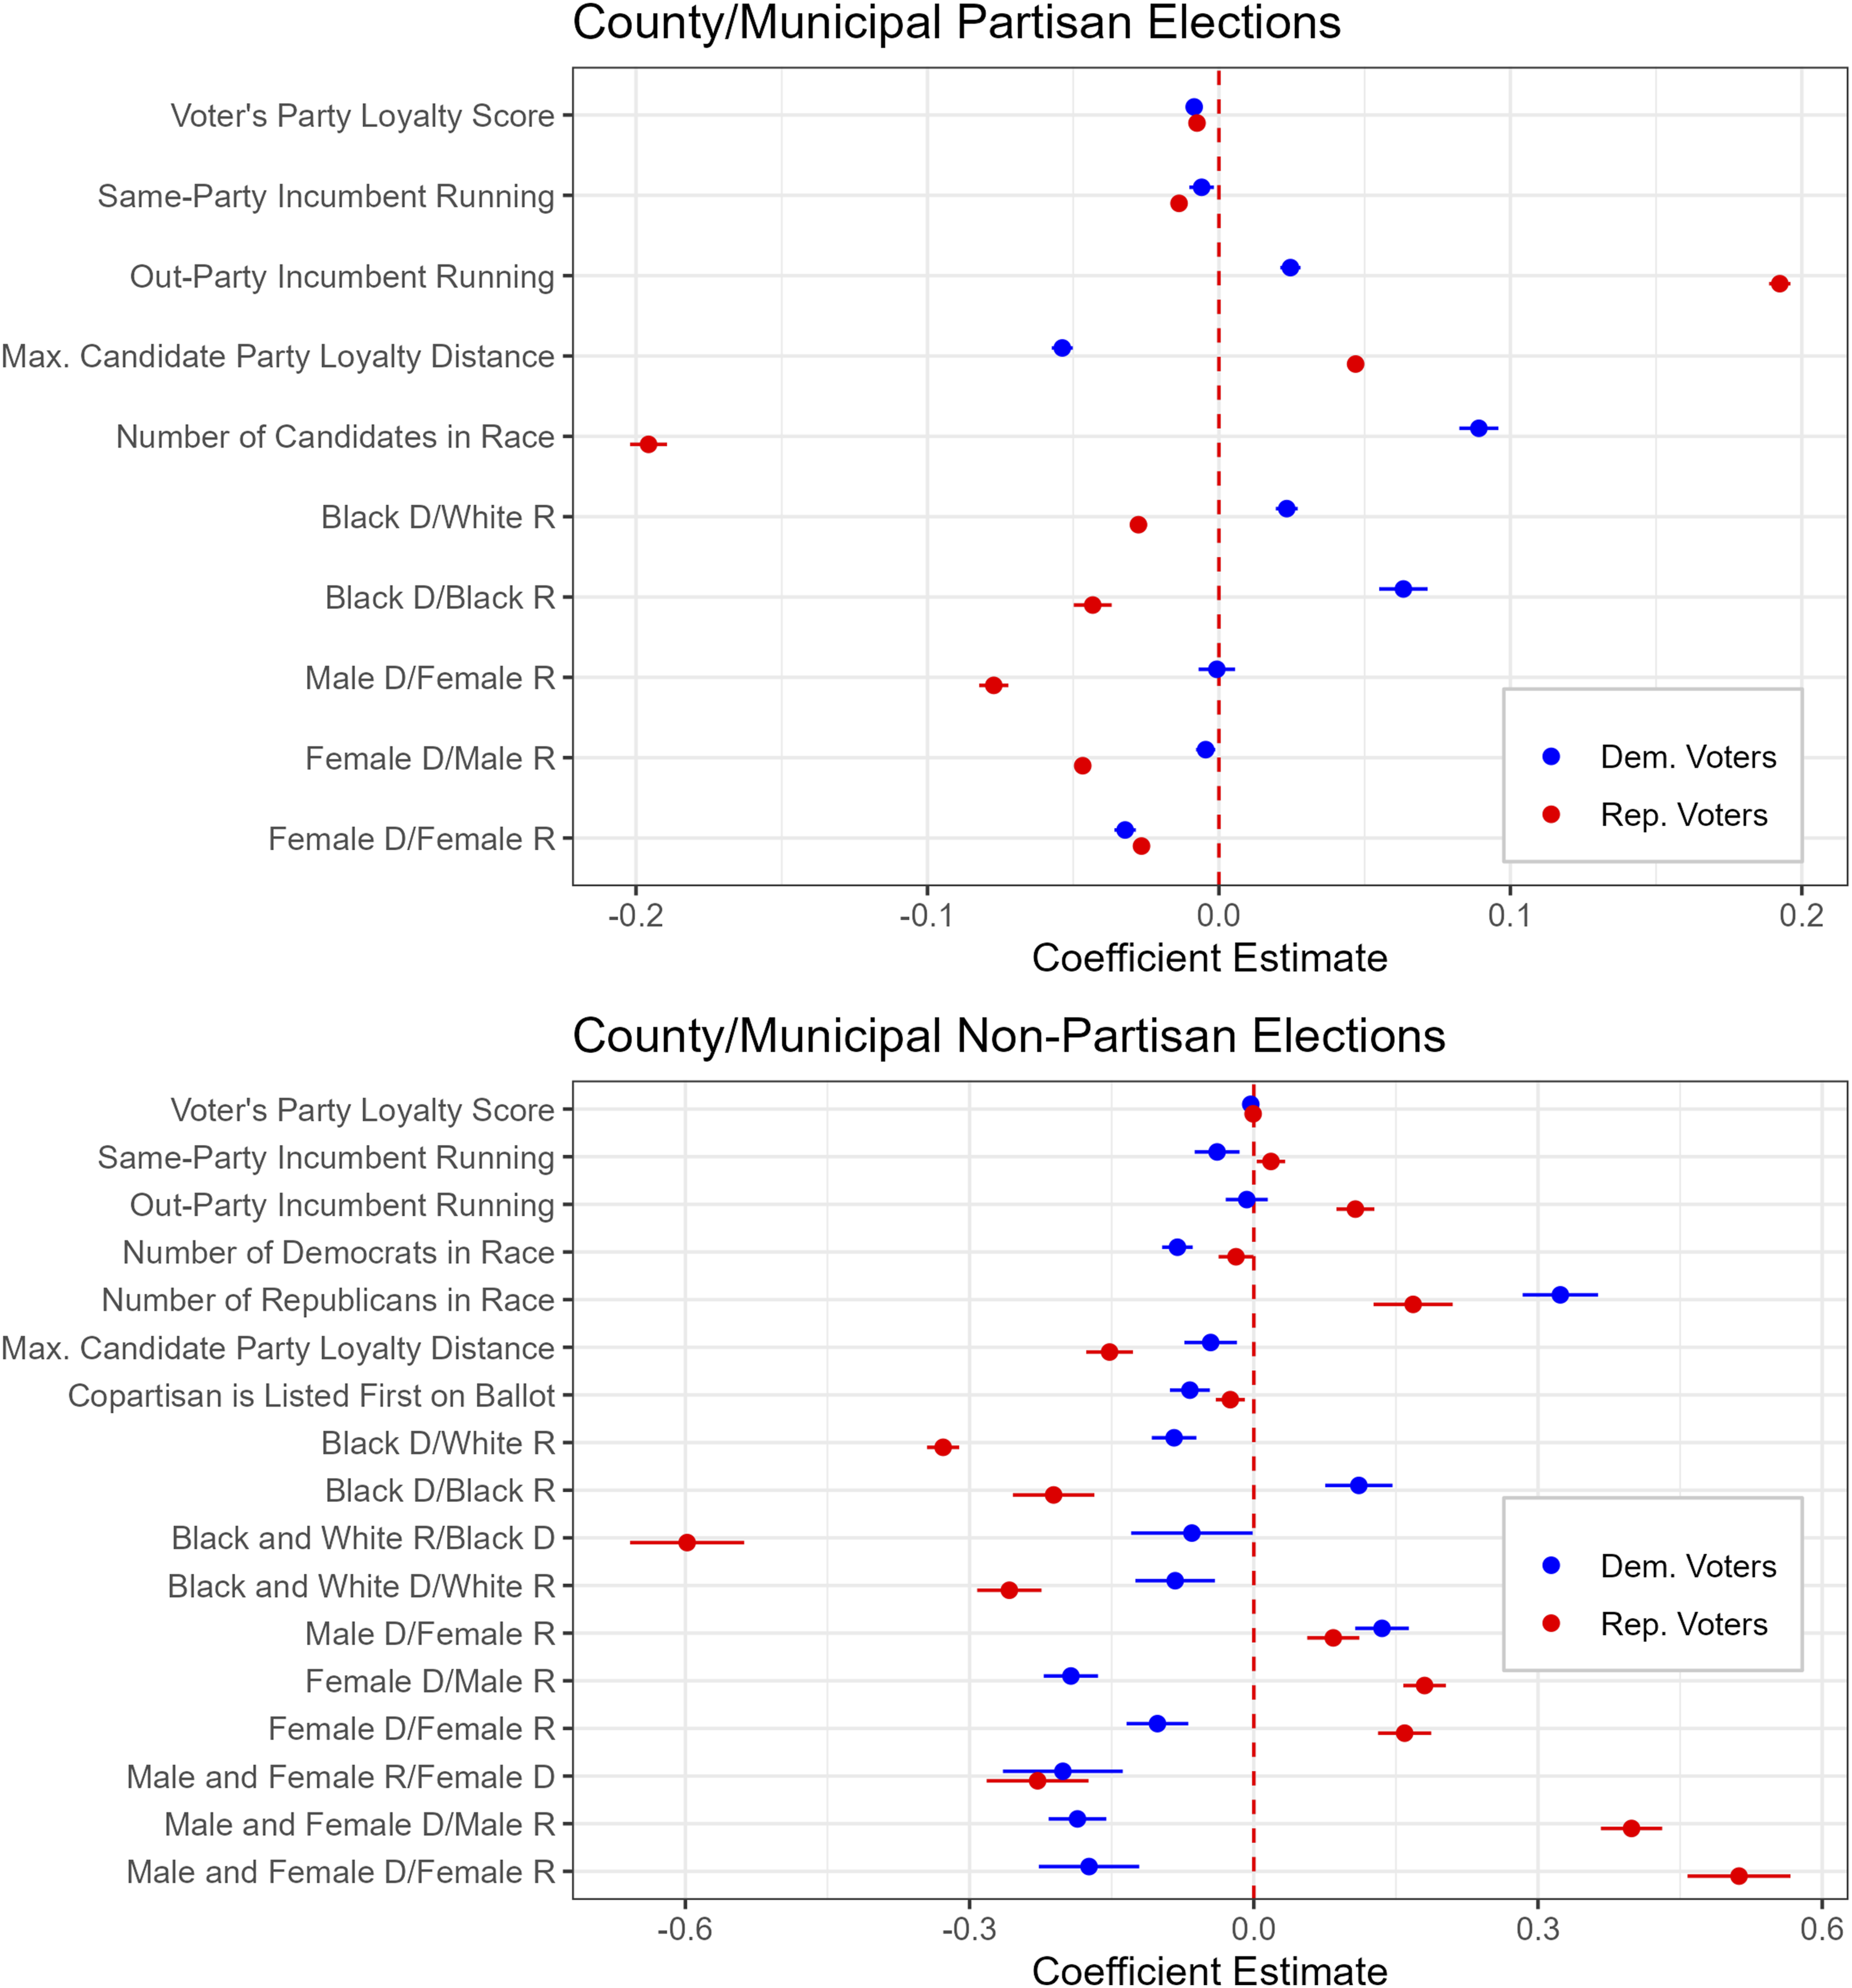
With respect to the party loyalty of candidates, we observe opposing results for Democratic and Republican voters. As the loyalty distance between the candidates in a race increases, the more likely voters should be to distinguish between the candidates. We therefore expect a negative association between maximum candidate party loyalty distance and the likelihood of a crossover vote, which is precisely what we observe for Democratic voters. The opposite is true among Republican voters, however, for whom we observe a positive effect of comparable size (in absolute terms).
We also note here that the effects of incumbency are consistent with descriptive results we report in the Supplemental Material (see Figure A3). Relative to open seat races, the presence of a copartisan incumbent on the ballot is negatively associated with crossover voting among both parties’ voters. The opposite is true when out-party incumbents are on the ballot; their presence is associated with increased crossover voting, especially in the case of Republican voters. The results for both variables are consistent with an inherent incumbent advantage; via higher name recognition, reward for their performance in office, or some other mechanism, incumbents attract voters from out-party voters—even when their partisan affiliation is known.
Turning to the results for nonpartisan elections presented in the bottom pane of Figure 4, we find that many variables display different relationships with crossover voting, relative to what we observe for partisan races. For instance, in nonpartisan elections, a greater party loyalty distance between the candidates is associated with lower rates of crossover voting among Democrats and Republicans. In addition, the coefficient for both Democratic and Republican voters’ party loyalty scores is substantively indistinguishable from zero (and smaller than the effect we observe in partisan elections). This is broadly consistent with the pattern in Figure 3, which showed a less clear relationship between party loyalty and crossover voting in nonpartisan elections compared to partisan ones.
With respect to incumbency, the model results indicate that relative to open seat races, the coefficient for the presence of an in-party incumbent is associated with a slightly increased likelihood of crossover voting among Republican voters, but slightly decreased likelihood among Democratic voters. We observe a similar pattern for the presence of out-party incumbents, but note that the size of effects we observe for out-party incumbents in nonpartisan elections are markedly smaller than in partisan races. 21 The patterns we observe with respect to the directional effects of partisan incumbency dynamics are also not consistent with those we observe in partisan elections, which may indicate that the interplay between candidate party and incumbency does not function in the same way when candidate party is not listed on the ballot.
One potential reason for the absence of clear patterns with respect to incumbency is that voters are favoring different information in nonpartisan races. Indeed, they may simply be guessing. The nonpartisan models yield some evidence of this. For instance, among both Democratic and Republican voters, we find negative effects associated with a copartisan candidate being listed first on the ballot. The magnitude of these effects—7 points for Democrats and (especially) 2 points for Republicans—is comparable to ballot order effects identified in previous research (e.g., Meredith and Salant 2013; Pasek et al., 2014). We also find that among Democratic voters, crossover voting rates decline as the number of Democrats in a nonpartisan race increases, and increase as the number of Republican candidates grows larger. These effects are large in relative terms, and consistent with voters guessing in these races (and the descriptive analysis depicted in Figure 2). Surprisingly, we observe the opposite pattern for Republican voters, who are more likely to cross over as the number of their copartisan candidates increases, and less likely to do so as more Democrats run in nonpartisan contests. This result notwithstanding, the nonpartisan models reveal an element of randomness—possibly driven by guessing—that is not present among votes cast in partisan elections.
Heuristics: Candidate Gender and Race
We conclude our analysis with a discussion of how candidate gender and race might serve as heuristics that influence crossover voting rates in down-ballot elections. In the models presented in Figure 4, we included indicators for all race and/or gender scenarios that occurred in the races we modeled during the 2018 election. In both partisan and nonpartisan elections, the baseline racial scenario is an election in which one white candidate of each party runs. The baseline gender scenario is a pairing where one man of each party contests the election. These indicators allow us to assess the effects of candidate gender, holding candidate race constant, and vice versa. 22 Although Figure 4 displays results for all the racial and gender candidate pairings, we focus our exposition on the examples in which partisan stereotypes about candidates based on their race or gender are typically correct or incorrect.
Specifically, we ask: When underlying assumptions about candidates are correct, does that reduce crossover voting? For example, Black candidates and female candidates are more likely to be Democrats, and voters view them as such (Mcdermott 1998). In a nonpartisan election, voters might therefore guess that a woman/Black candidate is a Democrat, especially when they are running against a man/white candidate. In such races, we might expect crossover voting among both parties’ voters to decrease; because they can make an educated guess as to who the Democrat is, partisan voters will vote accordingly. Conversely, when the characteristics of nonpartisan candidates are opposite of what voters might expect—a male Democrat running against a female Republican, for example, we might expect crossover vote rates to be higher among both Democratic and Republican voters.
We first focus on the set of races in which heuristics would, on average, work against voters identifying the in-party candidate in a nonpartisan race: When a male Democrat runs against a female Republican. 23 In the partisan contests, this pairing (relative to when both candidates are male) has no bearing on Democratic crossover voting. This is not true for Republicans, however, who are considerably more supportive of female Republican candidates than male ones, other things equal. In other words, when partisanship is known, the “unexpected” (or, at least, less common) pairing does not lead to more crossover voting for either Democrats or Republicans. In nonpartisan races, however—when, voters may be attempting to infer candidates’ ideological positions based on their gender—this pairing leads both Democrats and (to a slightly lesser extent) Republicans to support the out-party candidate at higher rates. In other words, Democrats vote for the (female) Republican candidate and Republicans the (male) Democratic candidate at a much higher rate than they do in the same electoral scenario when the partisanship of the candidates is known.
We next turn to the two electoral scenarios in which heuristics should, on average, assist voters in locating copartisan candidates. First, when a Black Democrat is running against a white Republican in a partisan election, both Democratic and Republican voters are about 2–3% points more likely to support the Republican candidate (Democrats are more likely to cross over, Republicans are less likely to do so), perhaps reflective of racial prejudice (Piston 2010). These effects, however, are markedly different in nonpartisan races. There, Republicans are far more supportive of the (white) Republican candidate (by about 30 points). In addition, Black Democratic candidates actually reduce crossover voting for Democrats. Put differently, the prejudice against a Black candidate (as seen in the partisan races for partisans of both parties) might be somewhat balanced out by the in-party cue sent by the candidate’s race to Democrats.
A similar, if muted, pattern occurs when a female Democrat runs against a male Republican. When candidates’ partisanship is known to the voters in a partisan race, Republicans are less likely to support a female Democrat than a male Democrat, other things equal. Democrats, meanwhile, do not seem to have much of a preference for male or female Democrats (the coefficient is statistically significant, but substantively represents a shift of roughly one-half a percentage point). When a female Democrat is running against a male Republican in a nonpartisan election, however, she attracts both Democratic (as they are less likely to cross over) and Republican (as they are more likely to cross over) votes. It would appear, then, that Democrats are “learning” about her partisanship and allowing that to inform their vote choice. In the case of Republicans, it is worth noting that in the partisan races Republicans support female Republicans more than male Republicans in all cases. That female Democrats attract Republican votes when their partisanship is unknown might thus represent a preference for female candidates among Republicans when they are not known to be Democrats. 24
In sum, for all three tests, crossover voting among Democrats shifts in the direction we would expect if they were attempting to infer the partisanship of nonpartisan candidates based on those candidates gender and racial identity. The pattern for Republican voters follows the expected pattern for two of the three tests. In total, our results suggest that while voters struggle overall to locate a copartisan candidate in nonpartisan, low-information elections, they employ available heuristics—sometimes in a manner that results in more crossover voting—when casting their ballots.
Discussion
Using millions of votes recovered from South Carolina’s election audit system, we assessed the extent to which demonstrably partisan voters cast crossover votes in down-ballot partisan and nonpartisan elections. To address this question, we made two methodological contributions. First, we used the CVRs to measure the underlying partisanship (and party loyalty) of a voter. Second, we devised a measure of partisanship (and party loyalty) of nonpartisan candidates using information from the voter file. In doing so, we contribute to literature showing that CVRs can be used to assess voting behavior using individual-level, non-survey data (Kuriwaki 2025; Kuriwaki et al. 2024), demonstrating that CVRs provide a fruitful avenue for exploring theories in political science that have previously been restricted to survey, experimental, and aggregate (electoral returns) data.
Substantively, we find higher rates of crossover voting in nonpartisan elections compared to partisan elections. Moreover, higher rates of crossover voting are present—and even more pronounced—in nonpartisan races in which both Democratic and Republican candidates square off. This suggests that voting contra partisanship in nonpartisan races is not simply an artifact of those nonpartisan races being contested by only candidates from a single political party. For example, the most direct comparison we make is between partisan and nonpartisan county council elections. In those elections, we find crossover voting to be roughly seven times more likely to occur in the nonpartisan races. Moreover, both Democrats and Republicans in South Carolina deviate from their partisan voting patterns in nonpartisan elections, and do so even when candidates from both parties contest those nonpartisan elections. This suggests that the overall results do not stem from one party’s voters being unable to locate copartisan candidates in nonpartisan elections.
We also find that while voters struggle overall to locate a copartisan candidate in nonpartisan, low-information elections, consistent with the theory of low-information rationality articulated by Popkin (1994), voters do appear to employ available heuristics when casting their ballots. This result is consistent with work finding that voters are more reliant on heuristics other than partisanship when voting in nonpartisan elections (e.g., Kang and Song 2023; Kirkland and Coppock 2018). In particular, we find that both the gender and race of the candidates on the ballot are associated with the likelihood of a voter crossing “party” lines when they cast a nonpartisan ballot. Overall then, our results suggest that voters often lack key pieces of information when voting in nonpartisan elections, and do their best to fill in the gaps.
There are, of course, limitations to the present study. For instance, in South Carolina incumbency status is not listed on the ballot. So, although we find a slight incumbency benefit in nonpartisan races, we expect this effect would be larger in states where the ballot indicates the incumbent. In addition, the cast vote records are of course anonymous, preventing us from learning about the characteristics (e.g., gender and race) of the voters. Future work should therefore continue to refine our approach here, perhaps in other states where CVRs can be tied to voter precincts. This would facilitate analyzing other covariates of crossover voting, along with increased precision on the use of heuristics in, for instance, racially homogeneous precincts.
Similarly, qualitative work could explore how local campaign dynamics and spending might shape how voters learn about nonpartisan candidates (as previous experimental work has shown the amount of “partisan” content about the candidates available to voters in nonpartisan elections matters; see, e.g., Bonneau and Cann (2015)). Finally, future work could explore the role of local media in structuring participation in nonpartisan elections, something that could explain the discrepancies between our results and survey-based evidence that finds ideological voting is possible for some voters in some nonpartisan elections (e.g., Holman and Lay 2021). The possibility of ideological voting in nonpartisan elections may be more likely with more local media coverage of those elections, which we do not account for in our analysis.
Despite these limitations, the fact that a nontrivial proportion of voters are less likely to vote for the most ideologically proximate candidate in nonpartisan compared to partisan elections has clear normative implications. In the early years of the 20th Century, Progressive reformers sought to weaken political parties by instituting nonpartisan elections around the country (Adrian 1952). These reformers saw parties as corrupt and out of place in modern, technocratic governance at the local level; as New York City’s Fiorello La Guardia reportedly said, “There is no Republican or Democratic way to pick up the garbage.” Today, many voters continue to be attracted to the idea of nonpartisan elections as a way to ease the polarization that characterizes American politics in the 21st Century (e.g., Purnell 2023; Reilly 2023). One assumption behind these stances, however, is that voters will diligently conduct research before arriving at their polling place, and will successfully identify the candidate for whom they should vote without relying on the partisan cues that would purportedly blind them.
Our results undermine this assumption, and we stress that they are likely a conservative estimate of the difficulties that voters face in nonpartisan elections. South Carolina’s CVRs do not allow us to determine how many voters abstained in a given race. We therefore cannot account for the unknown number of voters who “rolled off” and therefore also failed to support the candidate most aligned with their preferences. Thus, while we present evidence here that a large proportion of voters are casting votes for nonpartisan candidates that they may not have cast with more complete information, we have likely identified only part of this pattern.
The pattern we do identify offers some sobering results, however. For instance, in a supplemental analysis (presented in Table A4), we use our results to offer some back-of-the-envelope calculations for what proportion of nonpartisan elections might have different outcomes, assuming crossover voting rates akin to those in sub-state partisan races (instead of the rates observed in the nonpartisan races). 25 To provide an apples-to-apples comparison, we constrain the universe of nonpartisan races to the 14 in which one Democrat and one Republican ran. The estimates suggest that in as many as half of those elections, the outcome might have been different if not for the crossover voting induced by a lack of party ballot labels. To be sure, it is not obvious that this rate extends to other nonpartisan elections featuring more (or less) complicated candidate mixes than one Democrat and one Republican. Nevertheless, this calculation highlights the potential for nonpartisan races to result in less optimal (ideological/partisan) representation.
In sum, our findings raise critical questions about how representative nonpartisan elections can be if so many voters are casting what appear to be uninformed votes. This is especially concerning given the ubiquity of nonpartisan offices in America’s counties and municipalities. Using CVRs and other techniques, scholars can continue exploring the potential distorting effect of nonpartisan elections on local governance, as well as the variations in local conditions (e.g., newspaper endorsements, party endorsements, activist group voter guides, etc.) that provide (or fail to provide) information about the partisanship of the candidates for nonpartisan offices.
Supplemental Material
Supplemental Material - Crossover Voting Rates in Partisan and Nonpartisan Elections: Evidence From Cast Vote Records
Supplemental Material for Crossover Voting Rates in Partisan and Nonpartisan Elections: Evidence From Cast Vote Records by Conor M. Dowling, Michael G. Miller, and Kevin T. Morris in Political Research Quarterly.
Footnotes
Acknowledgments
This paper previously appeared on the programs of the 2022 Election Science, Reform, and Administration meeting, the 2023 Annual Meeting of the Midwest Political Science Association, and the 2024 Annual Meeting of the Southern Political Science Association. We thank participants on those panels, as well as the Binghamton University Department of Political Science, Donald P. Green, Brian Hamel, Joshua Hostetter, and Jonah King for helpful suggestions. Nicki Camberg, Emma Sherman-Hawver, and Julia Shimizu provided research assistance.
Declaration of Conflicting Interests
The author(s) declared no potential conflicts of interest with respect to the research, authorship, and/or publication of this article.
Funding
The author(s) received no financial support for the research, authorship, and/or publication of this article.
Supplemental Material
Supplemental material for this article is available online.
Notes
References
Supplementary Material
Please find the following supplemental material available below.
For Open Access articles published under a Creative Commons License, all supplemental material carries the same license as the article it is associated with.
For non-Open Access articles published, all supplemental material carries a non-exclusive license, and permission requests for re-use of supplemental material or any part of supplemental material shall be sent directly to the copyright owner as specified in the copyright notice associated with the article.